In 1989 the Iron Curtain fell quickly and unexpectedly, ending the separation between Western Europe and the Soviet Union. After 44 years of an almost completely sealed border, trade was suddenly free to reconnect. Despite the political and economic turmoil within the eastern regimes, trade between the West and East almost doubled within five years after 1990. By the year 2000 it had almost tripled. We study this trade in the aftermath of the collapse of the Soviet Union. We pay special attention to Austria, a country that has engaged in trading opportunities beyond what would be expected given its size and geographic location, and might have been expected to be the main western beneficiary of Europe’s economic expansion eastwards.
In a standard gravity equation setting, we document that Austria indeed trades more with countries east of the Iron Curtain after 1990 than gravity would predict. However, we find that this effect is found only with the members of the former Habsburg Empire.Footnote 1 It declines linearly and monotonically, and, in our preferred specification, becomes statistically insignificant after a decade while the predicted magnitude becomes zero after two decades. This trade surplus is not visible for trade relationships between Austria and the other countries east of the Iron Curtain once we additionally control for the Habsburg effect. The magnitude of the Habsburg surplus trade in 1990 is very large, about four times the effect of a monetary union. We find no similar surplus trade for other western countries with the East.
We argue that these results can best be explained by assuming a deterioration of specific components of “trading capital” built up during the Habsburg years and maintained throughout the Cold War period. The 44 years of Iron Curtain division severed all formal and business relationships, almost all trade between the East and West, and made personal contacts difficult. However, historical legacies and cultural linkages persisted, facilitated by some low level economic ties during the Cold War. The decline of this surplus after 1990 reflects the continued dissolution of trading capital and the build-up of trading capital with other countries in Western Europe.
The term “trading capital” is introduced by Keith Head, Thierry Mayer, and John Ries (Reference Head, Mayer and Ries2010, hereafter HMR) who show that after independence former colonies continue to trade for a long period with their colonizers, but at a declining rate. They suggest that this observation might point to the presence of trading capital that is built up during colonization, and deteriorates after independence. Trading capital consists of various components that we can divide into three broad categories that facilitate trade: (1) physical capital, such as roads, railway lines, or pipelines that connect countries and directly facilitate trade through reduced bilateral trade costs; (2) capital relating to personal communication, direct human interaction and contacts, or trust built up in repeated games, such as provided in structures of multi-national firms, joint ventures, or by frequent personal contacts and trust won through repeated interaction; and (3) all other variables that facilitate trade, that are not based on personal interaction and formal or physical structures. These last include all notions of cultural familiarity, such as those facilitated by cultural norms, language, history, consumers’ familiarity with products, and trust based on similarity and familiarity of people with each other. Category (3) may include past decisions on institutional design and standards as basic as which side of the road to drive on or what type of electric plug design to adopt.
We argue that the declining surplus trade of Habsburg countries after 1989 is comparable to the dissolving trading capital described by HMR, but given the history of Central Europe relates only to that part of trading capital that was not isolated by the Iron Curtain, which are mainly the elements described in point (3). At the beginning of the century the Habsburg Monarchy was a politically and economically well integrated country. In the second half of the century it was split into two parts that were strictly separated for 44 years by the Iron Curtain. During the separation, all formal institutions of the Empire ceased to exist as there were several waves of drastic institutional changes especially east of the Iron Curtain. Personal relationships were hard to maintain, and multinational firms connecting the East and West as well as other formal institutions were broken apart. Physical transport capital such as railway lines, pipelines, and roads—already badly damaged in WWII—were deliberately destroyed, or left to deteriorate. At the same time institutions and norms converged within the East and within the West of the Iron Curtain into two distinct blocks. The historical circumstances thus offer a natural experiment setting in which we can observe some components of trading capital only between members of the former Habsburg Empire. In particular, any surplus trade observed after 1989 will overwhelmingly include those parts of trading capital that relate to point (3). Comparing these effects to HMR we find that these forces explain a quantitatively large part of trading capital, and that they deteriorate at a rate smaller than suggested for all trading capital by HMR.
We add direct evidence for this hypothesis in several ways. First, we show that this surplus trade appears for the Habsburg countries, but not for a number of placebo combinations between western and eastern countries in Europe. We also verify that our main finding, the declining surplus trade for Habsburg countries, is highly robust to alternative empirical strategies. When looking at the product level, we see the effect mainly for homogeneous rather than heterogeneous goods. We would expect this if countries follow a heuristic not based on economic rationale alone, since homogeneous goods make substitution less costly. We also see that the effect is stronger for those goods that were traded during the Habsburg Monarchy. Finally, we rule out a number of possible alternative explanations. We present evidence that information, trust, and relationships are most likely to explain the findings.
Our article adds to the literature showing that the degree to which such cultural forces influence trade seems to be large (e.g., Algan and Cahuc Reference Algan and Cahuc2010; Disdier and Mayer Reference Disdier and Mayer2007; Michaels and Zhi Reference Michaels and Zhi2010), linkages between countries are highly persistent once built up, and trade once interrupted takes a long time to recover (Felbermayr and Gröschl Reference Felbermayr and Gröschl2014; Nitsch and Wolf Reference Nitsch and Wolf2013). There have also been suggestions that culture matters more for trade than either institutions or borders (Becker, Boeckh, Hainz, et al. Reference Becker, Boeckh and Hainz2014). Our article also adds to a growing literature which emphasizes the long persistent effects of borders, institutions, and culture. For example, Luigi Guiso, Paola Sapienza, and Luigi Zingales (Reference Guiso, Sapienza and Zingales2009) establish the importance of trust and cultural similarity on economic exchange. Meanwhile, Peter Egger and Andrea Lassmann (Reference Egger and Lassmann2015) and Jacques Melitz and Farid Toubal (Reference Melitz and Toubal2014) document the importance of common languages. However, it is difficult to distinguish between cultural similarity and ease of communication. Cultural proximity is inherently difficult to measure. A number of recent studies have thus used proxy measures for cultural proximity such as voting behavior in the Eurovision Song Contest (Felbermayr and Toubal Reference Felbermayr and Toubal2010) or the United Nations General Assembly (Dixon and Moon Reference Dixon and Moon1993). Alfred Lameli, Volker Nitsch, Jens Südekum, et al. (Reference Lameli, Nitsch and Südekum2015) show that the similarity of German dialects is an important predictor of trade within Germany. We add to this literature by providing an example and new measure of both the resilience of such historic and cultural effects on trade, as well as on its decline.
Our article’s methodology is related to Stephen Redding and Daniel Sturm (Reference Redding and Sturm2008), who study the development of towns in West Germany and use the fall of the Iron Curtain as a natural experiment. Nitsch and Nikolaus Wolf (Reference Nitsch and Wolf2013) document that it takes between 33 to 40 years to eliminate the impact of the Iron Curtain on trade within Germany. Our article mirrors Nitsch and Wolf (Reference Nitsch and Wolf2013): While they show that borders remain visible in trade statistics long after they have been abolished, we demonstrate that borders take a long time to diminish trade when newly constructed. Simeon Djankov and Caroline Freund (Reference Djankov and Freund2002) document that Russian regions continued to trade with each other more after the collapse of the Soviet Union, which is broadly consistent with our findings. Other studies that use a similar setting to our article are Max Schulze and Wolf (Reference Schulze and Wolf2009) who examine trade within the Habsburg Monarchy in the late nineteenth century and find that borders that later emerge become visible in price data long before the collapse of the Empire. Rodney Thom and Brendan Walsh (Reference Thom and Walsh2002) study the trade effect of Anglo-Irish monetary dissolution and find little effect on trade. Sascha Becker et al. (Reference Becker, Boeckh and Hainz2014) also present evidence on the importance of the Habsburg Empire on cultural norms. When comparing individuals living east and west of the long-gone Habsburg border, they find that people living on territory of the former Habsburg Monarchy have higher trust in courts and police. They argue that the former Empire had an enduring effect on people’s values through its decentralized, honest, and widely accepted state bureaucracy.
Trade is only one of many possible measures that could be influenced by historical legacies and cultural persistence. Migration and foreign direct investment might be others. Like HMR we choose to discuss this effect in terms of trade given that trade is recorded in a more consistent way and at a higher frequency than the other two measures. It is also less influenced by political decisions. For example, migration in Europe remained highly politically regulated until the European Union (EU) enlargement, and migration numbers are thus politically constrained.
Historical Overview
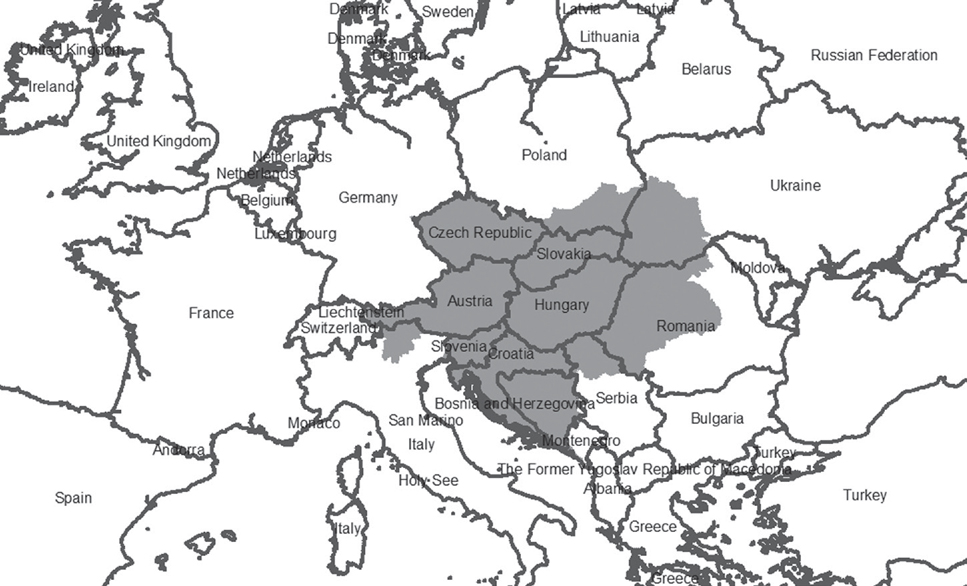
In this article, we take the borders of the Habsburg Empire as they were just before the outbreak of WWI, displayed in Figure 1. While the Habsburg family had ruled the Empire for many centuries with changing borders, unification attempts and the introduction of a centralized administration came fairly late in the course of the eighteenth century.Footnote 2 For our purposes, it is important that the Empire maintained a large, stable, and well integrated market with large internal trade flows throughout its last decades.
Austro-Hungarian Empire in 1910 and Modern Country Boundaries

Although the Austro-Hungarian Empire had a large degree of ethnic and linguistic diversity, all parts of the Empire were linked by a common official language, common legal institutions, and administration, as well as an expanding rail network. A strong emphasis on free trade strengthened the economic integration and trade flows within the country throughout the nineteenth century (Good Reference Good1984). The Empire possessed a fully integrated monetary union with full control maintained by the Austro-Hungarian Bank in Vienna. Fiscal policy of the Empire was run as a joint operation, with separate budgets in Austria and Hungary contributing to the same common imperial expenditures and debt services (Eddie Reference Eddie1989).
The Empire consisted of 53 million people, numbering 13 percent of the total European population and producing 10 percent of Europe’s gross domestic product (GDP) (Butschek Reference Butschek2012). As these figures imply, the economic condition of the Austro-Hungarian Monarchy in its final decades prior to 1913 was poor in comparison to other European countries.Footnote 3 Before the collapse of the Empire, some internal trade barriers became visible in price data at the end of the nineteenth century, and nationalism was on the rise long before the collapse (Schulze and Wolf Reference Schulze and Wolf2009, Reference Schulze and Wolf2012). Yet these studies highlight that the Empire possessed a heavily integrated internal market at the beginning of the twentieth century regardless of these tendencies. The Empire further consisted of a well-functioning administration that unified the workings of many institutions across the regions it governed. The importance of the attachment of people to the imperial administration and its government, and the political, economic, and cultural integration of its parts is highlighted by Christopher Clark (Reference Clark2013, p. 71)Footnote 4 and John Boyer (Reference Boyer1989, p. 311)Footnote 5 among other historians.
The end of WWI brought declarations of independence, which were sealed by the treaties of Saint Germain (1919) and Trianon (1920). New borders were drawn and new countries appeared, along lines of ethnicity, language, and trade networks. All the newly founded democracies on the territory of the former Empire now included large numbers of ethnic and linguistic minorities. The newly founded Republic of Austria was left with 23 percent of the population of the former Habsburg Monarchy. New borders followed a pattern of economic fragmentation that had emerged during the late nineteenth century (Wolf, Schulze, and Heinemeyer Reference Wolf, Schulze and Heinemeyer2011). Yet trade between countries of the former Empire remained high in the 1920s. Georges De Menil and Mathilde Maurel (Reference De Menil and Maurel1994) present evidence for strong trade in the years 1924–1926 among successor states of the former Empire, roughly of the magnitude of trade within the British Empire at that time. They explain the persistence of trade by pointing to common history, shared linguistic, and cultural ties, and mention the importance of business and personal relations as well as networks—all parts of trading capital. Institutional drift, however, had started. New and different currencies were introduced. For example, Hungary replaced the Austro-Hungarian korona with its own korona after independence only to replace it again by the pengo in 1925 and forint in 1946 following hyperinflation. The Austrian-Hungarian national railways were also split into multiple corporations, though traffic across the former Empire continued at a significant pace (De Menil and Maurel Reference De Menil and Maurel1994).
World War II substantially disrupted trade, and it did not recover in the aftermath. Beginning in 1947, communist regimes in Central and Eastern Europe emerged under Soviet rule. The Sovietization of these economies caused a break in trade relations with the West, and foreign trade was organised as a strict state monopoly. Much of this remaining trade was arranged from Moscow, and negotiated at the highest political level, often as part of political bargains. An example for this was the export of goods to the Soviet Union worth 6.6 billion Austrian schillings in the aftermath of its independence in 1955 (Resch Reference Resch2010). Agnes Pogany (Reference Pogany2010, p. 147) writes on the relationship between Austria and Hungary: “Economic ties […] became insignificant in the years following World War II. Centuries-old relations were reduced to a minimal level […].” While Moscow took control of trade in the eastern countries, on the western side trade was also heavily politically influenced. The main driver of this was the Co-ordinating Committee for Multilateral Export Controls (COCOM), established in 1949, an institution to organise embargoes against Soviet countries. Austria did not formally become a COCOM member, but its eastern trade was influenced heavily by it under the obligations coming with Marshall aid (Resch Reference Resch2010). Economic cooperation was politically motivated and largely symbolic.
Large parts of infrastructure, especially the railways, were destroyed during the war and they would only partially be rebuilt taking into account the post war borders. An anecdote might highlight the poor recovery of infrastructure: The two capitals closest to each other in Europe are Vienna and Bratislava, at a distance of less than 60 kilometers. During the time of the Empire there was a tramway that connected both cities, the “Pressburger Bahn.” There has been no similar connection during the post war period and today the time to travel from one city to the other is larger than it was in 1900.Footnote 6
The Iron Curtain was an ideological boundary, but also primarily a geographical border. The most substantial cut to trade relations was brought about by the erection of the physical Iron Curtain, whose construction begun in 1949. The new border ran right through the former Habsburg countries, splitting Austria and the formerly Austrian parts of Italy from the rest. After the Hungarian Uprising of 1956 the already very limited possibility of transit ceased and all activity crossing this border was further suppressed. The border was sealed by barbed wire, land mines, high voltage fences, self shot systems, and other means. Only few people with special permissions were allowed close to the border. As such the Iron Curtain thus presented a completely sealed border that cut off all former local economic activity between the two sides (Redding and Sturm Reference Redding and Sturm2008).
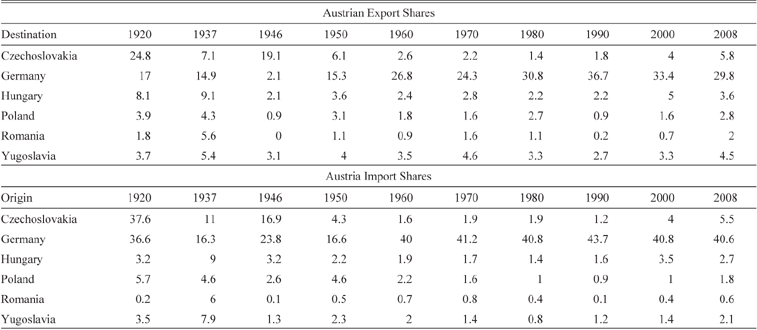
Furthermore, the economies of Hungary and Czechoslovakia switched to central planning. Multinational companies were split, personal interaction and communication over the border became increasingly difficult and rare. Table 1 shows the development of imports and exports from Austria to former Habsburg countries, and Germany.Footnote 7 The table shows a large decline of both imports and exports between Austria and the other former Habsburg countries after 1920 and again after 1946. For example, Austrian imports from Czechoslovakia fell from 37.6 percent in 1920 to 2 percent in 1960. Austrian exports to Czechoslovakia fell from 24.8 percent in 1920 to 2.6 percent in 1960. As apparent from Table 1, Austrian trade with Hungary, Poland, Romania, and Yugoslavia equally shows this decline. Austrian trade was directed instead towards western trading partners, as demonstrated the opposing trend of exports and imports to and from Germany.
Trade Over Time

Notes: The top panel shows the share of exports from Austria to selected destinations over time. The bottom panel shows imports to Austria from selected origins over time.
Source: Butschek (Reference Butschek2012, tables 38, 75, and 76).
The relationships of the West with Yugoslavia were different from those with Hungary and Czechoslovakia because Yugoslavia—despite being socialist and autocratic—maintained looser ties with Moscow (Lazarevic Reference Lazarevic2010). This allowed the United States to contribute to aid programs from 1952. Eventually this even led to the accession of Yugoslavia to GATT (the General Agreement on Tariffs and Trade) in 1966. Yugoslavia maintained sizeable trade relationships with the West, which in some years even exceeded its trade levels with the Comecon countries. Its main trade partners in the West between 1955 and 1986 were members of the European Economic Area (Belgium, Luxembourg, France, Italy, the Netherlands, West Germany, Great Britain, Denmark, and Ireland). For example, in 1986 Yugoslav exports to the EEA countries were more than 7 times as large as exports to EFTA (Austria, Norway, Portugal, Sweden, and Switzerland) (Lazarevic Reference Lazarevic2010), which suggests that trade between Yugoslavia and Austria was not particularly developed during the Cold War.
We mention only two properties of the fall of the Iron Curtain which are important here, namely that it happened fast and that it was noted by almost everyone on either side of the border with surprise (Redding and Sturm Reference Redding and Sturm2008).
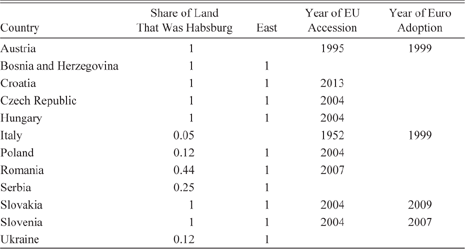
These large changes of the map of Central Europe in the course of the twentieth century are displayed in Figure 1. The map displays modern country boundaries and a map of the Habsburg Empire in 1910. Table 2 shows the percentage of modern territory that was part of the Austro-Hungarian Empire for modern countries. Most of the countries that were part of the Empire are in the east, by which we indicate countries that were on the eastern side of the Iron Curtain, to which we also add the countries of former Yugoslavia: Bosnia and Herzegovina, Croatia, the Czech Republic, Hungary, Slovakia, Slovenia as well as parts of Poland, Romania, Serbia, and the Ukraine. On the western side of the Iron Curtain are Austria and South Tyrol, which is now part of Italy.
Habsburg Members

Notes: Share of land that was Habsburg denotes the share of the area of the modern country that was part of the Habsburg Monarchy in the year 1910. The Habsburg dummy consists of countries with values of 1 in Column 1. Missing values in the last two columns indicate no membership in 2013.
Source: Author calculation (Share of land), Encyclopaedia Britannica (rest).
Empirical Strategy and Data
To investigate persistence of Austrian trade with countries east of the Curtain (Austria-East), a variable indicating a trade flow between Austria and a country east of the Iron Curtain, and members of the former Habsburg Monarchy after decades of Cold War, we largely follow the methodology used by HMR. They develop a method to address a closely related question, and the similarity allows us to compare our estimates to theirs. We estimate gravity equations, to which we add (Austria x East) x year and Habsburg x times x year dummy variables, which are our principal variables of interest. We run the estimations once jointly with Austria-East and Habsburg dummies, and once separately only including one set of dummies interacted with year. We use the boundaries of the Habsburg Empire in its last days. The gravity framework captures the counterfactual multinational trade had there been no Habsburg relationship. The (Austria x East) x year and Habsburg x year indicators capture any trade in excess of what the gravity model alone would predict.
The well-known empirical and theoretical formulations of the gravity equation can be represented in the following form, in the notation of HMR:
 ${\rm{X}_{{\mathop{\rm int}} }} = {\rm{C}^{ex}}_{\rm{it}}{\rm{C}^{im}}_{\rm{nt}}{\varphi _{{\mathop{\rm int}} }},$
where Xint denotes importer ns total expenditure on imports from origin i in year t, Cexit, and Cimnt are origin and destination attributes in a specific year, and φint measures bilateral effects on trade. Since there is no set of parameters for which equation (1) will hold exactly, the conventional approach is to add a stochastic term and estimate after log-linearizing. Head and Mayer (Reference Head and Mayer2013) or Egger (Reference Egger2000) provide overviews of this technique including a number of theoretical foundations which yield gravity equations. In particular, we estimate equation
 $\ln ({\rm{X}_{{\mathop{\rm int}} }}) = {\mu _{\rm{it}}} + {\mu _{\rm{nt}}} + \gamma\,{\rm{D}_{{\mathop{\rm int}} }} + {\delta ^{(\rm{Aus}{\rm{ }}\,\rm{x}\,{\rm{ }}\rm{East})}}{(\rm{Aus}{\rm{ }}\,\rm{x}\,{\rm{ }}\rm{East})_{{\mathop{\rm int}} }} + \delta\,{\rm{H}_{{\mathop{\rm int}} }} + {\delta ^{\rm{east}}}\,{\rm{H}_{{\mathop{\rm int}} }}^\rm{east} + {\varepsilon _{{\mathop{\rm int}} }},$
where μit and μnt denote origin x year and destination x year fixed effects, respectively, and δ coefficients to be estimated. The inclusion of sets of fixed effects interacted with year makes separate time fixed effects redundant. Matrix Dint denotes pairwise covariates that may be time varying or not. In an effort to distil the main effect of interest as precisely as possible, we include as detailed fixed effects as possible. In particular, we include the variables shared border, common official and spoken language, and common legal institutions as time varying dummy variables to flexibly account for the many possible changes in the cultural and political climate in Europe during this period. These sets of control variables make it redundant to control for the standard right-hand side variables measuring the size of countries, such as population and income, and allow only to include bilateral variables that vary over time. We include bilateral indicators for the distance between both countries, indicators for a shared border, an officially joint language, a joint spoken language, common legal institutions, common religion, common currency, the presence of a regional trade agreement as well as indicators if both are members of the EU, the Euro zone, or on the east of the Iron Curtain. All these standard bilateral control variables are taken from the standard source for this type of estimation, and precise definitions are given there (Mayer and Zignago Reference Mayer and Zignago2011). A brief description of these measures is in the Online Appendix A (Beestermöller and Rauch Reference Beestermöller and Rauch2017).
The main variables of interest are the bilateral coefficients on the interaction term (Aus x East)int, dummies indicating if the observed flow is between Austria and a country east of the former Iron Curtain, and Hint, which indicates if both countries were once part of the Austro-Hungarian Monarchy in year t. Since we are only interested in Habsburg trade that crosses the Iron Curtain, we also include a Hinteast variable, which captures all trade east of the Curtain (there is only Austria west of the Curtain in our baseline specification). Intuitively we estimate how the fraction of Austria-East and Habsburg surplus trade evolves over time. We use a comprehensive set of indicators to capture the different types of Habsburg trade. For our main variable we restrict our measure of Habsburg economies to only those which were fully part of the Habsburg Monarchy: Austria, Hungary, and former Czechoslovakia. We argue that this is the safest approach, because including other economies which were only partly in the Empire, such as Italy, may pick up effects not specific to the Habsburg relationship. In the Online Appendix we show robustness to different choices of this Habsburg definition.
If we were to control for attributes of the exporter and importer using GDP per capita and populations our specification would suffer from bias caused by omission of “multilateral resistance” terms (Anderson and van Wincoop Reference Anderson and van Wincoop2003). Multilateral resistance terms are functions of the entire set of φint from equation (1). We adopt the preferred method of the literature, which is to introduce exporter-year and importer-year fixed effects.Footnote 8 This full fixed effects approach absorbs the exporting and importing specific effects (see Egger Reference Egger2000). Exporter- and importer-year fixed effects do not work for unbalanced two-way panels (Baltagi Reference Baltagi1995). If actual bilateral data are not balanced, as is the case in HMR, one should use the least square dummy variable (LSDV) approach. However, this concern is not relevant to our aggregated European data set which is balanced.Footnote 9 We therefore adopt the full fixed effects approach, even though this approach has the disadvantage that we cannot observe the coefficients of some of the right-hand side variables typically used in gravity models.
We also address the issue of missing and zero trade observations. Zero and missing observations may be due to mistakes or reporting thresholds, but bilateral trade can actually be zero. We treat all missing trade observations as zero trade. Our linear-in logs specification of equation (2) removes all observations of zero trade, thus introducing a potential selection bias. In the literature, it has been common to either drop the pairs with zero trade or estimate the model using Xint = 1 for observations with Xint = 0 as the dependent variable (see, e.g., Felbermayr and Kohler Reference Felbermayr and Kohler2006.) In our baseline specification we choose to drop the zero pairs, but also run a robustness check replacing zeros as ones. We also adopt the Poisson Pseudo-Maximum-Likelihood (PPML) estimation technique. A natural step would be to use Tobit which incorporates the zeros, but it assumes log normality and homoskedasticity on the error term, so we prefer PPML. The PPML incorporates zeros and parameters can be estimated consistently with structural gravity as long as the data are consistent, that is, provided the expectation of ε conditional on the covariates equals one (Silva and Tenreyro Reference Silva and Tenreyro2006). The estimation method is consistent in the presence of heteroscedasticity. Thus, it provides a natural way to deal with zero values of the dependent variable. We believe this preferable to other estimators without further information on the heteroskedasticity. However, when large numbers of zeros are handled in this way, it may be severely biased. There are only 53 missing trade observations out of 13,200 observations in our data since we focus on estimating trade among European economies. The majority of missing trade values involve Albania as a trading partner for which trade may indeed be zero or so small that it falls below a minimum reporting threshold.
The estimation equation for the PPML estimator expresses equation (2) as
 ${\rm{X}_{{\mathop{\rm int}} }} = \exp \left( {{\mu _{\rm{it}}} + {\mu _{\rm{nt}}} + \gamma\,{\rm{}D_{{\mathop{\rm int}} }} + {\delta ^{(\rm{Aus}{\rm{ }}\,\rm{x}\,{\rm{ }}\rm{East})}}{{(\rm{Aus}{\rm{ }}\,\rm{x}\,{\rm{ }}\rm{East
})}_{{\mathop{\rm int}} }} + \delta\,{\rm{H}_{{\mathop{\rm int}} }} + {\delta ^{\rm{east}}}\,{\rm{H}_{{\mathop{\rm int}} }}^{\rm{east}}} \right){\rm{u}_{{\mathop{\rm int}} }},$
where uint = exp(εint).
Even though we include all the usual controls, our vector of bilateral variables may remain incomplete, so unobserved linkages end up in the error term. To capture possible omitted variables in εint, we estimate two additional econometric techniques: a lag dependent variable specification and a specification with origin-destination (bilateral or dyad) fixed effects. The lagged dependent variable would absorb unobserved influences on trade that evolve gradually over time. Including a lagged dependent variable biases coefficient estimates in short panel models.Footnote 10 The time series dimension of our panel (T=22) is likely long enough such that biases can be safely considered second-order. Additionally, the lagged dependent variable technique will not deliver consistent estimates if there is a fixed component in the error term that is correlated with the control variables. We thus also run a specification with bilateral fixed effects. We can still obtain estimates of our coefficients of interest as our variation of interest is also varying over time (the Habsburg and Austria-East dummies are interacted by year). The bilateral fixed effects specification identifies the effect of Habsburg membership based on temporal (within-bilateral) variation. In the bilateral fixed effects specification, all time invariant bilateral variables drop out.
To summarize, we estimate the Habsburg and Austria-East coefficients of interest using four different estimation techniques closely following HMR: simple ordinary least square (OLS), PPML, lag dependent variable specification, and bilateral fixed effects (Dyad FE), each with a strong set of fixed effects. Our typical estimation has in excess of 13,000 observations, and is robust to heteroskedasticity. We run these four estimations on the joint set of Habsburg and Austria-East dummies and separately with one set of dummies interacted with year. In the product level regressions we run the same specifications, but restrict the set of products for which we run the regression in various ways. For example, we analyze homogeneous and heterogeneous products separately to compare estimates.
The sources and details related to the construction of our dataset are documented in the Online Appendix A. All data we use and our treatment of them is standard throughout the related literature. Here we just summarize a few decisions that we make. The dataset we use contains all European countries in the years from 1990 until 2011, the first year for which Comtrade data is available for all the countries of Europe after the fall of the Iron Curtain and the last year for which we found a complete set of data when we embarked on this project. We clean Comtrade data using the methodology of Robert Feenstra, Robert Lipsey, Haiyan Deng, et al. (Reference Feenstra, Lipsey and Deng2005). Trade data for the years before 1990 are available from sources other than Comtrade are not used given concerns about the comparability of data. We use data for Europe only as we think that it provides a cleaner sample of countries for our proposed tests than the entire world. The first OLS assumption that the correct model is specified is easier to justify in a sample of more similar countries. We aggregate a few countries to maintain a balanced panel, see details of this in Table 1A in the Online Appendix. For the product regressions we use the well known BACI dataset from CEPII research centre, details described in the Online Appendix A. CEPII provided a BACI version that starts in 1992 for our countries, thus our product level analyses begin only in 1993 throughout.
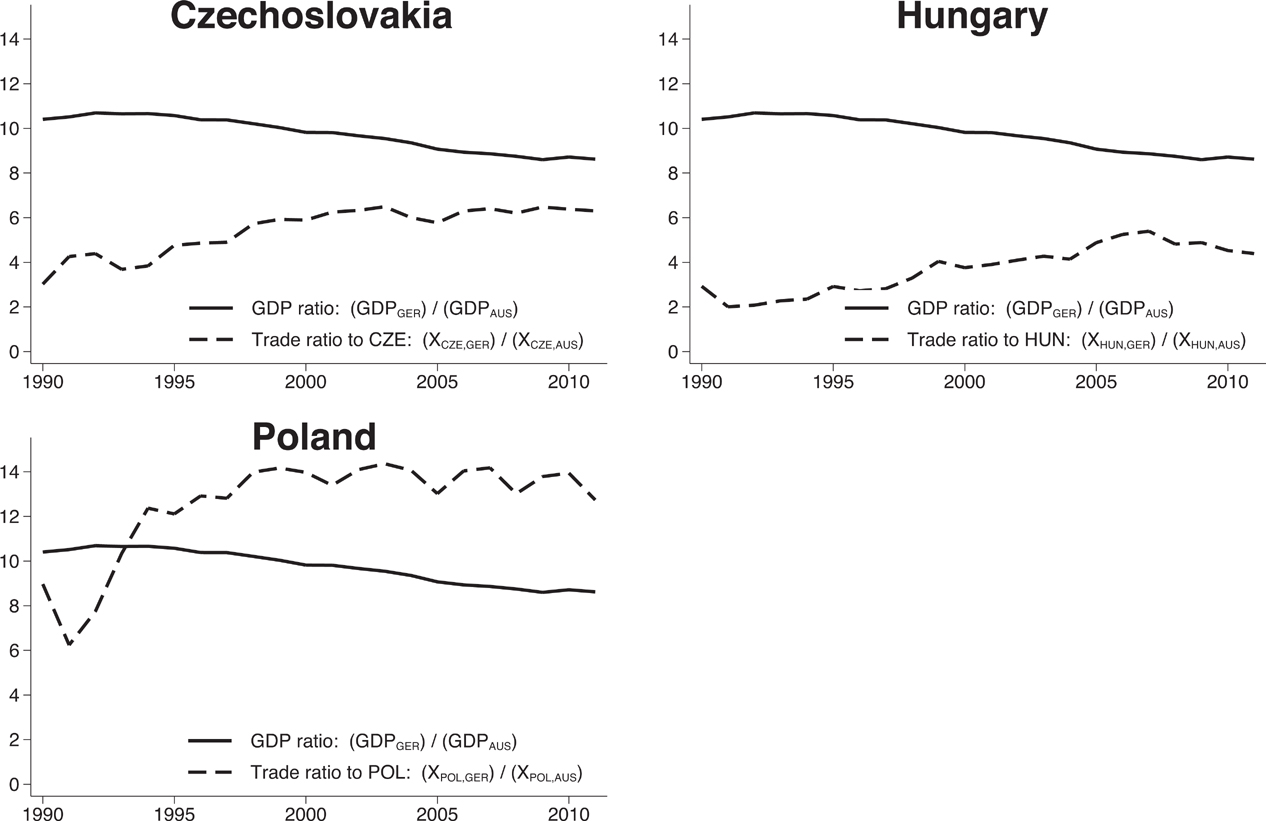
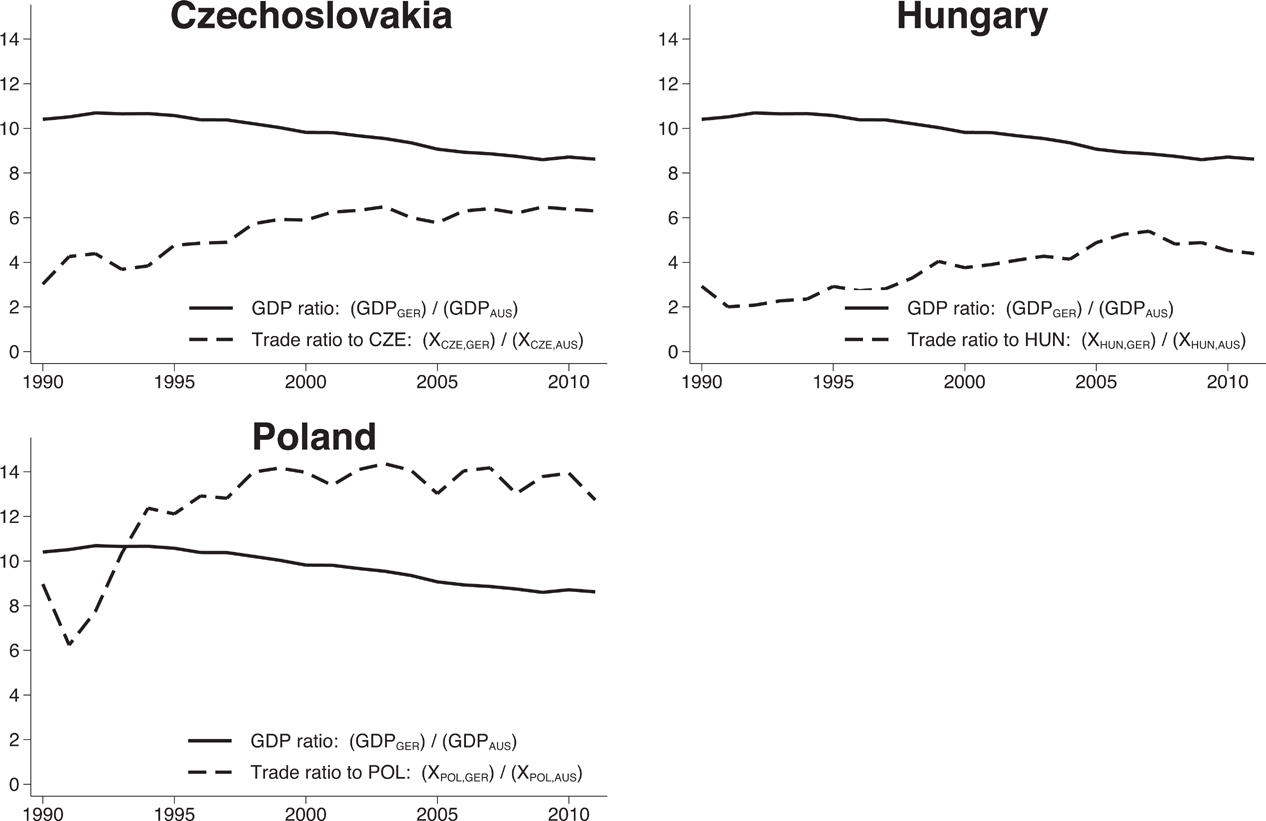
Before turning to the regression results, we present some descriptive statistics which document the Habsburg trading surplus relative to Germany.Footnote 11 Figure 2 considers trade of Germany and Austria with Czechoslovakia, Poland, and Hungary. Czechoslovakia borders on both Germany (both East and West) and Austria, thus differences in distance seem negligible. Moreover, changes in multilateral resistance should also be fairly similar. The solid line shows the ratio of German to Austrian GDP (GDP Gt/GDP At) over this period, which is the same in all three panels. The dashed line in the first panel shows the ratio of German trade with Czechoslovakia to Austrian trade with Czechoslovakia (XGer,Cze,t/XAus,Cze,t). If the Habsburg connection did not matter, we would expect the ratio of trade to mirror the ratio of GDP. However, we observe a large gap. In 1990 the German economy is roughly ten times as large as the Austrian economy. At the end of our sample period this ratio falls to about 8.5. However, trade with Czechoslovakia is three times larger for Germany and this ratio rises to just over 6 over the sample period. We also conduct the same exercise for Hungary and Poland. On the one hand, Hungary—yet another core Habsburg member—displays an even starker gap. The trade ratio rises from approximately 2 to 4.5. These graphs highlight that Austria’s trade with these two eastern countries was highly over-proportional given its size relative to Germany, but that this surplus steadily lowered over time. Even Poland, which we do not regard as a Habsburg member, since only 10 percent of its mass belonged to the Empire, and which does not share a border with Austria, exported less than ten times its Austrian exports to Germany in 1990. All the countries show the central empirical finding in this figure, a strong Austrian trade surplus that weakens over time. We now turn to a more rigorous exploration of these suggested observations.
Descriptive GDP and Trade Ratios for Germany to Austria by Year
Results
We run three sets of regressions. First, we restrict the sample to Habsburg countries. Second, we include Austria-East dummies to investigate surplus trade with all of the East. Third, we control for Austria-East and Habsburg jointly. We find that the effect for Austria-East becomes insignificant once we control for Habsburg. The first of these specifications is most important for our conclusion. We present it in detail and focus on the main elements of the other two.Footnote 12 It is worth emphasizing that we use origin interacted with year fixed effects and destination times year fixed effects separately in all of these regressions. The Habsburg surplus trade coefficients are bilateral and vary annually by construction. Thus, they are not multicollinear with the inclusion of this strong set of control variables and fixed effects.
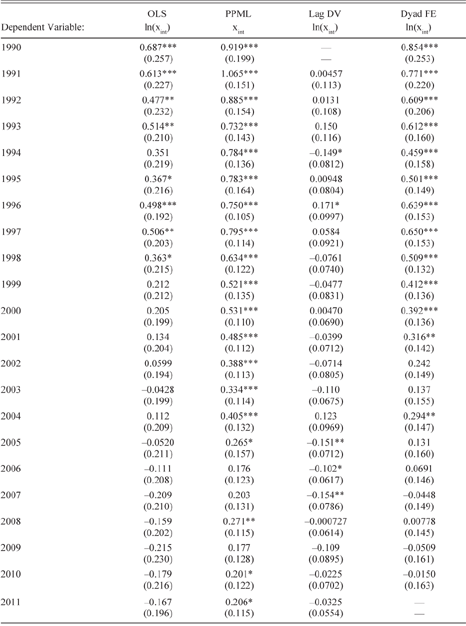
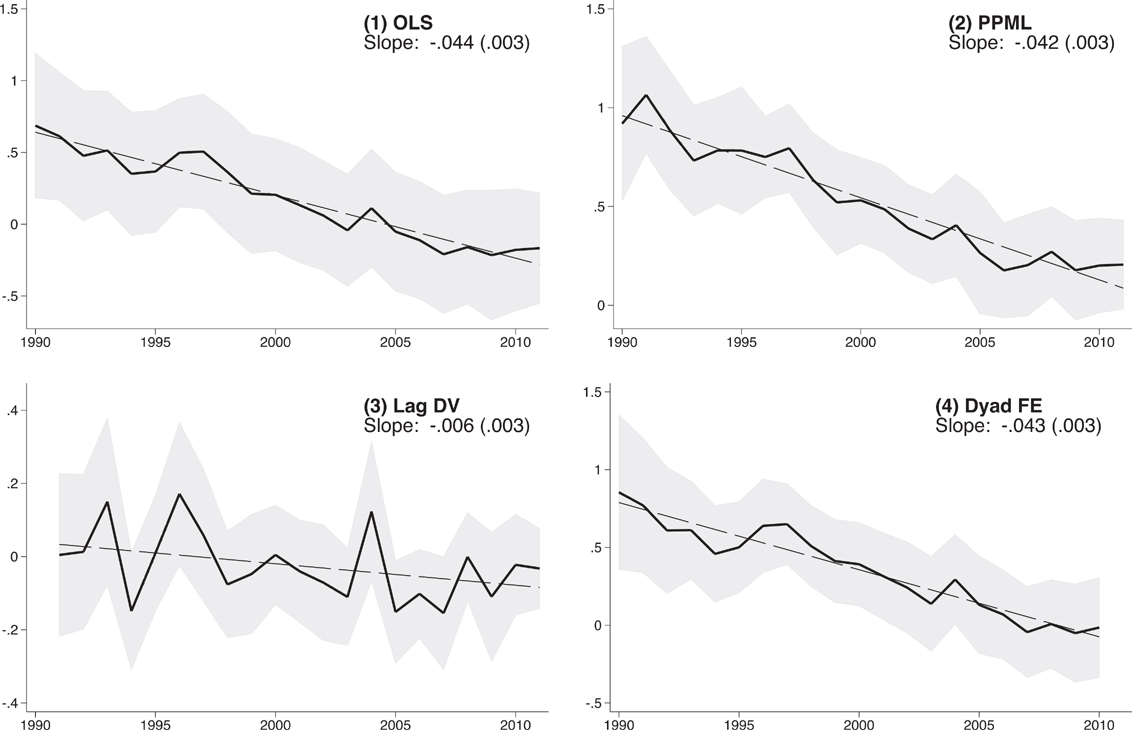
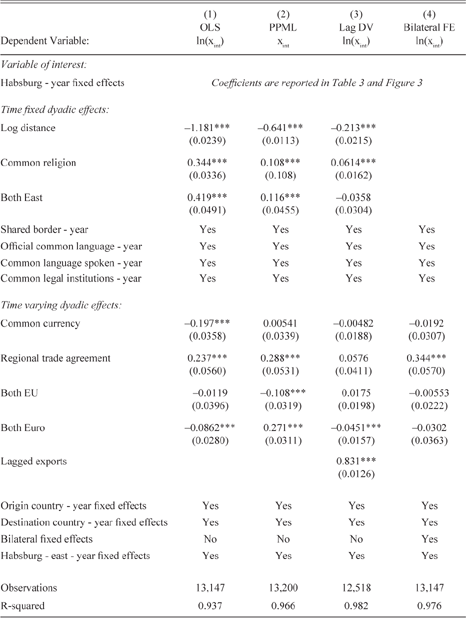
In Table 3 we show the Habsburg x year coefficients, which we interpret to be the surplus trade of Habsburg countries relative to what we would expect if trade followed our gravity model. These coefficients are also depicted in Figure 3. All four estimation methods display a steady decrease of the Habsburg surplus trade over time. We confirm that the first and last estimated coefficients are statistically significantly different to each other.Footnote 13 The downward slope of the trend given in Figure 3 is strongly significant in all of the specifications, and the slope is remarkably similar. It shows a strongly statistically significant, monotonic decline with a slope of around −0.044. Thus the main results, namely that the cultural component of trading capital declines over time, is insensitive to our estimation method. Note that the Habsburg trade bonus is large in the first year after the collapse of the Iron Curtain. For example, in the specification of Column (1) the additional trade in the year 1990 is 0.69, which is about three times as large as the trade bonus from two countries having a regional trade agreement (0.24), two times as large as both countries having the same religion (0.34), and 1.6 times as large as both countries being located in Eastern Europe. This magnitude also corresponds to additional trade by a factor of e0.69, which is close to two. The surplus trade declines steadily and becomes statistically insignificant about ten years after the fall of the Iron Curtain. Note that the coefficients with Habsburg alone show stronger effects, smaller margins of error, and are more precisely estimated than the Austria-East coefficients.
Estimation with Habsburg-Year Fixed Effects Only
Coefficients of Habsburg x year Fixed Effects

* = Significant at the 10 percent level.
** = Significant at the 5 percent level.
*** = Significant at the 1 percent level.
Notes: This table and Table 4 display different coefficients from the same regressions. Columns 1, 2, and 4 provide estimates of equation (2), Column 2 from equation (3). Coefficients are depicted in Figure 3. Robust standard errors used.
Source: Authors’ calculation.
Estimation with Habsburg-year Fixed Effects Only
Notes: Coefficients of the Habsburg by year interaction term Hint in equations (2) and (3) with 95 percent confidence intervals. Restricted sample: includes only countries that were fully part of the Habsburg Monarchy: Austria, Hungary, and former Czechoslovakia. Coefficients of control variables are reported in Table 4. Line of best fit with slope and standard error are also recorded.
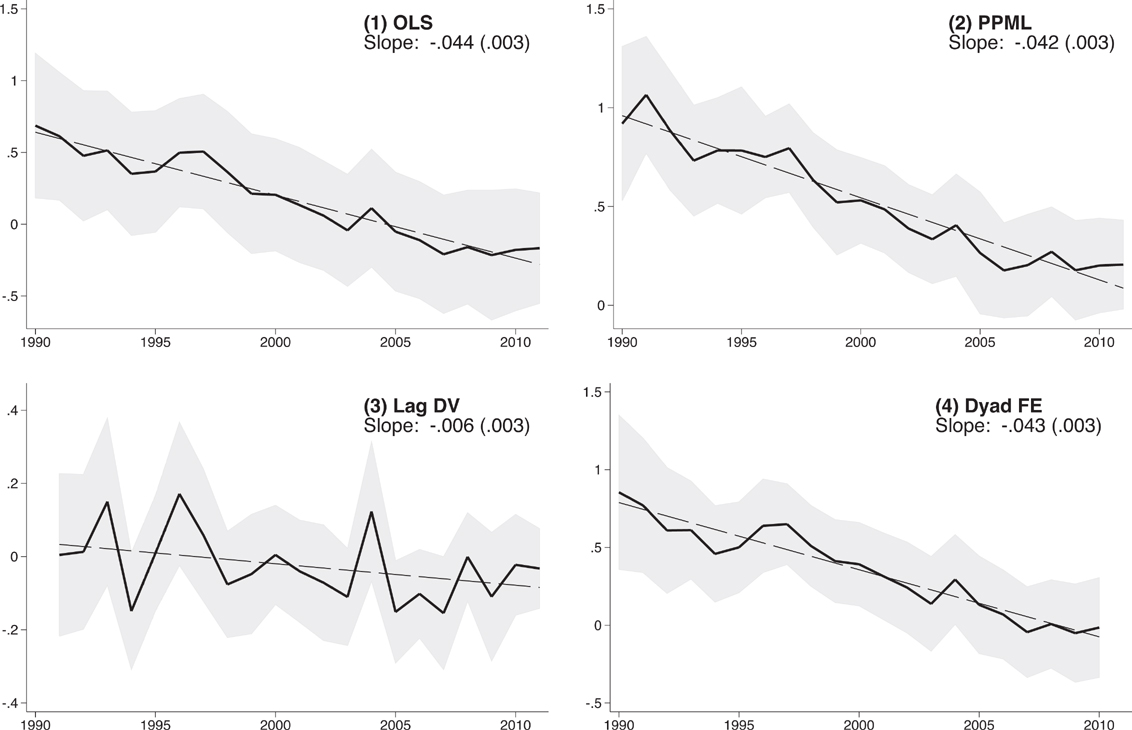
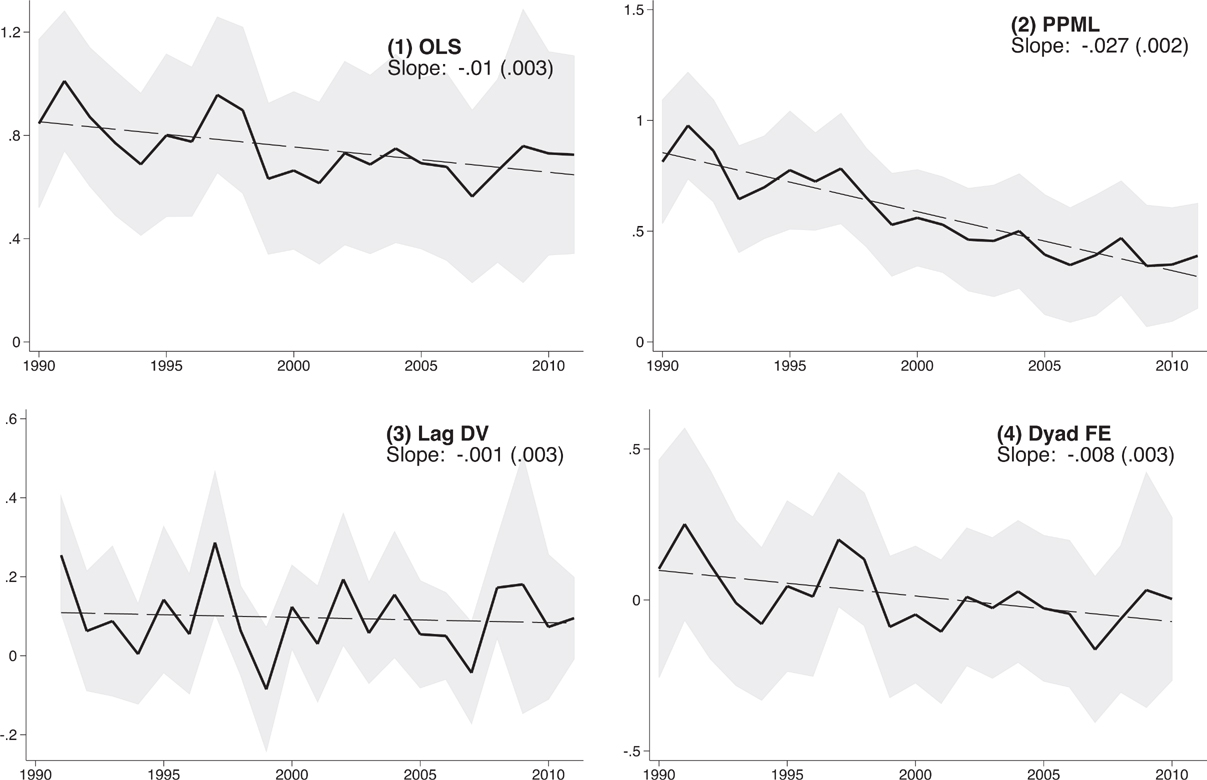
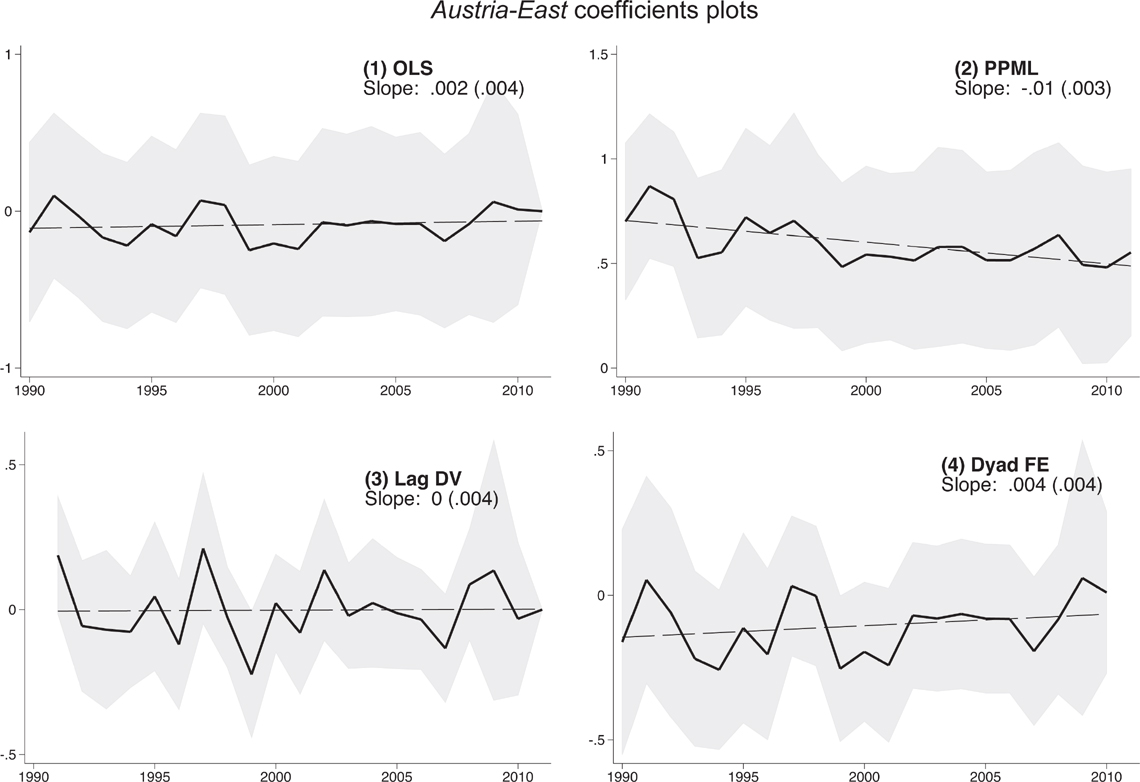
Figure 4 displays the Austria-East by year interaction terms from an estimation with Austria-East coefficients. These results show a statistically significant effect in 1990 which declines linearly and monotonically in both OLS and PPML estimations. The other two techniques show no significant results. Once we add controls for the Habsburg x year coefficients, this trend becomes insignificant in our preferred specification. A weak downward slope remains only in the PPML specification, statistically insignificant from zero, see Figure 5. These graphs suggest that Austria-East does not play a pronounced role once we control for Habsburg membership.
Estimation with Austria-East-year Fixed Effects
Notes: Coefficients of the (Aus x East) x year interaction terms in equations (2) and (3) with 95 percent confidence intervals. Line of best fit with slope and standard error are also recorded.
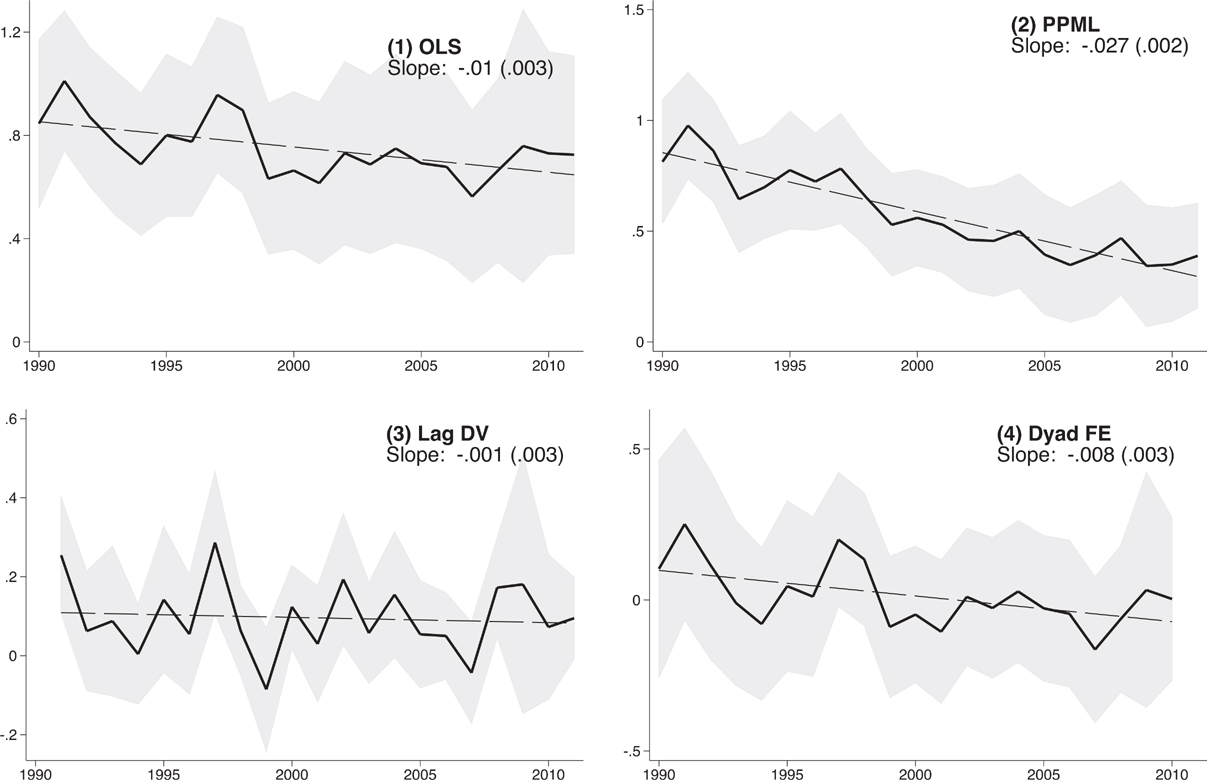
Joint Estimation with Austra-East Dummies and Habsburg-year fixed effects
Notes: Coefficients of the (Aus x East)int interaction term in equations (2) and (3) with 95 percent confidence intervals. Line of best fit with slope and standard error are also recorded.

In Table 4 we proceed to estimate equations (2) and (3) from earlier with only coefficients for Habsburg membership. As expected, distance negatively impacts trade in all specifications where we can include this control variable. The displayed time varying dyadic effects tend to show the expected sign, but coefficients vary across specifications. The latter is expected, as these specifications differ in many respects, for example, the PPML code is written to be estimated using levels rather than natural logarithms on the left-hand side variable. Silva and Tenreyro (Reference Silva and Tenreyro2006) also find a significantly smaller effect of geographical distance. Some of the coefficients show unexpected signs, such as negative coefficients for common currency and “Both EU.” This might reflect that some wealthy economies such as Norway and Switzerland are not part of EU and Eurozone. The PPML coefficient of distance exactly corresponds to that of HMR.
Estimation with Habsburg-Year Fixed Effects Only
Coefficients of Control Variables

* = Significant at the 10 percent level.
** = Significant at the 5 percent level.
*** = Significant at the 1 percent level.
Notes: This table and Table 3 display different coefficients from the same regressions. Columns 1, 2, and 4 provide estimates of equation (2), Column 2 from equation (3). Table 3 shows the Habsburg x year coefficients. Robust standard errors used.
Source: Authors’ calculation.
One concern might be that the opening of the trade relations between the East and West might be dynamic, increasing or decreasing, in the first years after the opening of the Iron Curtain for reasons other than the decline of historic and cultural ties. For example, the installation or reuse of transport infrastructure might suggest a dynamic trade relationship between an eastern and a western country, or the slow establishment of personal exchange and interaction. In both these examples we would expect an increasing relationship, but there may be others. To mitigate concerns that such effects drive our results we run a placebo exercise in which we estimate “Habsburg” effects on a relationship other than Habsburg, for which we do not expect the same decay of cultural ties. We choose Germany as the placebo country, which shares the language with Austria, and also a direct border with many eastern countries. When we estimate the trading relationship with Germany instead of Austria being the “Habsburg” country west of the curtain, we do not find significant relationships. These results are reported in the Online Appendix B, and in this table we use the same specification as applied in Tables 3 and 4. We also report results for similar placebo exercises using Switzerland, the Netherlands, Belgium-Luxembourg, and Italy as alternative placebo countries, and we find no strong trend for either of these countries, with the exception of a moderate decrease in Italy, which was partly Habsburg. We interpret this finding to cast doubt on the relevance of other dynamic effects shaping initial trade relationships.
In the Online Appendix we demonstrate robustness of these results for different estimation strategies, additional control variables, different choices for the Habsburg definition, aggregation of countries, how to deal with missing and zero data, adding internal trade flows, and different treatment of standard errors. We find generally that this main trend is strongly robust to modifications of this type.
Product Level Results
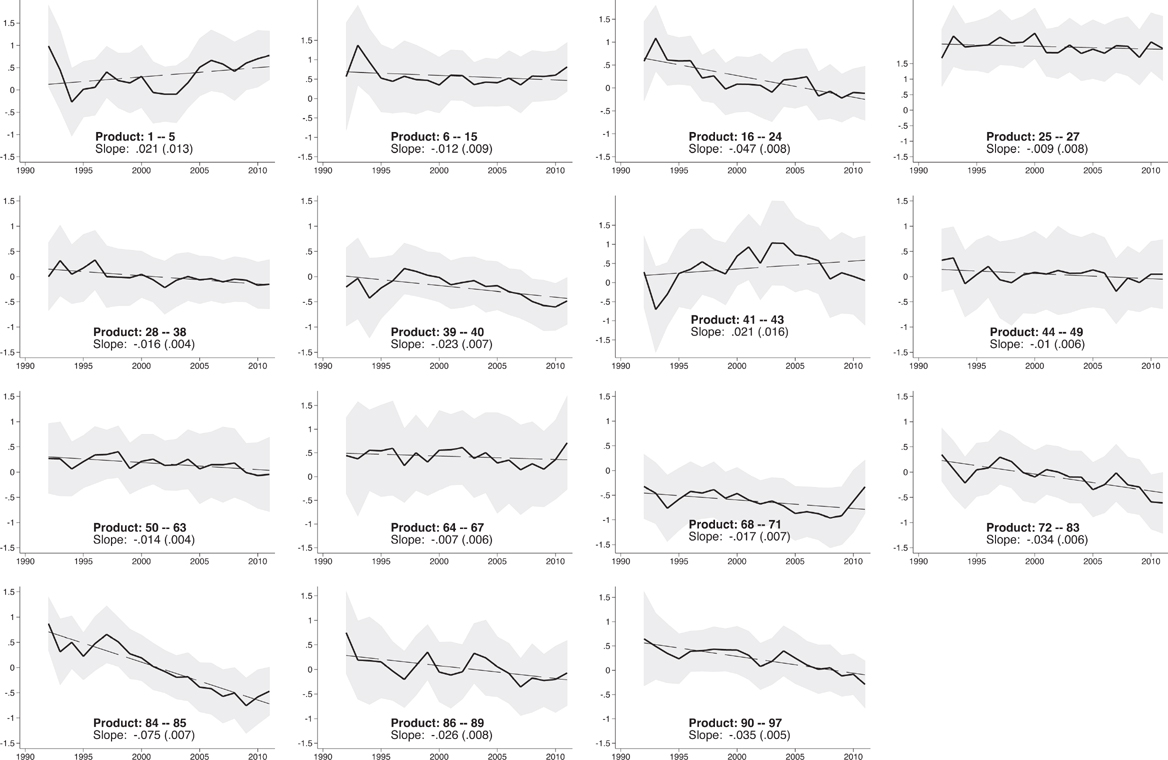
In this section we shed more light on the mechanism driving our main result by studying various product categories separately. In Figure 6 we report the main OLS specification for each of the two-digit HS (harmonized system) product codes except for services for which no BACI data are available. In 13 of the 15 plots the trend is downward sloping, and in 10 the downward trend is significant at the 5 percent level. The graph is upward sloping for animal products and skins and leather, both of which are small industries, accounting for 0.7 and 0.6 percent of all exports in Europe in 2000, respectively. This graph shows that our main results of a strong initial Habsburg surplus that weakens over time is not driven by a few industries, but is observable for most industry groups individually, to a varying degree. The strongest effects in magnitude are found for machinery, foodstuff, and miscellaneous. The general trend within most groups implies that industry composition changes alone cannot account for the observation of the effect.
Estimation at Product Level
Notes: Main specification by HS2 product groups, in increasing numerical score: animal prods (1–5), vegetable prods (6–15), foodstuff (16–24), mineral prods (25–27), chemical industries (28–38), plastics (39–40), skins and leather (41–43), wood prods (44–49), textiles (50–63), footwear (64–67), stone and glass (68–71), metals (72–83), machinery (84–85), transportation (86–89), miscellaneous (90–97).

If our results are driven by an instinct of going back to where things had been before the wars, we might expect some correlation across industries from the Empire to trade in the 1990s. We next run our main regression separately for products traded predominantly in the Empire and other products. Given changing boundaries, and changes in the product space this can only be done on a broad level, and remains an exercise with noise. Scott Eddie (Reference Eddie1989) characterises the Habsburg Monarchy as a marriage of wheat and textiles. David Good (Reference Good1984) lists the main traded items in the Empire from 1884 to 1913 from Hungary as food and beverages, crops, sugar, flourcrops, sugar and flour. From Austria they were industrial raw materials, textiles, machinery, and manufactured products. Following these classifications we classify the industries foodstuff, machinery, and textiles as main industries traded in the Empire. We find that both product classes show a significant, monotonic downward slope, which is not surprising given that we find the downward slope for most individual HS2 product categories. The initial trade bonus for the Habsburg traded goods is almost double that for the others, and the slope in the plot showing the Habsburg traded goods is also 2.8 times larger. The trade surplus becomes insignificant in both cases in the 2000s.
We study the effect by heterogeneous and homogeneous products, following the standard classification by James Rauch (Reference Rauch1999). We merge the classification at the level of HS4, keeping only matched trade flows. These are 15 percent of total trade flows. We think that the Habsburg bonus disappears over time as Europe adjusts to the new trading environment, and converges to the new optimum. This suggests that initial deviations from the optimum, which here happen to coincide with the gravity framework, were not the first best choice. We would expect to find that the Habsburg bonuses are thus stronger for homogeneous goods, for which search costs and the costs of not using the optimum product are smaller, and thus the temptation to follow an intuitive heuristic when buying greater. As can be seen in the top panels of Figure 7A in the Online Appendix, indeed we find the bonus is stronger initially, and falls more rapidly for the homogeneous goods, while there is not such a clear pattern for the differentiated products.
If transport infrastructure surviving from the Empire was an important driver of our findings, we should expect to see a stronger effect for goods easier to transport. To measure this effect we obtain data on unit values from the CEPII TUV dataset.Footnote 14 This dataset gives Free on Board (FoB) unit values per ton for each HS6 product. If, in line with the literature, we assume that the costs to ship a ton of any good are fairly similar, then inverse unit value data can serve as a proxy for transport costs, as the ratio of transport costs per value transported would be smaller. Using this proxy we compare above and below median goods separately, in the bottom two panels of Figure 7A in the Online Appendix. The panel of “costly” goods refers to above median transport cost goods, while “cheap” refers to below median ones. The standard pattern emerges, and the initial surplus trade is similar in both specifications. If there was a difference, it would be that the goods that are harder to transport adjust earlier. An explanation for this earlier drop may be that for these goods the costs of a suboptimal country to import from are higher, so adjustment may be quicker. In any case, this difference is not very strong, and coefficients rest firmly within the confidence intervals of the other graph.
Discussion
We consider a number of possible explanations why the countries of the Empire trade more with each other in the first years after the collapse of the Iron Curtain, and why this initial trade bonus declines over time. First we rule out a number of explanations we consider less likely, before presenting explanations we find more plausible.
Less Plausible Explanations
First, this result might just be a consequence of a miss-specification of the gravity equation. A highly structural approach of the kind we employ is easily prone to introduce noise when looking at specific bilateral trade volumes. If, for example, we overestimate the distance between Austria and the eastern countries, the residuals for these bilateral observations in a standard gravity model would be positive.Footnote 15 Or there might be some natural geographic advantage that facilitates trade between these countries, and this reason might have brought about both the Empire before 1918 and the surplus trade after 1989. Explanations and examples of this type could cast doubt on the existence of a static Habsburg surplus trade. What we observe is a trade bonus that declines linearly and monotonically over time, and it does so robustly across a number of very different estimation methods. This dynamic result is hard to explain as a simple statistical property of miss-specification or measurement error. If it was a purely mechanical specification error, our placebo exercise, that replaces Austria with Germany, would be prone to suffer from the same problem, and show the same downward slope. We verify that our main specification is robust to the use of different measures of distance, such as the distance between the most populated city, and two measures of weighted distances. Our numerous robustness checks which vary estimation strategy, aggregation of countries, and control variables should also help to address this concern.
Second, this surplus trade may stem from better existing transport infrastructure dating back to the times of the Empire. However, most of this infrastructure was unused during the Cold War and by 1989 was derelict. The main rail lines connecting Austria with the East were abandoned; for example, in 1945 the track connecting Bratislava and Vienna, the Pressburger Bahn, the rail to the Czech Republic via Laa an der Thaya and the connection via Fratres-Slavonice were abandoned. All these lines have only just been revived. Transcontinental connections such as Vienna-Hamburg or Vienna-Berlin have switched permanently to run via Passau instead of Prague. There is also evidence that reconstruction and construction of new networks was slow after 1990 in countries east of the border (Erdösi Reference Erdösi and Hajdu1999). Further, even if a derelict rail line provides a strong advantage to trade, we would not expect this surplus to contribute immediately given the time it takes to renovate such a network. Thus we would expect a rise of the Habsburg bonus in the first years, as infrastructure is slowly brought back to full capacity. In the product level section we do not find a big difference between products that are cheap or expensive to transport, which should also address this concern.
Third, this trade bonus might just reflect the specific history of bilateral developments after 1989 that are unconnected to prior history. Austria might have had a starting advantage, after all it was between Austria and Hungary that the Iron Curtain first opened. While it is true that the Iron Curtain was symbolically opened first between Austria and Hungary, things moved rapidly after that. The first symbolic opening on 19 August 1989 was less than three months before the opening of borders within Germany on 9 November. The first time Germans could flee was on 10 and 11 September. Most of the people who fled in the two months before the broader opening were East Germans. Thus, the head start was neither long, nor specifically beneficial to the Austrian economy.
Fourth, it may be that language barriers have initially favored trade from Austria to the East, given that a higher fraction of citizens in the eastern countries still speak German than in other European countries. This explanation is similar to the interpretation we favour, however, the placebo exercise using Germany and Switzerland suggest that the German language cannot explain this surplus trade, and in fact does not seem to contribute to its decline.
Fifth, political factors such as Austria’s neutrality may have helped to win the trust of eastern trading partners. This, however, should predict a general increase in trade for Austria with all eastern countries, rather than the selected members of the former Empire, and would be absorbed by the interactions of Austria with all of Eastern Europe that we include. Further, we would not expect this or similar effects to decline over time as Austria’s political neutrality persists.Footnote 16 The placebo exercise using neutral Switzerland may also help to address this concern. As Felix Butschek (Reference Butschek2012) notes, the Austrian government contributed little to build friendly relationships with its eastern neighbors in the first years after 1990.
More Plausible Explanations
Butschek’s economic history of Austria (2012) discusses the relationship between Austria and the former Habsburg countries in the East in the twentieth century. He describes the trade patterns studied in this article: strong economic ties during the Empire, the strong trade links in the interwar period, drastic stagnation of trade in the period of the Iron Curtain, a trade boom in the 1990s. He names Austria the greatest western beneficiary from the economic expansion towards the East. Butschek explicitly states that historic factors likely explain the trade surplus after 1990. He also notes geographic proximity, and suggests that Austria may have an informational advantage over other western countries. He points out that the trade boom happened without help from the Austrian government, in fact the Austrian government slowed it through aggressive diplomacy towards the East in the 1990s.Footnote 17
Butschek’s (Reference Butschek2012, p. 405) key explanation for the surplus trade is that: “Austrian managers seem to have been more familiar with the situation in the successor states than their colleagues from other countries.”Footnote 18 Here, we translate the original verb “vertraut sein” as “familiar with.” However, its German form offers a wider meaning: “vertrauen” also means “to trust,” and when used as a noun is the German word for “Trust.” In using this verb, Butschek suggests two main positive explanations we share for the surplus trade: trust and information.
First, there is some evidence that cultural proximity of the past leads to greater trust, better communication, and thus lower fixed costs of exporting for Austria. Emile Durkheim (Reference Durkheim and Swain1912) is associated with the idea that memory can be social and inter-generational.Footnote 19 Historic legacy may lead to easier communication, greater trust, more similar preferences, and thus lower trade costs. In Hungary the Habsburg legacy was celebrated during communism, with ample space given to it in the history school books. Also in the West, Solomon Wank (Reference Wank1997, p. 132) describes a consensus view of historians of the 1990s that was nostalgic of Habsburg and run the risk of “distorting historical reality […] by emphasizing the Empire’s positive qualities […].” Furthermore, historians of the time also implied that “some substitute for Austria-Hungary in Central Europe must be created” and “there is a legacy of positive lessons that the Habsburg Empire has bequeathed to Europe.” Maximilian Hartmuth (Reference Hartmuth2011) writes that the Empire was not remembered as a “prison of nations” any longer, but a multicultural empire. Dualism is described as the golden period in Hungarian history. In the 1980s the Austrian Sisi movies, about the life of the Empress, were shown on national Hungarian television, leading to a celebration of her among Hungarian teenagers. Similarly, Emperor Franz Josef enjoys great popularity in Hungary to this day, and did so all throughout communism. An episode that illustrates this celebration of Habsburg was the return of the Holy Crown of Hungary, last worn by a Habsburg, in 1978, as a gift from then President Jimmy Carter. This gift, a reminder of Hungary’s monarchic past, was welcomed so enthusiastically by the Hungarian people that the Communist government went along with it.
Conversely the reputation of the Germans, based on memories of the wars, was less favourable. Witnesses who were engaged with foreign investors in the early 1990s from both sides of the Iron Curtain told us that Austrian investors in the 1990s in the East were seen as culturally closer than German investors. The eastern province of Austria, Burgenland, was handed to Austria from Hungary in the 1920s. This too could have greatly helped communication two generations later. As more quantitative evidence, we observe cultural proximity between the Habsburg countries elsewhere, such as a positive bias in the Eurovision voting behavior.Footnote 20 This type of explanation accounts for the fact that the trade surplus we describe is visible for trade of the former Habsburg countries, and not visible for trade between Austria and other eastern countries.
Second, Austrians may have had better information and better contacts. Centrally planned economies of the East did not turn into free markets immediately, and for quite some time central planners may have greatly influenced business decisions well into the 1990s. While Austrian trade with the East was at low levels, as described earlier, these volumes may have been sufficient to maintain contacts with central decision makers. Austria had a couple of these informational advantages over other western countries. In exchange for Austria’s independence, Moscow received resources. Pogany (Reference Pogany2010) suggests that the smooth and punctual delivery of these goods gave Austria a good reputation as business partner of eastern decision makers. The occupation of the eastern parts of Austria by the Soviets until 1955 gave it direct exposure to eastern structures and decision processes. Following independence, diplomatic and cultural ties were stronger than those of other western countries. Austria was allowed to maintain cultural centres in the East, and cultural and scientific exchanges between Austria and the East were easier. While still at low levels, this may have been enough to generate a significant advantage in 1990.
Cultural and historical memory as well as information advantages may, of course, jointly have influenced trade, and reinforced one another. Austria’s exposure to the planned economies of the East may have contributed to establish trust. Conversely, the joint history may have helped to maintain contacts during the Iron Curtain division and establish new contacts after 1990. Initial trust and communication advantages slowly fade out as the Habsburg countries integrate in the new geopolitical reality during the 1990s. Equal, initial advantages from superior contacts can help to win a head-start in the first years, but will give less and less advantage in the dynamic economy in the medium run. Thus, both explanations can be plausibly reconciled with our empirical finding: With the initial trust and communication advantage disappearing, Europe converged towards the trade quantities predicted by the gravity model and the Habsburg surplus trade disappeared.
Magnitudes
To compare these magnitudes to HMR we conduct a few simple calculations using our estimates. HMR use an OLS specification, which they obtain by exponentiating the surplus trade effect and subtracting one. They find that on average trade remains 31 percent higher after 60 years. Using this same methodology and the numbers provided in their article, this implies that colonial relationships lead to a trade boost of 350 percent in the year of colonial break up. We can use our estimates directly to produce equivalent estimates. Following Column (1) in Table 3 our corresponding numbers are surplus trade of 69 percent in year zero and 21 percent in year 10. We assume for mathematical convenience and sake of simplicity that the decay is linear. This assumption is consistent with the graphs provided by HMR, and by our own Figure 3 and implies a negative slope of 5.3 for the decay of trading capital, and 4.8 for the decay of the cultural part of it.Footnote 21 We can conclude that the decay of the cultural component of trading capital is 10 percent slower than the decay of all trading capital. This comparison does not require us to specify the start year of the decay.
Remarks on the estimated share of the stock of trading capital that is cultural are less precise, as we do not know which year we should use as the equivalent year for colonial break up of the Habsburg Monarchy. The year 1989 did not mark the end of the colonial relationship. In fact, we do not know the end we should use in our example, as we do not know if the heavy involvement of the Soviets in the East sped up cultural memory loss, or froze it compared to a situation in the free market. Our analysis of trade flows before 1990, provided in the Online Appendix does not suggest a decline before 1990. We can estimate the year in which the stock of cultural trading capital is exhausted, which is when the curves in Figure 3 become zero, around 2010. If we assume that the Soviet Union worked as a freezer of cultural capital and count the years 1918–1945 and 1990–2010 as years of decay we end up with an expected boost of 225.6 percent in year zero, compared to 350 percent implied in HMR, which would amount to 65 percent. Assuming that after the Iron Curtain fell people looked to the year before the wars and communism and that the decay was only for 20 years (1990–2010) we estimate the historical and cultural component. It amounts to 27 percent of trading capital, if we normalize the start year such that trading capital and its cultural component become zero at the same point in time, we estimate four-fifths. We include this exercise as a natural comparison, but of course, it is rather crude.
Conclusion
The countries of the former Austro-Hungarian Monarchy trade substantially more after the fall of the Iron Curtain than a standard gravity model would predict. This initial Habsburg surplus trade is large, about four times the effect of a currency union. It deteriorates rapidly, in a monotonic and linear way, and disappears within one or two decades. This effect is specific to the former Habsburg countries, and not found for either trade with Austria and other countries in the East, or Eastern Habsburg countries and trade with Germany, Switzerland, or the Netherlands.
We suggest that the most likely explanation is that the trade advantage comes from a mixture of increased trust, better communication, and better information given the history between Austria and its eastern neighbors, both before the wars and during isolation. Recently Head and Mayer (Reference Head and Mayer2013) write that a legacy of historical isolation and conflict forged a world economy in which neither tastes nor information are homogeneously distributed. Cultural difference and inadequate information manifest themselves at national borders, causing harm to trade. In this article we document and measure the great benefit of better information and cultural proximity for trade. We also measure the speed of convergence of countries that did not have these starting advantages. Thus, this article informs both the static and dynamic benefits of good relationships on trade.