


1. Introduction
There is a resolution gap between structures for reproducible and non-reproducible objects. Radiation damage limits the resolution in all imaging experiments (Blake & Phillips, Reference Blake and Phillips1962; Hendrickson, Reference Hendrickson1976; Solem & Baldwin, Reference Solem and Baldwin1982; Henderson, Reference Henderson1995; Neutze et al. Reference Neutze, Wouts, van der Spoel, Weckert and Hajdu2000). Damage is caused by energy deposited into the sample during exposure. Cooling can slow down sample deterioration, but it cannot eliminate damage-induced sample movement during conventional measurements (Henderson, Reference Henderson1990; Nave, Reference Nave1995). Ultrashort and extremely bright coherent X-ray pulses from X-ray lasers offer the possibility to outrun key damage processes and obtain high-resolution diffraction data from the sample before it explodes and turns into plasma. Simulations based on molecular dynamics (Neutze et al. Reference Neutze, Wouts, van der Spoel, Weckert and Hajdu2000; Jurek et al. Reference Jurek, Faigel and Tegze2004a, Reference Jurek, Oszlányi and Faigelb), hydrodynamic plasma models (Hau-Riege et al. Reference Hau-Riege, London and Szoke2004), and particle plasma models (Bergh et al. Reference Bergh, Tîmneanu and van der Spoel2004; Timneanu et al. Reference Timneanu, Caleman, Hajdu and van der Spoel2004) agree with each other and predict that with a very short and very intense coherent X-ray pulse, a single diffraction pattern may be recorded from a large macromolecule, a virus, or a cell without the need for crystalline periodicity in the sample. A 3D data set could be assembled from such patterns when copies of a reproducible sample are exposed to the beam one by one in random orientations (Huldt et al. Reference Huldt, Szoke and Hajdu2003; Hau-Riege et al. Reference Hau-Riege, London, Huldt and Chapman2005; Bortel & Faigel, Reference Bortel and Faigel2007), and damage can be distributed over many copies of the sample in a somewhat similar manner as in crystallography. Resolution can be further enhanced by signal averaging (Frank, Reference Frank1995; van Heel et al. Reference van Heel, Gowan, Matadeen, Orlova, Finn, Pape, Cohan, Stark, Schmidt, Schatz and Patwardhan2000; Huldt et al. Reference Huldt, Szoke and Hajdu2003; Hau-Riege et al. Reference Hau-Riege, London, Huldt and Chapman2005; Bortel & Faigel, Reference Bortel and Faigel2007). The oversampled diffraction pattern permits phase retrieval and hence structure determination (Bernal et al. Reference Bernal, Fankuchen and Perutz1938; Shannon, Reference Shannon1949; Bragg & Perutz, Reference Bragg and Perutz1952; Sayre, Reference Sayre1952; Miao et al. Reference Miao, Sayre and Chapman1998; Chapman et al. Reference Chapman, Barty, Marchesini, Noj, Cui, Howells, Rosen, He, Spence, Weierstall, Beetz, Jacobsen and Shapiro2006a, Reference Chapman, Barty, Bogan, Boutet, Frank, Hau-Riege, Marchesini, Woods, Bajt, London, Plönjes, Kuhlmann, Treusch, Düsterer, Tschentscher, Schneider, Spiller, Möller, Bostedt, Hoener, Shapiro, Hodgson, van der Spoel, Burmeister, Bergh, Caleman, Huldt, Seibert, Maia, Lee, Szoke, Tîmneanu and Hajdub).
In case of non-reproducible objects (e.g. cells), there is no chance to enhance the signal by averaging, and as a consequence, the maximum resolution is very strongly coupled to damage. Experimental strategies are, therefore, different for high-resolution studies on reproducible and non-reproducible objects and will influence the choice of wavelength and pulse parameters in flash diffraction experiments.
The principle behind flash diffraction imaging has been verified (Chapman et al. Reference Chapman, Barty, Marchesini, Noj, Cui, Howells, Rosen, He, Spence, Weierstall, Beetz, Jacobsen and Shapiro2006a), using intense photon pulses from the first soft X-ray free-electron laser (FEL; the FLASH facility in Hamburg; Ayvazyan et al. Reference Ayvazyan, Baboi and Bhr2006). The results show that a high-quality diffraction pattern can indeed be obtained before the sample turns into a plasma when exposed to a very intense (1014 W cm−2) and very short (25 fs) photon pulse at 32-nm wavelength. Resolution in the experiment was limited primarily by the rather long wavelength. The absorbed energy density was approximately 20 eV atom−1, and the material reached a temperature of about 60 000 K before vaporizing. Significantly, the image obtained by phase retrieval and inversion of the diffraction pattern showed no sign of damage, and the object could be reconstructed to the diffraction-limited resolution of the detector (numerical aperture=0·25). Damage occurred only after the pulse traversed the sample. These results provide the first experimental data in this new field and are in agreement with predictions. Subsequent time-resolved structural studies by femtosecond time-delay X-ray holography confirm that sample explosion occurs picoseconds after the femtosecond X-ray pulse traversed the sample (Chapman et al. Reference Chapman, Hau-Riege, Bogan, Bajt, Barty, Boutet, Marchesini, Frank, Woods, Benner, London, Rohner, Szöke, Spiller, Müller, Bostedt, Shapiro, Plönjes, Kuhlmann, Hodgson, Burmeister, Bergh, Caleman, Huldt, Seibert and Hajdu2007). This, again, is in line with expectations.
The choice of wavelengths for soft X-ray holography on biological samples in an aqueous environment was investigated by Solem & Baldwin (Reference Solem and Baldwin1982) and by London et al. (Reference London, Rosen and Trebes1989). Solem & Baldwin (Reference Solem and Baldwin1982) proposed to use 3-nm radiation inside the water window (2·33–4·37 nm), and this was based on calculations, using cold cross sections. London et al. (Reference London, Rosen and Trebes1989) calculated optical constants from cold cross sections and concluded that the optimal wavelength for X-ray holography does not necessarily lie in the water window as suggested by Solem & Baldwin (Reference Solem and Baldwin1982). The reason for this is that the contrast in holography depends on scattering, which in turn depends on the magnitude of the difference in the complex index of refraction between the sample and its surrounding. The contrast has contributions from both the real and imaginary parts of the refractive indices. For a protein in water, the real part becomes significant at wavelengths just above the long-wavelength end of the water window, whereas the imaginary part is significant at wavelength on the other side of this edge. Based on these considerations, London et al. (Reference London, Rosen and Trebes1989) suggest that a wavelength slightly longer than the long end of the water window (i.e. >4·37 nm) is a reasonable compromise between scattering strength and penetration depth. Both groups suggest to use photon pulses of picosecond–nanosecond duration for reaching 15–30 nm resolutions.
The present paper goes beyond these early investigations and surveys general conditions for obtaining high-resolution structures for living cells in ultrafast diffraction experiments with X-rays. The calculations are based on warm cross sections, i.e. we consider changes in the cross sections as the sample is heated and becomes ionized by the pulse. The results indicate that diffraction-limited resolutions (i.e. half the wavelength in full back reflection) can be achieved at 4·8-, 3·2-, and 2·5-nm wavelengths near resonances before the sample is destroyed. In the 1·5- to 0·75-nm wavelength range, subnanometer resolution is possible at fluences of about 1011–1012 photons pulse−1 μm−2. At 0·15-nm wavelength (the shortest wavelength examined here), the fluence requirement for subnanometer resolution is about 100 times higher than at longer wavelengths.
2. Theoretical considerations and modeling
Any sample placed into the focused beam of an FEL will turn into a plasma at some point. The question is when and how. Here, we map out the parameter space (wavelengths, fluence, pulse length) for high-resolution diffractive imaging on living cells with X-rays. We discuss key mechanisms for radiation damage and describe how these are incorporated into the model. The model is based on plasma calculations and fluid-like motions of the sample, supported by earlier time-delay measurements by Chapman et al. (Reference Chapman, Hau-Riege, Bogan, Bajt, Barty, Boutet, Marchesini, Frank, Woods, Benner, London, Rohner, Szöke, Spiller, Müller, Bostedt, Shapiro, Plönjes, Kuhlmann, Hodgson, Burmeister, Bergh, Caleman, Huldt, Seibert and Hajdu2007). We use a population kinetics plasma code called Cretin (Scott & Mayle, Reference Scott and Mayle1994; Scott, Reference Scott2001) with radiation transfer to account for possible deviations from local thermal equilibrium during exposure and follow the ionization and heating of the target sample in the photon pulse as it turns into a warm/hot dense plasma. We follow changes in the cross sections and in the optical properties of the sample during exposure. We also model continuum broadening, describe hydrodynamic expansion, and assess the impact of these processes on the diffraction pattern as recorded on a 2D detector.
2.1 The scattering model of the sample
We assume that at low resolutions, a cell can be described by discrete regions with different average atomic compositions (Fig. 1). On such a mesoscopic scale, diffractive imaging relies on variations in the complex refractive index leading to contrast in the reconstruction (London et al. Reference London, Rosen and Trebes1989). At high resolutions, individual atomic scattering factors will be needed to describe scattering, and we will switch over to using these scattering factors later in the paper. But at low resolutions, the structure could be thought of as a 3D structure map that describes the real part of the refractive index of the different regions and another one that describes the complex absorptive part. We follow London et al. (Reference London, Rosen and Trebes1989) by assuming simple spherical regions in the low-resolution models.
Schematic model of a cell. Cell organelles, macromolecules, and other cell components can be represented as discrete regions of distinct chemical compositions and densities. The contrast between these regions and their environment can be characterized by wavelength-dependent refractive indices [n 1(λ) and n 2(λ)]. Movement of these regions relative to each other during exposure will weaken the coherently scattered signal and limit resolution.

Four light elements dominate the composition of a living cell: hydrogen, carbon, oxygen, and nitrogen. The next group of elements is present in much smaller quantities and includes P, S, Na, K, Cl, Ca, and Mg. The density and overall elementary composition of a volume element in a cell depends on the concentration and chemical composition of the components (proteins, nucleic acids, lipids, polysaccharides, water, small molecules, and salts), and these vary over different cellular organelles or compartments. We follow Zamyatnin (Reference Zamyatnin1984), Watson (Reference Watson1987), and Thibault et al. (Reference Thibault, Elser, Jacobsen, Sayre and Shapiro2006) to describe the elementary composition and specific density of major cellular constituents: H86C52N13O15S (1·35 g=cm3) for proteins; H11C10N4O6P (1·70 g=cm3) for nucleic acids; H69C36O6P (1 g=cm3) for phospholipids/lipids, where we assume 75% phospholipids and 25% fatty acid by weight; and H23C3NO10S (1 g=cm3) for the average composition of a wet living cell (70% overall water content).
Figure 1 shows a simplified two-component model of a cell, consisting of a region characterized by refractive index n 1(λ) and a smaller region characterized by refractive index n 2(λ), where λ is the wavelength. The index of refraction is related to the scattering factors of the constituent atoms by
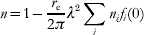
where r e is the classical electron radius, λ is the wavelength, n i is the number of atoms of type i per unit volume, and f i(0) is the complex atomic scattering factor in the forward direction for atom type i. f(0) has two components:

The imaginary part of the scattering factor can be derived from the photoabsorption cross section, and the real part is related to the imaginary part by the Kramers–Kronig dispersion relation (see, e.g. Henke et al. Reference Henke, Gullikson and Davis1993). Figure 2 shows X-ray cross sections for a wet cell with an average composition of H23C3NO10S (70% water content). Photoabsorption is the major source for radiation damage, and the ratio of the photoelectric (red), coherent (blue), and incoherent (magenta) scattering cross sections is decisive for the quality of the recorded diffraction pattern. The size of the smallest region that can be resolved in a diffraction experiment is determined by the wavelength, the scattering strength at this wavelength, and the radiation-induced changes in the sample during data collection. Extensive ionization and heating by a very intense photon pulse will alter the cross sections, and a model based on cold cross sections will no longer be applicable (discussed later).
Cold X-ray cross sections for a wet cell with an average composition of H23C3NO10S, corresponding to 70% water content. During ionization and plasma formation, the cross sections of the sample will change. Red curve: photoionization, dashed blue: coherent scattering, dotted magenta: incoherent scattering. Atomic scattering factors used for calculating these curves were taken from Cullen et al. (Reference Cullen, Perkins and Rathkopf1990). Resonant structures in the photoabsorption curve will change during exposure to an intense X-ray pulse. The wavelength range of 2·33–4·37 nm marks the water window. This wavelength range is preferred in conventional X-ray microscopy.

2.2 Required X-ray fluence
The diffraction signal from a large object can be divided into three main regions as a function of the scattering vector (Fig. 3). The lowest resolutions part (region 1) depends on the overall shape of the object, the medium resolution part (region 2) depends on the distribution of groups of atoms within the object, and the highest-resolution part (region 3) depends on the number and distribution of all atoms.
Orientationally averaged and normalized diffraction patterns. The diffraction pattern represented by the black curve was calculated from Rubisco (1gk8), which is an approximately spherical molecule with a diameter of 12 nm. The scattered intensity is normalized by the number of atoms and the square of the average scattering factor. The red curve shows the diffraction pattern of an equivalent ball with uniform density. The blue line gives the incoherent sum of scattering from all atoms in Rubisco (normalized to unity).

The black curve in Fig. 3 shows the overall distribution of the scattered radiation for a large and nearly spherical macromolecule (Rubisco, 1gk8). The red curve of the figure represents scattered radiation for an equivalent ball of uniform density (no atomicity). The envelope of the scattered intensity from such a ball of uniform density falls off with 1/d 4, where d is the resolution length (see, e.g., Starodub et al. Reference Starodub, Rez, Hembree, Howells, Shapiro, Chapman, Fromme, Schmidt, Weierstall, Doak and Spence2008). The real case (black curve) deviates from the hypothetical ball (red) at medium and high resolutions, where the scattered intensity can be better approximated by a 1/d 3 dependency as done by Shen et al. (Reference Shen, Bazarov and Thibault2004). Finally, region 3 gives a more or less flat dependency on d at high resolutions, and this can be modeled by Wilson statistics.
One may try to assess resolution in real space by estimating how many incident photons are needed to obtain a given number of photons per voxel in a reconstruction (Howells et al. Reference Howells, Beetz, Chapman, Cui, Holton, Jacobsen, Kirz, Lima, Marchesini, Miao, Sayre, Shapiro and Spence2005). This is not practical here. Such an approach considers noise in real space (the reconstruction) rather than noise in reciprocal space (the measurement). Data quality needs to be assessed in reciprocal space for the studies reported here. The shot noise in a diffraction pattern follows Poisson distribution, and because of this, the noise is not additive. Shot noise cannot be estimated directly from a real space voxel. Ionization, heating, and sample explosion will change the intensity distribution in the diffraction pattern and affect the statistics of the measurements. In addition, noise in the diffraction data will also affect phasing, and so the expected changes to the diffraction pattern will have to be assessed directly in reciprocal space.
In the studies below, we follow the derivation of Shen et al. (Reference Shen, Bazarov and Thibault2004) (see also Fig. 3) for estimating incident X-ray fluence I 0Δ required to attain an average of at least five photons per pixel in the outermost resolution shell of the diffraction pattern,
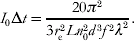
In this equation, r e is the classical electron radius, L is the thickness of the sample, n 0 is the atom number density, d is the highest resolution, f is the scattering factor of an average atom in the region, and λ is the wavelength. The apparent difference in units on the right hand side comes from the differential cross section, which has units of photons/steradian but is expressed in terms of the radius of the volume element and the scattering vector for which it is evaluated.
The power law for the required fluence shows a d −3 dependence here rather than the d −4 dependence that would apply to a sample with perfectly uniform and continuous density (red curve of Fig. 3, see also Starodub et al. Reference Starodub, Rez, Hembree, Howells, Shapiro, Chapman, Fromme, Schmidt, Weierstall, Doak and Spence2008). Equation (3) gives a reasonable approximation in the resolution interval where internal structure of the sample can be resolved, but where the diffraction pattern does not yet have the more flat d-dependence characteristic of near-atomic resolution.
Note that the coherent scattering cross section in Fig. 2 shows almost a flat dependence on wavelength but the required fluence in Eq. (3) has a λ−2 dependence. This comes from the requirement for an oversampled diffraction pattern, leading to a λ−2 dependence of the maximum acceptable solid angle of a detector pixel (Shannon, Reference Shannon1949; Sayre, Reference Sayre1952; Shen et al. Reference Shen, Bazarov and Thibault2004).
Results from this derivation will be modulated by radiation-induced sample movements during exposure.
2.3 Radiation damage
The number of X-ray photons needed to achieve nanometer/subnanometer resolution from a non-crystalline sample is large enough to turn the sample into a dense plasma that will explode within a few picoseconds after the exposure (Neutze et al. Reference Neutze, Wouts, van der Spoel, Weckert and Hajdu2000; Hau-Riege et al. Reference Hau-Riege, London, Huldt and Chapman2005; Chapman et al. Reference Chapman, Hau-Riege, Bogan, Bajt, Barty, Boutet, Marchesini, Frank, Woods, Benner, London, Rohner, Szöke, Spiller, Müller, Bostedt, Shapiro, Plönjes, Kuhlmann, Hodgson, Burmeister, Bergh, Caleman, Huldt, Seibert and Hajdu2007). This motivates us to describe the structural changes in the system based on plasma parameters such as electron and ion temperature and average ionization.
We model photon–material interactions by a multi-dimensional non-local thermodynamic equilibrium (NLTE) plasma code (Scott & Mayle, Reference Scott and Mayle1994; Scott, Reference Scott2001), which also follows radiation transfer. The NLTE treatment is more involved than simple local thermodynamic equilibrium (LTE) methods, but was chosen because of the short timescales and extreme intensities considered. The calculated level populations and transition rates provide opacities and heating rates in each time step of the simulation. Inverse processes such as dielectronic and three-body recombination and Auger decay are obtained from detailed balance relations. We use the screened hydrogenic model with screening constants from More (Reference More1982). The electron energy distribution assumes instant equilibration, and the rates for electron impact ionization are obtained through integration over a Maxwellian electron distribution. To account for the high density of the heated target and the lowering of the continuum edge is modeled through the Stewart–Pyatt formula (Stewart & Pyatt, Reference Stewart and Pyatt1966). This approximation is suitable for the conditions considered here. The effect of removed atomic levels has been analyzed in detail, and the results compare favorably with more detailed models and with experimental emission spectra (Nantel et al. Reference Nantel, Ma, Gu, Coté, Itatani and Umstadter1998).
Based on the Keldysh parameter, we note that for all relevant wavelengths and intensities considered here, the ponderomotive energy is smaller than the ionization potential of the bound electrons in the plasma. This is because of the high frequency of the X-ray field and implies that field ionization is negligible. At intensities relevant here, multi-photon ionization is the only non-linear process that may occur during exposure. However, simulations in the regime of interest for below threshold ionization using weak-field scalings from Delone & Krainov (Reference Delone and Krainov2000) indicate that multi-photon ionization will only have a small effect on the overall ionization dynamics in the sample under the conditions considered here.
Collective motion of electrons and ions
Motion in the sample resulting from the collective behavior of the electrons and the ions is treated within the two-fluid hydrodynamic framework. We consider the time-dependent ion sound speed

as an upper limit for the collective motions in an adiabatic system. Z(t) is the average ionization over isoelectronic sequence and atomic species as a function of time, T e(t) is the electron temperature as a function of time, k B is the Boltzmann constant, and M i is the average ion mass over atomic species. This formulation assumes homogeneous heating with scalar pressure and a close to spherical sample like a small living cell.
The hydrodynamic description of the collective motion is motivated by the quasi-neutrality of the sample. Photoabsorption releases a large number of photoelectrons in the sample during the exposure, and these will have energies, depending on the wavelength (we consider values between 0·2 and 8 keV here). The fast electrons may escape from the sample, leading initially to a non-neutral plasma where the explosion dynamics will be driven by a fast Coulomb explosion rather than by the slower hydrodynamic motion driven by electron pressure. Earlier studies (Bergh et al. Reference Bergh, Tîmneanu and van der Spoel2004; Hau-Riege et al. Reference Hau-Riege, London and Szoke2004) indicate that this effect will be smaller at longer wavelengths for a large object, like a micron-sized cell, because the lower-energy photoelectrons will not be able to escape from the interior of the sample. This scenario supports a hydrodynamic description. This is not necessarily true close to the sample surface where a positively charged surface layer will gradually build up during exposure and positive ions will be ejected from the positive surface layer at speeds faster than hydrodynamic expansion. This effect becomes pronounced with harder X-rays and at later stages of an exposure.
Thermal diffusion of atoms and ions
We also consider the thermal diffusion of atoms and ions, which will blur boundaries between regions and hence limit the resolution by reducing contrast. The upper limit for this kind of movement is estimated by integrating the ion temperature over time. We note that in a dense plasma, the ion thermal motion will be dominated by collisions, and the actual displacement will be less than the calculated value.
Ionization
The third mechanism that limits the achievable resolution is ionization of atoms, and the change in the electronic structure that follows. As the atoms in the sample ionize, electrons will be delocalized from the nuclei to form a gas-like distribution. Because of a short Debye length (typically 1 Å), the system will stay quasi-neutral. In the case of hard X-rays, the scattering factor of a region is proportional to the total electron density (bound plus free), and so the total scattered intensity is largely independent of the ionization state. This poses a problem where atomic resolution is attempted, and where the contrast will be dependent on the atomic electron density.
For soft X-rays, the photon energy is similar to the binding energy of the electrons, and scattering is strongly wavelength-dependent. This has the effect that the scattering factor (and contrast) of a region can vary significantly depending on the wavelength. During irradiation, the electronic structures change, and hence the soft X-ray scattering factors will also change. To investigate this, we follow Nilsen & Scofield (Reference Nilsen and Scofield2004) and Hau-Riege et al. (Reference Hau-Riege, London, Chapman and Bergh2007a) to simulate the absorption spectrum of the dense plasma during the pulse. Here again we can calculate the real part of the scattering factor f 1 from the complex part f 2(ε), using the Kramers–Kronig relation
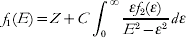
where E is the photon energy, C is a constant. This gives us an estimate of how much f 1 changes in different regions of the sample and at different wavelengths during ionization.
2.4 Motion-induced blurring of the diffraction pattern
The movement of the sample during the pulse will smear out the scattered signal. The instantaneous scattered intensity from a sample with N atoms and a momentum transfer  is given by

where r i(t) gives the position of the atom i and f i(q, t) represents the atomic scattering factor of the respective atom. At this point, we will only model the effect of atomic motion, leaving ionization-induced changes in the scattering factors aside for a moment. The atomic-scattering factors will thus be considered independent of time for the whole duration of the pulse. The relevant observable to follow is the time average intensity for a single shot:

Movement of atoms is described with a certain probability distribution  of finding the atom i displaced from its mean position
 . In this case, the time average of the exponential in Eq. (7) will be given by

where  represents the Fourier transform of the probability density function . In the simple case of an isotropic Gaussian movement of atoms with the standard deviation σ around the mean position
 , one can write the time average intensity as

The exponential factor  is analogous to a Debye–Waller temperature factor (Debye, Reference Debye1914; Waller, Reference Waller1923) accounting for the motion of the atoms during exposure. At high resolution, the second term in Eq. (9) becomes small and the signal approaches the angular average at that resolution, degrading the structural information provided by the intensity fluctuations.
3. Model application
3.1 Attenuation length and sample size
Our aim is to find the most promising spectral regions and pulse parameters for single-shot flash imaging of wet cells. The size of the sample is chosen not to violate the Born approximation, which means that the absorption is low and the phase shift of the incident wave due to dispersion effects is small. To avoid such effects, we choose sample sizes below the curves in Fig. 4. The red curve shows how large the sample can be without exceeding one attenuation length, and the dotted blue curve shows what cell size will produce a phase shift φ equal to π/2 radians. We see that in the soft X-ray regime, the sample size should be below 0·3–1·0 μm, depending on the wavelength. At 1·5-Å wavelength, the sample size could reach abound 10 μm diameter. For this study, we choose a sample size of 0·5 and 1 μm in the soft and hard X-ray regime, respectively.
Attenuation length (red curve) as a function of wavelength (λ) for a wet living cell (H23C3NO10S, water content=70%). The blue curve gives sample sizes where the phase shift, φ, is equal to π/2 radians. Atomic data were taken from Henke et al. (Reference Henke, Gullikson and Davis1993).

3.2 Contrast-based wavelength selection
We use contrast to select suitable wavelengths for low- to medium-resolution studies and then switch to atomic scattering factors in the calculations for high-resolution studies.
The possibility to resolve an object depends on the size of the object relative to the wavelength and on the contrast between the object and its surrounding. Contrast is a function of the scattering factors. The scattering factor for a volume element depends on the atomic composition of the volume element and wavelength. Figure 5 displays |f 1(1)−f 1(2)| as a function of wavelength for three major cell constituents in their surroundings. The green curve shows the contrast between a protein molecule and water, the red between a membrane protein and a lipid bilayer, and the blue curve shows the contrast between a nucleic acid–protein complex and water. The figure demonstrates that the choice of wavelength is crucial to contrast. We consider these curves to be a general and moderate estimate for the achievable contrast in a cell and use them for selecting the wavelength in the following analysis. Note that contrast was calculated from cold cross sections here. These cross sections are expected to change due to ionization during the exposure, and the effect of changing cross sections on contrast will be considered in the next section.
Contrast |f 1(1)−f 1(2)| as a function of wavelength. The figure shows data for a protein molecule surrounded by water (dotted green), a protein–nucleic acid complex in water (dotted blue), and for a membrane protein in a lipid environment (continuous red). Strong signal can be expected in the diffraction pattern at wavelengths where the contrast is high.

Based on Fig. 5, we selected the following wavelengths for detailed studies: 4·8, 3·2, 2·5, 1·5, and 1·0 nm from the soft X-ray regime and 0·75 and 0·15 nm from the hard X-ray regime. These wavelengths provide reasonable contrast and do not lie close to strong absorption edges that could result in strong absorption in the plasma and unpredictable scattering properties (Fig. 6).
Hot cross sections. The figure shows the scattering factor, f 2, for a wet cell as a function of wavelength at different stages during exposure to a 20-fs pulse (top-hat) at 2·5-nm wavelength and 2×10¹⁶ W cm−2 intensity. Ionization during exposure modulates the scattering factors. The black curve shows the simulated cold absorption before exposure. The dotted blue curve shows f 2 at 10 fs into the 20-fs long pulse (electron temperature=34 eV), and the red curve shows f 2 at the end of the pulse (electron temperature=80 eV). Changes in f 2 are most pronounced in the region of the water window. The inset shows a close-up of the 3–5 nm region at electron temperatures of 34 and 80 eV. The chosen wavelengths of 3·2 and 4·8 nm are in this resonant region, but not on the actual line transitions.

Ionization, hot cross sections, and changing contrast
Heating by the intense photon pulse can degrade a diffraction pattern in several ways. The maximum achievable resolution will be modulated by changes in the scattering cross sections and by structural changes due to sample movement during exposure.
We first consider changes in the scattering factors due to ionization. We estimate this effect from Eq. (5), where f 1 can be calculated at the wavelengths under study. The absorptive part of the scattering factor f 2 can be calculated from the atomic population together with the density and temperature of the free electrons. Figure 6 shows the spectral absorption at different electron temperatures of the protein composition.
The black curve shows the cold absorption before the pulse and the blue and the red curves at electron temperatures of 34 and 80 eV, respectively. As the material is heated, the photoionization cross sections decrease and transition lines appear, especially around the K-edge of C, N, and O.
The inset shows a close-up of the 3- to 5-nm region and highlights that significant spectral changes occur in this wavelengths range. The longest wavelengths under consideration are in the proximity of the bound–bound transitions, but well away from the actual lines.
The plots in Fig. 7 show the temporal evolution of f 1 at different wavelengths. The fluence was chosen to match the best possible resolution based on the scattering factors. At 1·5-, 2·5-, and 3·2-nm wavelengths, f 1 is close to constant at all times during the pulse, indicating (quite surprisingly) that the contrast is maintained although both the object of interest and its surrounding medium are heated to tens of electron volts. By analyzing the spectra, we see that the bound-free contribution to the integral in Eq. (5) decreases (see inset in Fig. 7), but this is roughly compensated for by the increase of the bound–bound contribution. Broadening of the natural line width can be expected in a dense plasma, but our approach is not sensitive to the exact line shape, rather to the total oscillator strength of the transition. The free–free contribution (inverse bremsstrahlung) to the absorption is small at these relatively short wavelengths. In the 4·8-nm case, the contrast actually increases due to the decrease in f 1 for protein-rich regions. This is because of the proximity to the carbon K-edge where strong transition lines give negative contribution to f 1.
Changes in the cross section, f 1, for a protein molecule (red curve) and its aqueous surrounding (dotted blue line) in a cell. The scattering factors for the protein and its surrounding were calculated from the absorption spectra generated by the plasma simulations. The calculations cover 10 fs steps over a 100-fs long pulse (top-hat) for four different wavelengths as indicated. Pulse intensities were 1·5×1016 W cm−2, 1·3×1015 W cm−2, 3×10¹⁶ W cm−2, and 1·5×1015 W cm−2, respectively. The results show that contrast is close to constant during the 100-fs long pulse, except for the 4·8-nm case where the scattering factor of the protein decreases relative to that of water.

Predicting the line contribution to the scattering factors in a dense plasma is a complicated problem, and no accurate models exist. We suggest that the change in the spectral opacity during ionization could be utilized to achieve a better contrast by a wise choice of wavelength and fluence. For the wavelengths and fluences considered in this paper, the contrast of the scattering factors does not decrease as the sample is heated. This is an intriguing finding and allows one to simplify the calculations at the wavelengths selected here.
3.3 Ionization, hydrodynamic expansion, and thermal diffusion
Ionization and heating lead to a gradual expansion of the sample. From population kinetics simulations of the interactions, we can follow the ionization dynamics of each atomic species in the chosen composition as well as the electron and ion temperatures of the dense plasma that is created. Figures 8a and 8b show the average ionization by 3·2-nm photons for oxygen, carbon, and nitrogen in a living cell with 70% overall water content (average composition of such a wet cell was taken as H23C3NO10S). The fluence corresponds to a resolution of 5 nm according to Eq. (3), using non-heated scattering factors. The high ionization states in the hard X-ray case (0·5 nm, see Figs 8b and 8d) suggest that the resolution will be lower for single shots in this regime. The average ionization  of C, N, and O is quite similar to each other in the soft X-ray regime where ≈2 during the latter part of the pulse.
(a, b) Ionization of oxygen (red), carbon (dotted blue), and nitrogen (black) in a wet cell during exposure to a 100-fs-long photon pulse. The fluence on the sample corresponds to a resolution of 5 nm according to Eq. (3), resulting in 1010 and 4×10¹¹ photons μm−2 for 3·2 and 0·5 nm, respectively. Ionization is extensive with hard X-rays (b, d), suggesting that the maximal resolution will degrade faster in this regime.

In the plasma formulation, the speed of the collective motion of ions will be limited by the ion sound speed as described by Eq. (4). The red curves, describing hydrodynamic expansion in Figs 8c and 8d, show the total distance that a volume element (located near the surface of the object) can move during a pulse. This can be obtained by integrating Eq. (4) over time. The sample movement is dominated by radial expansion for spherical objects as depicted in Fig. 1. We can also see the effect of using a shorter pulse. For example, in the 0·5-nm case, reducing the pulse length and the fluence by a factor of two would reduce the expansion by 66%. For comparison, a simulation where the pulse is compressed to 50 fs while keeping the energy constant yields a reduction in expansion by 51%. Short pulse duration is beneficial at all wavelengths, and next, we will consider the effect of pulse length on the achievable resolution.
The blue curves in Figs 8c and 8d show the maximal ion thermal displacement as calculated from the evolution of the ion temperature. We conclude that the average displacement of ions is well below the expansion of the sample, since the thermal movement is dominated by ion–ion collisions that will reduce any net displacement larger than the average ion–ion distance. The thermal displacement of ions will cause diffusion of region 2 into region 1 (Fig. 1) and vice versa. For pulse lengths below 200 fs, this effect is much smaller than the expansion, mainly due to the relatively slow coupling between the ions and the electrons.
3.4 Effect of blurring on the diffraction pattern
We use Eq. (3) for the initial estimate of the fluence required for a certain resolution. The motion of the cellular components due to plasma formation will blur the speckle in the diffraction pattern and limit the structural information [Eq. (9)]. As this motion is strongly dependent on X-ray fluence, finding the optimal fluence/resolution pair for a given wavelength becomes a self-consistent problem that can be solved by iteration. Next, we will use these calculations [based on Eqs. (3) and (9)] to assess permissible pulse parameters and expected resolutions in single shot experiments (Fig. 9). The maximum achievable resolution and its respective fluence requirements were chosen such as to provide at least five scattered photons per pixel in the outermost resolution shell, and the signal degradation due to movement was set to 20%.
Expected resolution for a micron-sized living cell as a function of pulse parameters (wavelengths, pulse length, integrated intensity). (a) Achievable resolution as a function of pulse length at different wavelengths. The soft X-ray curves are cut at the diffraction limited resolutions. (b) Number of photons per micrometer square that would be needed in the pulse to achieve a selected resolution in (a).

4. Pulse parameters and expected resolution
Figure 9 summarizes the main findings of this paper, which are based on iterative calculations, using Eqs. (3) and (9) (see Section 3.4). The first soft X-ray free-electron laser, the FLASH facility in Hamburg, has pulse durations in the 5- to 25-fs range today. For pulse lengths >20 fs, our model suggests that the most promising wavelengths for single-shot diffractive imaging of a non-reproducible object are 4·8, 3·2, 2·5, and 1·5 nm. For the sake of clarity, the 4·8-nm curve is omitted from Fig. 9. The best achievable resolution at 4·8-nm wavelength is at the diffraction-limited resolution, i.e. at 2·4 nm for all pulse lengths considered here. This is because absorption is low at 4·8 nm, which results in less energy deposited in the sample, leading to higher stability and slower expansion.
For short pulse lengths, the achievable resolution is at the diffraction limit for 0·75, 1·5, 2·5, 3·2, and 4·8 nm, i.e. limited only by the wavelength, as indicated by the ‘cut’ curves in Fig. 9a. The use of hard X-rays increases the resolution at pulse lengths shorter than about 20 fs. The fluence requirement for the shortest wavelength (0·15 nm) is, however, nearly hundred times higher than that in the soft X-ray regime. This is the case for all pulse lengths considered here.
The intensity required to achieve the resolution presented in Fig. 9a is shown in Fig. 9b, expressed in photons per square micrometer. We see that the intensity needed to achieve a certain resolution increases with shorter wavelengths (0·1–1·0 nm) and with increased resolution (shorter pulse lengths). The increase is not only due to the shorter pulse; the fluence also increases with higher resolution as more photons are required at high scattering angles.
5. Fractal dimensionality: depth information from a flash diffraction experiment
The sample will be destroyed by the intense X-ray pulse. This precludes taking a sequence of shots from the same object from different orientations to obtain a full 3D data set by ultra-fast diffraction methods. One can overcome this limitation with reproducible objects where complete 3D data sets can be obtained by repeating the experiment on a string of fresh objects exposed to the beam one-by-one in different (random) orientations (Neutze et al. Reference Neutze, Wouts, van der Spoel, Weckert and Hajdu2000; Huldt et al. Reference Huldt, Szoke and Hajdu2003; Jurek et al. Reference Jurek, Faigel and Tegze2004a, Reference Jurek, Oszlányi and Faigelb; Hau-Riege et al. Reference Hau-Riege, London, Huldt and Chapman2005; Bortel & Faigel, Reference Bortel and Faigel2007). If information on sample orientation can be obtained (either from the diffraction pattern or by some other means), the result will be a true 3D data set from the many projections. In addition, averaging can be employed to enhance the diffraction signal almost at will and extend resolution far beyond the resolution of a single diffraction pattern (Frank, Reference Frank1995; van Heel et al. Reference van Heel, Gowan, Matadeen, Orlova, Finn, Pape, Cohan, Stark, Schmidt, Schatz and Patwardhan2000; Huldt et al. Reference Huldt, Szoke and Hajdu2003; Bortel & Faigel, Reference Bortel and Faigel2007). Damage can be distributed this way over many copies of a reproducible sample, and this can be used to lift the veil on fine structural detail. The limiting factors here are the accuracy of the orientation information and heterogeneity in the sample population, both of which will blur the reconstructed image.
In case of non-reproducible objects (e.g. cells), there is no chance to enhance the signal to noise ratio by averaging, and as a consequence, the maximum resolution is very strongly coupled to damage. This is an intrinsic feature of imaging from which there seems to be no escape.
Sequential shots on a non-reproducible object can only be taken at very low fluences to avoid excessive sample deterioration. Such sequential shots can give a 3D data set at a very low overall resolution by rotating the sample in the beam.
A high-resolution 3D data set from a non-reproducible object would require simultaneous flash illumination by many pulses from many directions. This could, in principle, assure that significant damage does not develop during data collection. We give below a brief overview of some of the available options to obtain a nearly 3D data set for a single (non-reproducible) object in flash diffraction experiments.
We start here by examining possibilities to extract depth information from a flash diffraction experiment in the far field (Fraunhofer regime) with soft X-rays of 4·8- to 0·75-nm wavelength. Although a true 3D image cannot be obtained from a single diffraction pattern, it has been shown (Spence et al. Reference Spence, Weierstall and Howells2002; Chapman et al. Reference Chapman, Barty, Marchesini, Noj, Cui, Howells, Rosen, He, Spence, Weierstall, Beetz, Jacobsen and Shapiro2006b) that limited depth information can be extracted from a 2D reconstruction by numerical propagation of the reconstructed wave front, provided that certain conditions are met. We show here that this procedure is equivalent to a 3D Fourier transform of the diffracted amplitudes.
Figure 10 shows the schematic arrangement for Fraunhofer diffraction with a simplified sample, consisting of two rectangular prisms of nanometer dimensions and displaced from each other by 100 nm along the beam path. The detector is 100 cm from the sample, and the wavelength is 1 nm.
Depth information from a coherent diffraction pattern with a high numerical aperture. The figure shows Fraunhofer (far-field) diffraction from a rectangular prism (70×15×10 nm) and a square prism (30×30×10 nm) displaced from each other by 100 nm in the direction of the incident beam. The wavelength is 1 nm, and the opening angle subtended by the detector is 2×23·6°, corresponding to a numerical aperture of 0·4. An image can be numerically reconstructed from the pattern by an inverse Fourier transform. Behind the detector, two planar slices of the reconstruction are shown. In one of the slices, the square prism is in focus and the rectangular prism is out of focus; in the other one, the relationship is reversed. The images were obtained from a single pattern by a numerical propagation of the complex-valued wave front. The planes are slices through the 3D Fourier transform of the diffracted amplitudes, and their amplitudes are related by a wave front propagation. Color coding follows electron density: light blue: low, red: high density.

Within the Born approximation and in the far field, an object with scattering density ρ exposed to a planar incident wave will scatter in proportion to  , where F is the Fourier transform of ρ and is the difference between the wavevectors
 and
 of the scattered and incident waves, respectively. With the length of the wavevector defined as the spatial frequency ν of the wave, will be constrained to the Ewald sphere with radius ν and center on
 . If we let (h, k, l) be a set of Cartesian coordinates in Fourier space with the l axis coinciding with , we can write the constraint on as

where q l+ applies to the hemisphere intersecting the origin (corresponding to a scattering angle <90 degrees) and q l− applies to the other hemisphere (corresponding to a scattering angle >90 degrees). Assuming that the phases of the scattered wave can be found, a 3D image  may be computed by an inverse Fourier transform of a function
 , which is equal to F on the Ewald sphere and zero otherwise. Restricting the analysis to the half of the Ewald sphere intersecting the origin (the other half can be treated in a similar manner), we can write the inverse transform as

where the z axis coincides with the incident beam and  is the projection of on the hk plane. The phase factor e2πiφz can be identified as the transfer function of free-space propagation (Goodman, Reference Goodman1996), corresponding to the propagation of a wave front between two planar surfaces separated by a distance z. Transverse cross sections of are thus related by a field propagation and do not contain independent information about the sample. When the object is thin and located in the front focal plane, a real image will form in the back focal plane. Although this does not hold for a thick object, we may decompose such an object into planar sections,
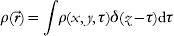
each of which passes through the imaging system independently. Applying the distributive property of the Fourier transform, we can express as

For each planar section  , the integrand represents a 2D image of the object plane ρτ which is out of focus by a distance ρ−τ. The range of object planes simultaneously in focus depends on the depth of focus, which is related to the scattering angle at which the relevant structural information is obtained. Figure 10 illustrates the concept.
The size of the finest detail that can be resolved in a diffraction experiment is proportional to the wavelength divided by the numerical aperture. At X-ray wavelengths and at the scattering angles considered here, a single diffraction pattern contains depth information, and this information can be retrieved from the diffraction pattern by a numerical propagation of the complex-valued wave front. The procedure is equivalent to a 3D Fourier transform of the diffraction amplitudes. This works optimally for micron-sized objects illuminated with soft X-rays. However, at very short wavelengths, the numerical aperture is small. This gives a nearly planar intersection between the object transform and the Ewald sphere, and the resulting diffraction pattern carries no (or minimal) depth information. This is the usual case in electron diffraction studies.
5.1 Laue diffraction with FEL harmonics
Experimental procedures to collect and retrieve depth information about the sample in flash diffraction studies fall into two major categories: manipulating the wavelength and manipulating the angle of illumination.
We consider mixing FEL harmonics with the fundamental emission line of the FEL in an experimental arrangement that could be described as ‘discrete-wavelength Laue diffraction’. At small scattering angles, this geometry improves image quality, but the improvement in depth resolution is small. The reason for this is that the FEL harmonics have shorter wavelengths than the fundamental, and as a consequence, the intersection of the Ewald sphere of the harmonics with the object transform becomes increasingly planar. At the end, it is the FEL fundamental (the longest wavelength radiation in the discrete wavelength spectrum) that carries the most information on sample depth. The additional data from the first, second, and third harmonics sharpen the reconstructed image but do not improve the depth information in a diffraction pattern due to lower numerical apertures.
Conditions are different at very high numerical apertures. Results in Fig. 9 indicate that scattering to the wavelength-dependent resolution limit is possible from a small cell at wavelengths between 4·8 and 1·5 nm. This gives the highest possible numerical aperture and thus carries the most depth information on the sample in a single exposure with a planar incident wave front. Illumination with the FEL fundamental at 4·8 nm and its second and third harmonics would provide extended sampling of the frequency space.
This approach is becoming more realistic today than it has been in the past. Following the first successful use of Laue diffraction to obtain structural information on biological samples (Hajdu et al. Reference Hajdu, Machin, Campbell, Greenhough, Clifton, Zurek, Gover, Johnson and Elder1987), the technique reached certain maturation but failed to become a general tool in X-ray crystallography. Key reasons for this are reviewed by Hajdu & Andersson (Reference Hajdu and Andersson1993). Laue diffraction patterns of crystalline macromolecules have a high polychromatic background with more or less monochromatic peaks. Some of the peaks may also be energy-streaked, and others may contain harmonic overlaps. Problems associated with such a mixture of data could be fully overcome, if the energy distribution of the scattered radiation could be measured with sufficient precision at each point (or pixel) over the entire diffraction pattern. This has not been possible earlier for practical reasons; however, fast area detectors with high spatial and energy resolution are being developed (e.g., Meidinger et al. Reference Meidinger, Andritschke, Hälker, Hartmann, Hasinger, Herrmann, Holl, Kimmel, Pfeffermann, Predehl, Reich, Schächner, Soltau and Strüder2007), giving realistic hopes for high-quality polychromatic diffraction studies in a range of new applications. A full-energy deconvolution of the data (and the background) may thus be possible from energy-resolved measurements. If the area detector has a hole in its center for the direct beam to pass through, then two such detector systems can be arranged in tandem to measure the forward- and the back-scattering signal simultaneously.
5.2 Simultaneous illumination from multiple directions
Orthogonal illumination could be realized with split beam geometry with soft X-ray pulses for which efficient multilayer mirrors exist. The timing of such pulses is a challenge, but not as critical as first thought. Nevertheless, the better the timing, the higher the possible resolution. Recent measurements show that sample explosion is relatively slow (picosecond), following a femtosecond illumination with an ultra bright soft X-ray pulse (Chapman et al. Reference Chapman, Hau-Riege, Bogan, Bajt, Barty, Boutet, Marchesini, Frank, Woods, Benner, London, Rohner, Szöke, Spiller, Müller, Bostedt, Shapiro, Plönjes, Kuhlmann, Hodgson, Burmeister, Bergh, Caleman, Huldt, Seibert and Hajdu2007). These measurements were done with similar pulses to those considered here. We also note that timing of split soft X-ray pulses has been achieved with 10- to 30-fs accuracy, and this could be sufficient in an experiment employing a split-beam geometry. The split pulses will have to intersect with each other and with the sample. This poses technical challenges, but the rewards would be considerable. Figure 11a shows three intersecting diffraction images in an orthogonal beam geometry from the objects shown in Fig. 10. Figure 11b shows the reconstruction of the two objects as a 3D density map. The multiple views result in a significant enhancement of the depth information about the sample. At high diffraction angles, patterns from orthogonal directions will overlap. This creates a hologram through coherent addition and contains phasing information, which could aid in the image reconstruction process.
Orthogonal three-beam illumination gives good 3D reconstruction. The object was simultaneously illuminated from three orthogonal directions. Similar geometries were used for the individual pulses as in Fig. 9. (a) The Ewald construction for intersecting diffraction images in diffraction space from three simultaneous orthogonal laser pulses. (b) 3D electron density map of the reconstructed objects from the diffraction patterns in (a).

5.3 Illumination with a curved wave front
Coherent illumination with a curved wave front has distant similarities to the three-beam geometry discussed here. In a recent paper, Abbey et al. (Reference Abbey, Nugent, Williams, Clark, Peele, Pfeifer, de Jonge and McNulty2008) report on a variant of coherent diffraction imaging that could, in principle, reconstruct objects of arbitrary shape and size in arbitrary environments, e.g. a virus particle within a complex host environment. The method combines the improved resolution of modern X-ray optics with the wavelength-limited resolution of coherent diffraction imaging. This approach exploits the near-field Fresnel regime where the curvature of the incident wave front is created by a zone plate in the illuminating beam. The overall geometry in the experiment is similar to in-line holography, but instead of using only the holographic part of the pattern, the entire pattern can be used to achieve diffraction-limited resolution. The extra information recorded in the in-line hologram in the center of the pattern allows quicker convergence of the phasing algorithm. The phasing method depends on knowing accurately the illumination function (Quiney et al. Reference Quiney, Peele, Cai, Paterson and Nugent2006) and uses this information to define a region of illumination called the support. The field of view may be varied, allowing the user to image a region of the sample at low fluence and then ‘zoom in’ on a smaller region for a flash shot. The phase-curved illumination function ensures the object can be reconstructed quickly (Williams et al. Reference Williams, Quiney, Dhal, Tran, Nugent, Peele, Paterson and de Jonge2006).
For this to happen easily, the authors assume that the curvature does not change through the depth of the object, an assumption that is equivalent to requiring a thin object. This is however not a hard limit, nor is this a limit of a physical nature. It comes from a simplification in image reconstruction, where it is assumed that the maximum phase excursion over the object is less than about one wavelength of phase shift (2π), and so it can be neglected. An analysis with a maximum phase shift of one wavelength over the object gives tolerable thickness values for cells, with dimensions inside the ‘permitted regions’ of Fig. 4. Extension for larger object could be possible, e.g. by defining the incident wave and phase curvature on a sequence of planes through the object.
5.4 Multiplexing as an alternative to focusing
Multiplexing is a term used in information theory to refer to a process where multiple signals are combined into one signal over a shared medium. For example, several phone calls may be transferred using a single wire. In diffraction experiments, the signal from a reference object can be combined with the signal of an unknown object to form a single, holographic diffraction pattern.
X-ray Fourier transform holography is a promising but, so far, inefficient way to obtain structural information on 3D objects. In a recent paper, Marchesini et al. (Reference Marchesini, Boutet, Sakdinawat, Bogan, Bajt, Barty, Chapman, Frank, Hau-Riege, Szoke, Cui, Howells, Shapiro, Spence, Shaevitz, Lee, Hajdu and Seibert2008) have shown that a uniformly redundant array (URA) (Fenimore & Cannon, Reference Fenimore and Cannon1978) placed next to the sample multiplies the efficiency of X-ray Fourier transform holography and provides massively parallel holographic images with both amplitude- and phase-contrast information. The resulting compound image can be computationally reconstructed with no loss of resolution. The maximal spatial resolution is not limited by the nanofabrication/characterization limits of the URA. Image reconstruction at resolutions beyond the nanofabrication limits is possible by combining the URA-based holographic reconstruction with iterative phase-retrieval methods (Marchesini et al. Reference Marchesini, Boutet, Sakdinawat, Bogan, Bajt, Barty, Chapman, Frank, Hau-Riege, Szoke, Cui, Howells, Shapiro, Spence, Shaevitz, Lee, Hajdu and Seibert2008). This avoids the uniqueness problem, guides the iterative reconstruction by assuring a robust and reliable convergence, and extends the spatial resolution in the reconstruction to the diffraction limit for both the object and the URA. This option cannot be applied to lens-based amplitude-only images.
At its simplest, a coded aperture array is a pattern of pinholes on a 2D lattice where the translation vector produces a binary outcome, creating either an open or a closed pinhole at the position of a lattice point. A URA is a particular form of coded array, where each possible vector displacement between pairs of non-equivalent open lattice points (holes) occurs a uniform number of times. The advantage offered by such coded apertures lays in their increased transmission efficiency due to the large open area created by the many holes. The transmission efficiency can be many orders of magnitude larger than that of a single pinhole. URAs combine the high-transmission characteristics of the random array with the flat side lobe advantage of non-redundant pinhole arrays. This has far-reaching consequences and leads to the enhancement of the high-frequency Fourier components in the diffraction pattern. The gain in flux compared to a single pinhole is related to the number of the opaque elements in the URA. The signal-to-noise ratio of the URA-produced image increases initially with the square root of the number of open pixels in the URA.
An additional feature of imaging with multiple pinholes is the possibility of obtaining 3D depth information. By placing an URA between the object and the detector, it could be possible to obtain multiple superimposed pinhole images of the object. The recorded image can then be ‘focused’ on different planes of the object by deconvoluting it with the appropriately scaled version of the URA (Cannon & Fenimore, Reference Cannon and Fenimore1979).
6. Conclusions
The quintessence of crystallography and that of all other structural methods, employing reproducible objects, is damage limitation through damage distribution. Scattered radiation from many copies of a sample can be used to enhance the signal, essentially by processes based on averaging. Damage limitation has to take other forms than damage distribution on objects that are non-reproducible in terms of their atomic positions.
The first successful experiments with FELs prove the principle of flash imaging and indicate that the conventional handicap of X-rays over electrons in imaging can be reversed and made into a net gain on small samples. Ultrafast diffraction methods discussed here provide the highest possible resolution on a single, micron-sized object and produce ‘more-than-2D’ reconstructions, but short of full 3D structures. Linear accelerator-based FELs are available for experiments and produce femtosecond X-ray pulses with a peak brightness more than 10 billion times higher than that of an advanced synchrotron light source (Ayvazyan et al. Reference Ayvazyan, Baboi and Bhr2006). In addition to linear accelerator-based free-electron lasers, tabletop X-ray lasers are also being developed, employing optical laser drivers (Faure et al. Reference Faure, Glinec, Puhkov, Kiselev, Gordienko, Lefebvre, Rousseau, Burgy and Malka2004; Geddes et al. Reference Geddes, van Tilborg, Toth, Esarey, Schroeder, Bruhwiler, Nieter, Cary and Leemans2004; Grüner et al. Reference Grüner, Becker, Schramm, Eichner, Fuchs, Weingartner, Habs, Meyer ter vehn, Geissler, Ferrario, Serafini, van der Geer, Backe, Lauth and Reiche2007).
Any sample placed into a focused pulse of an X-ray laser will turn into a plasma. Flash diffraction imaging combines plasma physics with structural sciences by exploiting photon–material interactions on ultrashort time scales, at extreme pulse intensities, and at very short wavelengths. Such experiments enable us to probe the dense plasma regime and permit models for the optical properties of dense plasmas to be evaluated and refined. These developments can be exploited in imaging. Plasma simulations presented here show the feasibility of imaging unmodified living cells at very high resolutions. Our results indicate that diffraction-limited resolutions can be achieved at 4·8-, 3·2-, and 2·5-nm wavelengths near resonances before the sample is destroyed. In the 1·5- to 0·75-nm wavelength range, subnanometer resolution is possible at fluences of about 1011–1012 photons pulse−1 μm−2. Subnanometer resolution can also be achieved with hard X-rays (0·15 nm) at high fluences.
We draw attention here to the possibility to extend resolution even further, by correcting the diffraction pattern for radiation-induced sample deterioration (Hau-Riege et al. Reference Hau-Riege, London, Chapman, Szoke and Timneanu2007b). The correction is based on an understanding of the explosion process and relies on a statistical analysis of ionization and sample expansion in samples where a hydrodynamic description is appropriate. Computational post-processing of the pulse-averaged diffraction pattern can then be used to correct for radiation-induced image deterioration. This procedure gives significantly enhanced resolution in subsequent image reconstructions (Hau-Riege et al. Reference Hau-Riege, London, Chapman, Szoke and Timneanu2007b).
Acknowledgments
We are grateful to H. Scott (Lawrence Livermore National Laboratory) for his invaluable help with software development for plasma simulations. We thank M. Svenda (Uppsala), A. Szoke (Lawrence Livermore National Laboratory), R. A. London (Lawrence Livermore National Laboratory), and Keith A. Nugent (University of Melbourne) for discussions. This work was supported by the US Department of Energy through the Stanford Linear Accelerator Center by the DFG Cluster of Excellence at the Munich Centre for Advanced Photonics (www.munich-photonics.de) and by the Swedish Research Council through the Centre of Excellence in FEL-Studies at Uppsala University.



