I. INTRODUCTION
Thin films of tin doped indium oxide (ITO) have been subjected to intensive investigation by several workers, mainly because of the varied and versatile applications of these thin films. Reference Zheng and Kwok1–Reference Kumar, Raju and Subrahmanyam27 These ITO thin films are quite complex and the properties are very sensitive to oxygen vacancies. The physical properties, in specific, the optical and electrical properties, of these thin films depend upon: (i) the thickness, (ii) the technique of preparation, and (iii) the growth parameters even in the same technique. With the advent of applications Reference Dobrowolski, Li and Hilfiker6,Reference Kim, Pique, Horowitz, Mattoussi, Murata, Kafafi and Chrisey28–Reference Balestrieri, Pysch, Becker, Hermle, Warta and Glunz33 demanding the preparation (manufacture) of these ITO films at relatively low temperature or preferably at room temperature (300 K) (mainly for the touch panel displays on plastics and top electrode for solar cells and electrochromic devices on flexible plastic substrates), our laboratory has reported the physical properties (including photocatalytic properties) of ITO thin films (as a function of thickness) prepared at room temperature (300 K) by reactive DC magnetron sputtering technique. Reference Kumar, Raju and Subrahmanyam27
The aim of the present communication is mainly (i) to report the optical constants of room temperature (300 K) magnetron sputtered ITO thin films and (ii) to compare the optical constants of these ITO thin films by spectral reflectometry (SR) (fast and cost effective) and spectroscopic ellipsometry (SE) (time consuming, demand expertise for analyses). Characteristic optical properties of thin film structures can be derived from spectroscopic SE measurement, which is known to be a high-precision optical characterization technique. Reference Irene34–Reference Kulik, Zuk, Drozdiel, Pyszniak, Komarov and Rzodkiewicz38 Variable angle spectroscopic ellipsometry (VASE) allows measurements at multiple angles of incidence. A new angle will change the length of the light penetrating through the materials. This can be advantageous in case of multilayers, as different path lengths usually deliver new information about the structure. Multiple angles are helpful to improve the confidence limits of the results yielded by the data evaluation. To the best of available knowledge with the authors, the optical constants of room temperature sputtered ITO are not reported in the literature.
Among the several reports on the optical constants of ITO thin films evaluated by SE, Reference Fukarek and Kersten2–Reference Synowicki4,Reference Losurdo, Giangregorio, Capezzuto, Bruno, DeRosa, Roca, Summonte, Plá and Rizzoli10,Reference El Rhaleb, Benamar, Rami, Roger, Hakam and Ennaoui11,Reference Jung14,Reference Jung16,Reference D'Elia, Scaramuzza, Ciuchi, Versace, Strangi and Bartolino25,Reference Stoica, Gartner, Losurdo, Teodorescu, Blanchin, Stoica and Zaharescu35 the recent work by Jung Reference Jung14 is most comprehensive. Jung investigated ITO thin films prepared under various DC magnetron sputtering conditions Reference Jung14 using VASE. He analyzed the SE data using a model combining Drude and Lorentz oscillator terms. The three-layer optical model consists of a bottom layer just above the substrate (responsible for nucleation), the middle layer and the top layer with surface roughness. Although the technique and the growth parameters used in the present work are similar to those used by Jung, certain conditions are different: (i) in Jung's experiment the target was sintered ITO, in the present case the target was metallic, (ii) Jung applied DC sputtering technique, in the present case reactive DC sputtering was used, (iii) Jung selected single crystalline silicon for substrate, in the present experiment soda lime glass substrates were used, and finally (iv) in Jung's experiment the thickness of the films was about 150 nm, in the present study the thickness values ranged from 165 to 1175 nm.
II. EXPERIMENTAL
All the details of the preparation of ITO thin films are given in Ref. Reference Kumar, Raju and Subrahmanyam27. Briefly, all the ITO thin films were deposited on cleaned soda lime glass substrates (2.5 cm × 2.5 cm) at room temperature (300 K) by reactive DC magnetron sputtering using a commercial sputtering system (ANELVA, model SPC-530H, San Jose, CA). The targets are metallic (In:Sn-90:10) with size: Rectangular (38 cm × 13 cm). The target is powered to 0.2 W/cm2 by a magnetron power supply (M/s Advanced Energy Model: MDX-10 kW, Fort Collins, CO). The flow rates of argon (sputter gas) and oxygen (reactive gas) were controlled through independent mass flow controllers (MKS model-1179A, ASTeX Products, Wilmington, MA) keeping the ratio to 0.21 such that the chamber pressure is maintained at P w = 3 mbar. The average deposition rate is ∼19 nm/min. Before each deposition, the target was presputtered with argon gas for 2 min to remove the surface oxide layer and to ensure the near virgin state of the target.
The ITO films are prepared with different thicknesses: They are labeled as S1–S6, S1 corresponding to a deposition time of 10 min (thickness ts1 = 165 nm) and S6 (ts6 = 1175 nm) corresponding to a deposition time of 60 min. The thickness (t), refractive index (n), and extinction coefficient (k) in the wavelength range 400–800 nm are measured by reflectometry (Filmetrics-F20, San Diego, CA). 39 Ellipsometric measurements have been done using a rotating compensator spectroscopic ellipsometer (Model M-2000DI produced by J.A. Woollam Co., Inc., Lincoln, NE) in the wavelength range of 191–1690 nm with angles of incidence of 55°, 60°, 65°, 70°, and 75°; the measured data are analyzed using WVASE32 software. 40
For the SE measurements, the rear face of the glass substrates was roughened to avoid disturbing reflection. The calculated spectra were fitted to the measured ones using a regression algorithm. The measure of the fit quality is the mean squared error (MSE). The unknown parameters are allowed to vary until the minimum of MSE is reached. To avoid the “local” minimum in the regression algorithm, a careful global search procedure has been applied in case of complex multilayer structures (involving a wide range of initial parameter values).
The optical constants of the substrates (soda lime glass) have been evaluated from SE measurements using a three-phase optical model consisting of the ambient (air), a surface roughness layer and the substrate. The roughness layer was taken into account on the basis of effective medium approximation Reference Irene34,Reference Aspnes41 ; the roughness layer consists of 50% of glass and 50% of void (a most valid assumption). The Cauchy dispersion relation was used to describe the refractive index and the extinction coefficient of the glass. The five parameters of the Cauchy dispersion relation and the thickness of the roughness layer were considered as free variables.
The data analysis (191–1690 nm wavelength range) shows a surface roughness on the glass substrates to be 3.8 ± 0.5 nm. The fitted values of the five parameters of the Cauchy dispersion relation were built into the optical models of the ITO–glass structure.
III. RESULTS AND DISCUSSION
For the sake of clarity, this section is divided into four parts:
First part describes the comparison between reflectometry and SE. Second part analyzes the spectroscopic ellipsometric data using four optical models and detailed analyses have been given including the depth profile. The third part analyzes the SE data following the optical model proposed by Jung. The fourth part of the work presents the optical analysis of sample S1 in the wavelength range 230–1690 nm.
A. Comparison of reflectometry and SE techniques
One of the objectives of our investigation is to evaluate the precision of thickness and refractive index obtained by reflectometry compared to those obtained from the ellipsometric measurements: This objective is addressed in the first part of this section.
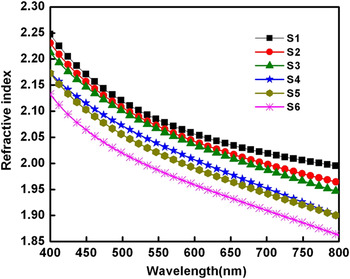
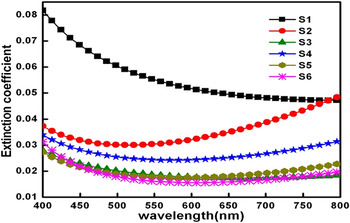
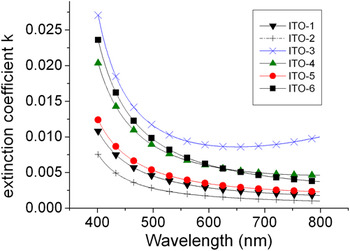
The refractive index (Fig. 1) and extinction coefficient (Fig. 2) data for the six samples obtained by reflectometry technique are reproduced for the sake of comparison. Reference Kumar, Raju and Subrahmanyam27 Reflectometry gives the thickness and wavelength dependent refractive index and extinction coefficient of the thin film provided the base data on the refractive index of the substrate are fed to the program. 39 Reflectometry basically uses the well-known Cauchy dispersion relations 39 : This analysis is labeled as Model-1.
Refractive index (n) variation of ITO thin films for different thicknesses (S1–S6) in the wavelength range of 400–800 nm evaluated from reflectometry data.

Extinction coefficient (k) variation of ITO thin films for different thicknesses (S1–S6) in the wavelength range of 400–800 nm evaluated from reflectometry data.

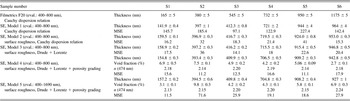
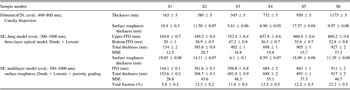
Model-1: During the first evaluation of the measured SE data, six free parameters were involved in the computation (Model-1): The thickness of the ITO layer and the other five are the parameters of the Cauchy dispersion relation. The thickness values obtained by evaluation of data measured by reflectometry together with thickness and MSE values obtained by evaluation of data measured by SE. Results are presented in Table I. There is a considerable deviation between the measured and generated ellipsometric angles. The thicknesses and the MSE values are displayed in Table I. The MSE values for the six samples from 97 to 227 are rather large; they indicate an inferior fit quality.
The thickness values obtained by evaluation of data measured by Filmetrics F20 along with thickness and MSE values obtained by evaluation of data measured by SE (different models).

B. Analyses of SE data using four optical models (400–800 nm)
The SE data are analyzed using four other optical models:
-
Model-2: surface roughness, Cauchy dispersion relation
-
Model-3: surface roughness, Drude + Lorentz
-
Model-4: surface roughness, Drude + Lorentz + porosity grading (400–800 nm)
-
Model-5: surface roughness, Drude + Lorentz + porosity grading (400–1690 nm)
All the results are given in Table I for clear comparison.
Model-2 to Model-5: During the second evaluation (Model-2) of the measured SE data a two-layer optical model was chosen. In the optical model a surface roughness layer was considered on the top of the ITO film. The surface roughness layer means that the ITO material was mixed with 50% void on the basis of the effective medium approximation. Reference Irene34,Reference Aspnes41 The only free parameter is the thickness of the surface roughness layer. Altogether seven free parameters were involved in the computation: Two of them are thickness-related parameters (thickness of the surface roughness layer and the thickness of the ITO layer); the other five ones are the parameters of the Cauchy dispersion relation. In the case of two-layer (surface roughness layer plus ITO layer) or multilayer optical models (surface roughness layer plus ITO layer with porosity grading) the “Thickness” is the sum of the thickness of the ITO layer and half of the thickness of the surface roughness layer.
The evaluation yielded MSE values from 15 to 41 for the six samples as one can see in Table I. These values show a considerable decrease if we compare to the previous case (Model-1). This means that the agreement between the measured and computed spectra improved substantially. This reflects that ellipsometry is very sensitive to the top surface condition, i.e., the insertion of the surface roughness layer into the optical model.
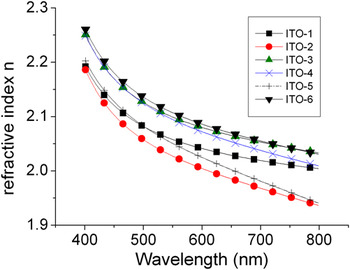
During the third evaluation (Model-3) of the measured SE data eight free parameters were involved in the computation: Two of them are thickness-related parameters (thickness of the surface roughness layer and the thickness of the ITO layer), the other six ones are in connection with the Lorentz oscillator and the Drude oscillator. Traditionally, the wavelength dependence of the complex refractive index of ITO material has been described by use of Lorentz and Drude oscillators. Reference Fukarek and Kersten2,Reference D'Elia, Scaramuzza, Ciuchi, Versace, Strangi and Bartolino25 The evaluation yielded MSE values from 14 to 23 for the six samples as one can see in Table I. This means that the agreement between the measured and computed spectra is satisfactory. Figure 3 shows the wavelength dependence of the refractive index for the six ITO films using Model-3. Figure 4 shows the wavelength dependence of the extinction coefficient for the six ITO films.
Refractive index (n) variation of ITO thin films for different thicknesses (S1–S6) in the wavelength range of 400–800 nm using a two-layer optical model with the combination of a Drude oscillator and a Lorentz oscillator for evaluation of SE data.

Extinction coefficient (k) variation of ITO thin films for different thicknesses (S1–S6) in the wavelength range of 400–800 nm using a two-layer optical model with the combination of a Drude oscillator and a Lorentz oscillator for evaluation of SE data.

In the fourth evaluation (Model-4) an additional free parameter was introduced in the computation: It describes the volume fraction of void. The optical model consists of the surface roughness layer and 99 sublayers. The void gradient was implemented through 99 sublayers; each sublayer can be considered as a mixture of ITO material and void according to the Bruggeman effective medium approximation. Reference Irene34,Reference Aspnes41
The ninth free parameter describes the void volume fraction of the first thin sublayer below the surface roughness layer. The void fraction of the last thin sublayer (this thin sublayer is adjacent to the glass substrate) is zero. In other words, the index grading in the ITO film was assumed to be linear with depth, and calculated by subdividing the ITO layer into many thin slabs (laminae), each of constant refractive index. The void fraction of the sublayer adjacent to the surface roughness layer and the refractive index of the sublayer adjacent to the glass substrate at a wavelength of 474 nm are given for Model-4.
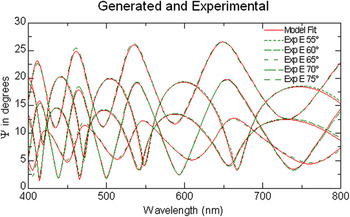
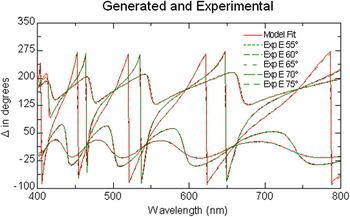
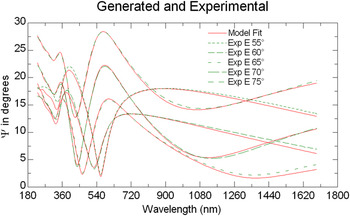
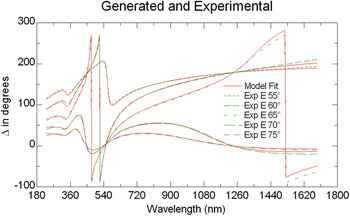
Figures 5 and 6 show the measured and generated values of the ellipsometric angles Ψ and Δ for sample S4 for the case of the evaluation by Model-4. The agreement between the measured and the calculated (simulated) spectra reveals the quality of the fit. The void fraction of the sublayer adjacent to the surface roughness layer is given in Table I for the six samples. The introduction of the new free parameter (void volume fraction) led to the decrease in MSE for all the six samples in the evaluation compared to the MSE values obtained during the evaluation applying Model-3. The fifth evaluation was performed in the wavelength range of 400–1690 nm. The results are also shown in Table I. The constant refractive index shown in Table I belongs to the sublayer adjacent to the glass substrate for Model-4 and Model-5.
Measured and generated ellipsometric angle Ψ for sample S4 evaluated using a two-layer optical model with the combination of a Drude oscillator and a Lorentz oscillator using porosity grading.

Measured and generated ellipsometric angle Δ for sample S4 evaluated using a two-layer optical model with the combination of a Drude oscillator and a Lorentz oscillator using porosity grading.

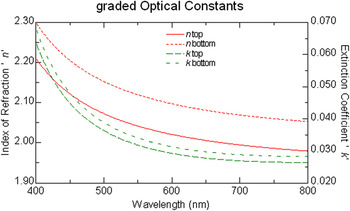
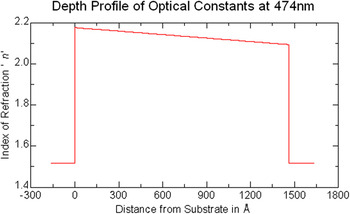
Figure 7 depicts the refractive index and the extinction coefficient in function of the wavelength for the top and the bottom sublayers of the ITO film for sample S1. Figure 8 shows the depth profile of the refractive index for the ITO film of sample S1. The refractive index at 474 nm of the sublayer adjacent to the glass substrate is given for all six samples in Table I. These refractive index values ranging from 2.14 to 2.20 are close to the refractive index value of the bulk ITO (2.19) mentioned by Kim et al. Reference Kim, Chhajed, Schubert, Schubert, Fischer, Crawford, Cho, Kim and Sone20
The refractive index and the extinction coefficient versus wavelength for the top and the bottom sublayer of the ITO film for sample S1.

Depth profile of refractive index for the ITO film of sample S1 at a wavelength of 474 nm.

C. Comparison with the model proposed by Jung Reference Jung14
The three-layer optical model constructed by Jung consists of a bottom layer just above the substrate (responsible for nucleation), a middle layer and the top layer representing the surface roughness.
Similar evaluations were performed on the SE data measured by us involving 15 free parameters. Since Jung performed the evaluations in the wavelength range of 300–1000 nm, we have chosen the same range. The free parameter describing the thickness of the bottom ITO layer was allowed to change between 0 nm and 100 nm in the global search procedure. From Table II one can see that the fit results are in the range of 20–53 nm for this parameter (depending on the total thickness). Jung published a value of 30 nm for the thickness of the bottom ITO layer (the total thickness of the films was about 150 nm in his experiment). Reference Jung14
The thickness values obtained by evaluation of data measured by Filmetrics F20 along with thickness and MSE values obtained by evaluation of data measured by SE. For the evaluation of SE data two different optical models were constructed. The so called Jung model is a three-layer optical model. In the case of Jung model (surface roughness layer plus ITO-upper and ITO-bottom layer) or multilayer model (surface roughness layer plus ITO layer with porosity grading) the “Total thickness” is the sum of the thickness of the ITO layers and the half of the thickness of the surface roughness layer. The void fraction of the sublayer adjacent to the surface roughness layer is given for the model with porosity grading.

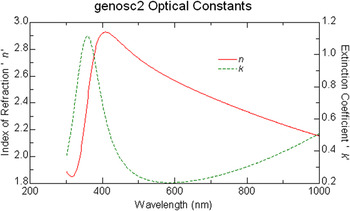
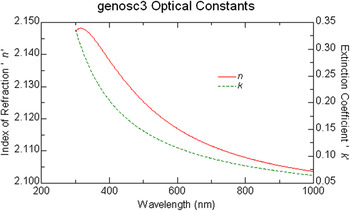
Figure 9 displays the wavelength dependence of refractive index and extinction coefficient of the bottom layer obtained from evaluation of SE data measured on sample S1. Figure 10 shows the refractive index and the extinction coefficient versus wavelength for the top ITO layer for sample S1 using evaluation of SE data based on the Jung model. In addition we evaluated the SE data using a two-layer optical model with the combination of a Drude oscillator and a Lorentz oscillator and porosity grading also in the wavelength range of 300–1000 nm. It is remarkable that the MSE values are significantly lower for evaluations performed using the so called Jung model than in the case of the optical model constructed with a linear porosity grading.
The refractive index and the extinction coefficient versus wavelength for the bottom ITO layer for sample S1 using evaluation of SE data based on the Jung model.

The refractive index and the extinction coefficient versus wavelength for the top ITO layer for sample S1 using evaluation of SE data based on the Jung model.

ITO films usually grow with a graded microstructure which introduces grading or vertical inhomogeneity into the complex refractive index of the films. Reference Woollam, McGahan and Johs3,Reference Synowicki4,Reference Jung14,Reference Tseng and Lo42 Evaluation using a vertically homogeneous ITO layer in the optical model in the visible spectral range (from 400 nm to 800 nm) provides the approximate film thickness and refractive index (this model is what is being used in reflectometry measurements). To obtain more accurate values it is necessary to take into account the vertical inhomogeneity in the optical model. The Jung model implements the vertical inhomogeneity by using two sublayers for the bulk ITO film, each sublayer described by free parameters concerning the thickness and the quantities belonging to the dispersion relation. During the evaluation in the step of the global minimum search 15 free parameters should be varied within the carefully prescribed limits to find the global minimum for MSE in the case of Jung model.
The Model-4 based on a void gradient implemented through 99 sublayers of equal thickness (linear porosity grading) for describing vertical inhomogeneity. Altogether 9 free parameters should be varied to find the global minimum for MSE. However, the computation time is considerably longer than in the case of the Jung model, because the treatment of the 100-layer structure (surface roughness layer + 99 sublayers) needs a lot of time.
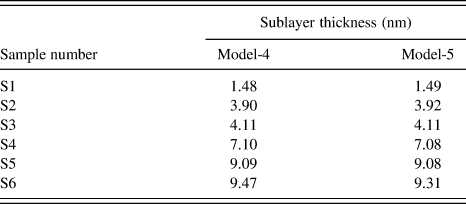
In Model-4 and Model-5 the bulk ITO film was divided into 99 sublayers of equal thickness, so the thickness of the sublayer changes from sample to sample. The constant refractive index shown in Table I belongs to the sublayer adjacent to the glass substrate. The sublayer thicknesses calculated in Model-4 and Model-5 are given in Table IA.
The sublayer thicknesses calculated in Model 4 and Model 5 for the six samples.

We have found that the MSE values are significantly lower for evaluations with Jung model than for evaluations performed with Model-4, with linear porosity grading.
D. Evaluation of optical constants of ITO in the wavelength range 230–1690 nm
Results on sample S1 are presented here. The analyses being similar, the data for other samples (S2–S6) are not presented in this communication. Figures 11 and 12 show the measured and generated psi and delta values for the wavelength range of 230–1690 nm, the significant deviation disappeared from the generated psi spectra at the vicinity of the starting wavelength. The MSE is 20.52.
The measured and generated psi (Ψ) values for sample S1 in the wavelength range of 230–1690 nm based on the Jung model.

The measured and generated delta (Δ) values for sample S1 in the wavelength range of 230–1690 nm based on the Jung model.

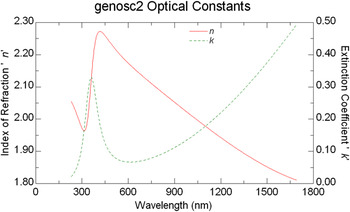
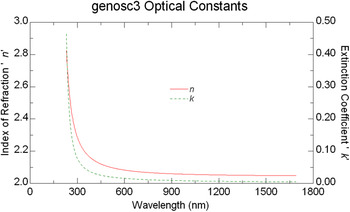
Figures 13 and 14 display the refractive index and the extinction coefficient versus wavelength for the bottom and top ITO layer for sample S1 using evaluation of SE data in the wavelength range of 230–1690 nm based on the model proposed by Jung.
The refractive index and the extinction coefficient versus wavelength for the bottom ITO layer for sample S1 using evaluation of SE data in the wavelength range of 230–1690 nm based on the Jung model.

The refractive index and the extinction coefficient versus wavelength for the top ITO layer for sample S1 using evaluation of SE data in the wavelength range of 230–1690 nm based on the Jung model.

IV. CONCLUSIONS
The optical constants: Refractive index (n) and extinction coefficient (k) for different thicknesses of ITO thin films measured by SR (400–800 nm) and SE (230–1600 nm) are presented in this communication. The ITO thin films have been prepared by reactive DC magnetron sputtering at room temperature (300 K) on soda lime glass substrates using a metal alloy target which quite likely introduces (due to unstable process) a vertically inhomogeneous ITO layer. Results show that the optical constants measured by SR are comparable with those evaluated by SE. Detailed analyses of SE data have been executed using five optical models. To analyze the graded structure of the films, optical models describing porosity gradient were used. The sublayer thicknesses are calculated. Most significant improvement of the fit quality was obtained by introducing a surface roughness layer. The SE data are also analyzed using the optical model proposed by Jung who suggested for description of the bulk ITO film two independent layers. We have found that the MSE values are significantly lower for evaluations with Jung model than for evaluations performed with linear porosity grading.
From the present study, it may be inferred that accurate estimate of the thickness and refractive index may be obtained if one follows the strategy: (i) first, one may apply the Cauchy dispersion relation in the visible spectral range (approximately from 400 nm to 800 nm) for the determination of the approximate film thickness and refractive index; (ii) in the second step one may use the three-layer optical model (surface roughness layer and two sublayers) elaborated by Jung to handle the vertical inhomogeneity; (iii) the approximate film thickness and refractive index values determined in the first evaluation step may serve to establish reasonable parameter limits for the global search procedure in the second step.
ACKNOWLEDGMENTS
The authors acknowledge the support of the Hungarian-Indian R&D Cooperation Program under the contracts No. TÉT10-1-2011-0305 and INT/HUN/P-O4/2012 dated 27 Sept 2012 (DST, Govt of India project sanction: TET_09_IN_DST_KFI dated 21 March 2012), the support from the Hungarian Scientific Research Fund (OTKA No. K81842), and the Hungarian National Development Agency grant TÁMOP-4.2.2/B-10/1-2010-0025; Department of Science and Technology, Government of India (INT/HUN/P-04/2012 dated 15 Dec 2009) for supporting the project.