Introduction
The Fipa population is a native, Tanzanian cattle strain reared mainly in the Fipa plateau of the Rukwa region, in the South-Western Highlands of Tanzania, where it has always been reared and much valued by the local farmers (Mwambene et al., Reference Mwambene, Katule, Chenyambuga and Mwakilembe2012). Together with the Tanzanian Shorthorn Zebu (TSZ), Tarime and Ankole breed, the Fipa cattle are the main sources of beef in the country. They also provide draft power, manure, milk and fulfil many socio-cultural functions to rural communities (URT, 2006). The estimated population of cattle in Rukwa region is 512 722, of which more than 50 percent are Fipa cattle kept by about 123 467 households (URT, 2010). Fipa cattle exist also in some parts of Zambia, while the Ankole cattle are found also in Uganda, Rwanda, Burundi and the Democratic Republic of Congo (Kugonza et al., Reference Kugonza, Nabasirye, Mpairwe, Hanotte and Okeyo2011).
The origin of Fipa cattle is uncertain, but it is likely that it is a stabilised crossbred of ‘Sanga and Zebu’ (Rege and Tawah, Reference Rege and Tawah1999). A recent morphometric analysis of Fipa cattle involving 14 body measurements revealed that the strain has a medium-sized stature, with multiple body colours and colour patterns, which contrast it with the other Tanzanian cattle strains (Mwambene et al., Reference Mwambene, Katule, Chenyambuga and Mwakilembe2012). Recently, interest in Fipa cattle has increased due to being highly preferred by the Fipa community vis-a-vis other Tanzanian indigenous cattle. The preference is attributed to their provision of optimal draft power, tasty meat, large body size, saleability, high fertility, resistance to disease/parasites and tolerance to drought/feed shortages (Mwambene et al., Reference Mwambene, Katule, Chenyambuga and Mwakilembe2012). The management of the animals need few inputs since they are well adapted to varied conditions, thus making them a low-risk resource to the owners (Köhler-Rollefson, Reference Köhler-Rollefson2005). The animals subsist mainly on natural pastures and crop residues in situ, and so play a positive role in environmental sustainability through on-farm nutrient recycling (Mwambene et al., Reference Mwambene, Katule, Chenyambuga and Mwakilembe2012).
Since the 1980s the Fipa cattle population has been gradually declining due to the decrease in grazing rangelands caused by the increase in human population and the expansion of cropping activities. The situation has been made worse by the unrestricted movements of other cattle strains in search of pastures and water, particularly the Tarime and Ankole, in some parts of the Fipa plateau in the last four decades. These developments pose a threat to the long-term existence and uniqueness of the Fipa cattle. However, it is not known to what extent genetic exchange has taken place between the Fipa and other indigenous cattle during this period of their coexistence in the area. So far no measure has been undertaken to characterise and conserve Fipa cattle, or to prevent genetic introgression from other cattle strains. The disappearance of an indigenous strain would undermine the food and livelihood security of the poor livestock keepers as well as their capacity to survive in marginal areas (Okomo-Adhiambo, Reference Okomo-Adhiambo2002). Normally the diversity and uniqueness of a strain, coupled by the farmers’ preference for the strain and the stable relationship between the strain and the environment provides a good starting point for implementation of a conservation programme of the strain in its native environment where it can perform at its best. Therefore, immediate steps should be taken to characterise the diversity and uniqueness of such cattle populations so that they may be considered as genetic resources for conservation.
In any case, the first step towards designing a conservation programme is to understand the genetic structure and morphometric characteristics of the relevant population. So far most classification studies that have been undertaken on livestock breeds in Africa have been based on historical, anthropological and morphological evidences. Such criteria are usually subjective and imprecise. Morphological features are also influenced by the environment (Rege, Reference Rege, Rege and Lipner1992). These criteria are therefore most often not sufficiently informative for the purpose of prioritisation and establishment of conservation and improvement programmes. Furthermore, morphological characteristics alone cannot be used as a basis for the establishment of ethnological relationships (Mwacharo et al., Reference Mwacharo, Okeyo, Kamande and Rege2006). They need to be complemented by analysis of genetic markers that measure the genetic diversity at molecular level (FAO, 2007) in order to provide valuable information for conservation decisions. Molecular characterisation is more reliable, since it is based on polymorphic and informative markers that examine diversity at DNA level (Mukesh et al., Reference Mukesh, Sodhi, Bhatia and Mishra2004). So far such information is not available for Fipa cattle. The elucidation of genetic variability and genetic relationships among breeds has direct relevance on sustainable use of domestic animal genetic resources (Rehman and Khan, Reference Rehman and Khan2009). Therefore, the aim of the current study was to assess the within-population genetic variability of Fipa cattle population, as well as establish its genetic relationship with the other cattle strains found in the area, using microsatellite markers.
Materials and methods
Study area
The study was conducted in the Fipa plateau of Rukwa region, in the South-Western Highlands of Tanzania. The Fipa plateau is the main agro-ecological zone (AEZ) of Rukwa region, and it is located at about latitudes 6°50′–9°40′S and longitudes 30°26′–32°54′E, with an elevation of 1 200–2 100 m above sea level. The locations, AEZs, geographical characteristics, climatic condition, altitudes, soil types, landscapes and farming systems of the study area were described in detail in the previous paper (Mwambene et al., Reference Mwambene, Katule, Chenyambuga and Mwakilembe2012).
Blood sampling and DNA amplification
A total of 240 blood samples (40 samples per population) were collected from four indigenous cattle strains: two subpopulations of Fipa cattle (Sumbawanga and Nkasi), Ankole, Tarime and Iringa red. In addition, the Friesian dairy cattle breed was included to serve as a reference breed. The division of the Fipa strain into two subpopulations was based on its recent history: the subpopulations being separated by a distance of about 100 km or more and the geographical proximity of the Nkasi Fipa cattle to other indigenous cattle strains (Tarime and Ankole) in Nkasi and Mpanda districts. The division was aimed at first, appraising if the two subpopulations represent identical or genetically distinct (differentiated) populations and secondly, ascertaining the genetic introgression of other cattle strains into the Fipa cattle strain. The Ankole, Tarime and Iringa red strains represent the Sanga, ‘Zebu × Sanga’ crossbreds and TSZ cattle, respectively. The Friesian dairy breed represents the taurine cattle.
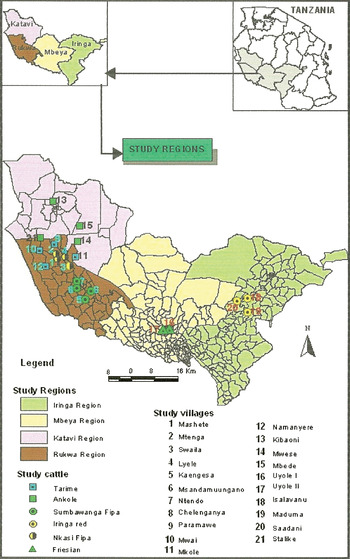
The samples for Fipa cattle were collected from four distantly located villages on the same set of animals from which morphological measurements had been undertaken previously. The samples for Tarime and Ankole cattle were collected from four distantly located villages for each breed in Nkasi and Mpanda districts. The Iringa red samples were collected from three distantly located villages in Mufindi district, in Iringa region. In all cases, about 10 unrelated animals were bled per village (at most two unrelated animals per household). The blood samples for Friesian cattle were collected from two Government Livestock Research and Training farms at Uyole, in Mbeya region (Figure 1).
A map of Tanzania showing the study regions and villages where Fipa, Tarime, Ankole, Iringa red and Friesian cattle blood samples were collected.

The blood samples were collected by jugular vein puncture using 5 ml EDTA vacutainer tubes. In all populations, efforts were made to sample from equal numbers of males and females to ensure that the animals were as representative of the population as possible. Farms in which there had been recent crossbreeding/interbreeding with other local or commercial breeds were excluded from the study. The processing and preservation of the blood samples were performed as described by Okomo (Reference Okomo1997). DNA samples were then extracted from the buffy-coat using a standard phenol-chloroform procedure (Sambrook, Fritsch and Maniatis,. Reference Sambrook, Fritsch and Maniatis1989). The extracted DNA samples were quantified using JENWAY GENOVA spectrophotometer and diluted to about 30 ng/μl using double distilled H2O and then stored at 4 °C before being sent to the laboratory for genotyping.
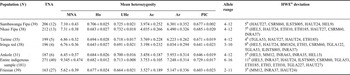
Thirty microsatellite markers used were selected based on the degree of polymorphism and genome coverage, and in accordance with the FAO and ISAG recommendations (FAO, 2004). Six PCR multiplex reactions were done to amplify the microsatellites according to standard protocols: ETH225 (D9S1), HEL5 (D21S15), HEL9, INRA23 (D3S10), BM1824 (D1S34), INRA35 (hexaplex 1), MM12 (D9S20), INRA32, INRA37, HAUT24 (D22S26), ILSTS005 (D10S25), TGLA126 (D20S1) (hexaplex 2), HEL1, BM1818, CSRM60 (D10S5), SPS115 (D15), TGLA53 (pentaplex 3), ETH185, BM2113, ILSTS006, INRA63, ETH3, CSSM66, ETH152 (dexaplex 4), HEL13, INRA005, ETH10 (triplex 5), TGLA227, TGLA122 and HAUT27 (triplex 6). The DNA samples were combined with fluorescent-labelled oligonucleotide primers (0.5 ml for ABI kit). PCR amplifications were performed using 10–11 µl reaction volumes with about 30 ng template DNA, 1 pmol/μl of primer forward and reverse, 1X PCR buffer (16 mM (NH4)2SO4, 67 mM Tris–HCl, pH 8.8, 0.01 percent Tween 20), 0.26 mM of every dNTPs, 2.5 mM of MgCl2 and 1 U of Taq DNA polymerase, in a final volume of 20 µl. The markers were amplified using the Qiagen Multiplex PCR kit at the following conditions: initial denaturation step of 15 min at 95°C, followed by 30 cycles of 30 s at 94°C, annealing for 90 s at 52°C for multiplexes 1, 2 and 3; 55°C for multiplex 6 and 58°C for multiplexes 4 and 5, a final elongation at 72°C for 1 min and 1 cycle at 60°C for 30 min, and a touchdown cycle profile at 4°C. Individual genotypes were determined with an ABI Genetic Analyzer 3130xl and GeneMapper ver 4.0 (Applied Biosystems, Foster City, CA, USA). Of the 30 microsatellite loci, 29 loci amplified successfully and produced definite banding patterns. Animals with less than 60 percent of amplified markers (n = 20) were dropped from the dataset (Table 1).
Number of alleles, in brackets number of private alleles, observed and unbiased expected heterozygosity, effective number of alleles, allelic richness, polymorphic information content and HWE at 29 microsatellite loci in 6 cattle populations.

Note: N, number of samples; TNA, total number of alleles; in brackets number of private alleles; MNA, mean number of alleles per locus; H, observed heterozygosity; UHe, unbiased expected heterozygosity; Ar, allelic richness; Ae, effective number of alleles; PIC, polymorphic information content;
a Number and types of loci not in Hardy–Weinberg equilibrium (HWE; P < 0.05);
b *Population not in Hardy–Weinberg equilibrium (HWE; P < 0.05).
Statistical analyses
Within-population genetic diversity
Allele frequencies (Af), allelic richness (Ar), private alleles (Ap), effective number of alleles (Ae), observed heterozygosity (Ho) and unbiased genetic diversity (UHe) were calculated using GenAlEx 6.41 software (Peakall and Smouse, Reference Peakall and Smouse2006) per locus, for each population of cattle and for pooled sample. To eliminate the influence of different sample sizes from locus to locus and for each population on evaluation; genetic diversity, distance and allelic richness were calculated following rarefaction method in order to standardise them (Petit, El Mousadik and Pons, Reference Petit, El Mousadik and Pons1998). Polymorphic information content (PIC) was also assessed using the software Cervus 3.0.3 (Kalinowski, Taper and Marshall, Reference Kalinowski, Taper and Marshall2007).
Test for conformity to Hardy–Weinberg equilibrium
Genepop v. 4.0 (Rousset, Reference Rousset2007) was used to perform the test for conformity to Hardy–Weinberg equilibrium (HWE) per locus and per breed, using the Exact test of Guo and Thompson (Reference Guo and Thompson1992). Once a deviation from equilibrium was observed at some loci a more powerful test was applied to evaluate the heterozygote deficiency or excess following the suggestions of Raymond and Rousset (Reference Raymond and Rousset1995).
Genetic diversity among the strains
Genetic distances D A (Nei, Tajima and Tateno, Reference Nei, Tajima and Tateno1983) between the strains were assessed and based on allele frequencies using the GenAlEx 6.41 software. The extent of genetic differentiation among the strains was determined using F ST statistics. The F STAT v.2.9.3 software was used to estimate the F IS, F IT and F ST statistics (Weir and Cockerham, Reference Weir and Cockerham1984) and their significance was inferred by methods based on randomisation. A dendrogram showing the relationship of the strains was constructed based on the D A distance by the neighbour-joining method (Saitou and Nei, Reference Saitou and Nei1987) using MEGA version 5 (Tamura et al., Reference Tamura, Peterson, Peterson, Stecher, Nei and Kumar2011). The D A genetic distance is better suited to obtain correct tree topology than other distances, regardless of a mutation model (Takezaki and Nei, Reference Takezaki and Nei1996). The principal component analysis (PCA) was performed with the GenAlEx 6.41 software using allele frequencies observed at 29 microsatellite loci in order to asses genetic relationships among the strains based directly on allele frequencies. The structure software (Pritchard, Stephens and Donnelly, Reference Pritchard, Stephens and Donnelly2000; Falush, Stephens and Pritchard,. Reference Falush, Stephens and Pritchard2003) was used to analyse possible genetic admixture. To choose the appropriate number of inferred clusters to model the data, one to six inferred clusters were performed with ten independent runs each. All analyses used a burn-in period of 50 000 and 100 000 iterations (MCMC) for data collection. Individual animals were assigned to their presumed population of origin using individual assignment tests using the GenAlEx 6.41 program, in order to ascertain genetic admixture.
Results
Within-population genetic diversity and conformity to HWE
A total of 271 alleles were generated among the indigenous strains. The number of alleles per locus ranged from 6 for INRA63, ETH3 and ETH152 to 16 for TGLA53, with an average of 9.345 alleles per locus (Table 1). All of the loci under investigation were polymorphic. The Nkasi Fipa strain had the highest mean number of alleles (7.31), followed by the Sumbawanga Fipa strain (7.10), while the Ankole cattle revealed the lowest mean (6.45). Likewise, the Nkasi Fipa strain had the highest allelic richness (6.49), whereas the Ankole breed had the lowest mean (5.953). Private alleles were detected in all the indigenous strains. The number of private alleles ranged from 13 for Nkasi Fipa to 4 for Iringa red. However, the frequencies of all private alleles from the indigenous strains were generally low (<0.1). The number of private alleles for the Friesian breed was 27, with some alleles having frequencies of more than 0.1.
The mean polymorphic information content (PIC) was 0.677 in the Nkasi Fipa, 0.685 in the Sumbwanga Fipa, 0.671 in the Tarime, 0.641 in the Iringa red and 0.646 in the Ankole cattle. For all indigenous strains, the PIC ranged from 0.474 for INRA35 to 0.871 for HEL9, with a mean of 0.729.
The mean observed (Ho) and expected (He) heterozygosities were 0.683 and 0.732 in Nkasi Fipa, 0.706 and 0.725 in Sumbawanga Fipa, 0.694 and 0.718 in Tarime, 0.643 and 0.691 in Iringa red and 0.684 and 0.700 in Ankole cattle, respectively. The average observed heterozygosity was lower than the average expected heterozygosity in all strains. The diversity analysis revealed considerable levels of genetic variation in all the strains, with the Nkasi Fipa and Sumbawanga Fipa subpopulations displaying somewhat higher levels of genetic polymorphism than the other strains (Table 1).
The test for conformity to HWE revealed that all strains exhibited significant (P < 0.05) deviations from the HWE at some of the loci. In the pooled indigenous strain samples, a total of 11 of 29 loci deviated from the HWE. The Iringa red cattle had the highest number of loci (9) that deviated from the HWE while Tarime cattle had the lowest (4) number of loci deviating from the HWE. Most of the loci that significantly deviated from the HWE exhibited deficiency of heterozygotes, except for CSRM60 in Sumbawanga Fipa; INRA37 in Nkasi Fipa; BM1824, CSRM60, ETH3 and TGLA122 in the Iringa red; and MM12 and HEL13 in Ankole cattle which showed heterozygote excess.
F-statistics
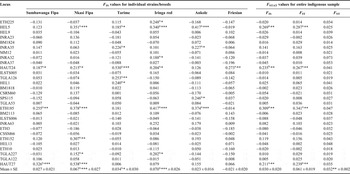
Table 2 shows Wright's F-statistics in the entire sample and per strain, revealing that the homozygote excess in the whole population was moderate (F IT = 0.061). The F IT values per locus ranged from −0.002 for HEL13 to 0.341 for ETH185. The F IS values within the entire population ranged from −0.002 for BM1818 to 0.309 for ETH185, with a mean of 0.030, which was not significantly different (P > 0.05) from zero. Of the 29 markers, 17 had negative F IS values while the rest had positive F IS values. The F ST values ranged from 0.014 for BM1824 to 0.073 for INRA32, with an overall mean of 0.032 which was highly significant (P < 0.01).
Wright's F-statistics values for each strain/breed and for the entire indigenous sample.

Note: F IS, inbreeding coefficient of an individual relative to its subpopulation; F IT, inbreeding coefficient of an individual relative to the whole set of indigenous populations; F ST, inbreeding coefficient of the subpopulation relative to the entire indigenous population; SE, standard error;
a Deficit of heterozygote;
* P < 0.05;
** P < 0.01;
*** P < 0.001.
Within each strain, the F IS values ranged from −0.010 for BM1818 and ETH10 in Sumbawanga Fipa and Tarime cattle to 0.530 for HAUT24 in Tarime cattle. The average F IS values across microsatellite loci ranged from 0.023 for the Ankole to 0.070 for the Iringa red. The mean F IS values for Sumbawanga Fipa and Ankole cattle were not significantly different (P > 0.05) from zero, while these estimates were significant (P < 0.05) in Tarime, Nkasi Fipa and Iringa red cattle.
Genetic relationships among strains
Table 3 summarises genetic distances (D A) and gene differentiation (F ST) indices between all pairs of cattle strains/breeds. The closet D A genetic distance (0.032) was obtained between Sumbawanga Fipa and Nkasi Fipa, whereas the largest D A (0.095) was obtained between Iringa red and Ankole. These results were as expected as they correspond well to the distances between the geographical locations inhabited by these strains in Tanzania. The smallest F ST value (0.013) was observed between the Sumbawanga Fipa and the Nkasi Fipa, while the largest (0.027) was between Iringa red and Ankole. This corresponds well to the D A values obtained in the study. The pair-wise F ST values obtained showed that the strains/breeds were highly significantly (P < 0.01) different from each other.
Pair-wise Nei unbiased genetic distances (D A below diagonal) and fixation indices (F ST above diagonal) between cattle populations.

Note: **F ST values highly significantly different from zero (P < 0.01), ***F ST values very highly significantly different from zero (P < 0.001).
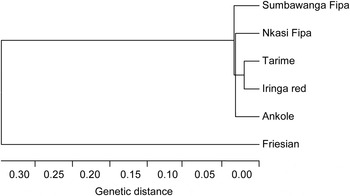
The NJ tree based on D A genetic distance is represented in Figure 2. The tree shows the existing relationships among the indigenous strains according to loci considered in the study. As it would be expected, the Sumbawanga Fipa and Nkasi Fipa are close to each other, whereas the Nkasi Fipa cattle are closer to the Tarime, and then to the Iringa red than to the Ankole cattle as shown in Figure 2. The Friesian breed is well separated from the indigenous strains.
Unrooted neighbour-joining tree showing genetic relationships of five Tanzanian cattle strains and the Friesian breed using D A genetic distances from 29 microsatellite loci.

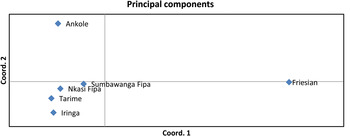
Assessment of genetic relationships between breeds/strains using PCA is represented in Figure 3. The first three principal components accounted for 91.54 percent of the total genetic variation. The first PC explained 74.4 percent of the variation and clearly separated Friesian cattle from the indigenous strains. The second PC explained an additional 9.14 percent of diversity and separated the Ankole from the other four indigenous strains. The grouping in this PCA almost supports the clustering in the NJ tree (Figure 2).
Principal components graph of the first three principal components from six populations.

Individual animals’ assignment to their population of origin
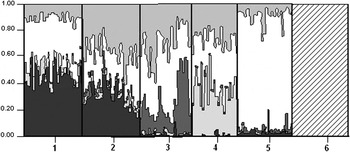
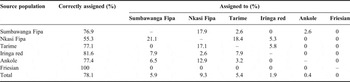
The results of the analyses for individual animal assignment and population structure are shown in Table 4 and Figure 4, respectively. The proportion of animals from each group correctly assigned to their source population ranged from 55.3 percent for Nkasi Fipa to 81.6 percent for Iringa red, with an average of about 73.7 percent for the entire indigenous cattle population. Considerable proportions of Nkasi Fipa animals were assigned to other clusters, such as Sumbawanga Fipa (21.1 percent) and Tarime (18.4 percent). This further demonstrates the close relationship of the Nkasi Fipa cattle to both the Sumbawanga Fipa and the Tarime cattle. A similar feature was apparent for the proportions of Sumbawanga Fipa (17.9 percent) and Tarime (17.1 percent) individual animals assigned to the Nkasi Fipa cluster. Few Ankole (6.5 percent) and Iringa red (7.9 percent) individuals were found in the Sumbawanga Fipa cluster, Nkasi Fipa (12.9 and 2.6 percent) and Tarime (3.2 and 7.9 percent) clusters. The mis-assignments of some of the indigenous animals could also be clearly illustrated by the structure analysis (Figure 4). As it would be expected, all individual animals from the Friesian breed were correctly assigned to their source population.
Structure analysis of six cattle populations (1 – Sumbawanga Fipa, 2 – Nkasi Fipa, 3 – Tarime, 4 – Ankole, 5 – Iringa red and 6 – Friesian).

Percentages of individual animals from each population correctly and incorrectly assigned to source and other populations (with leave one out option).

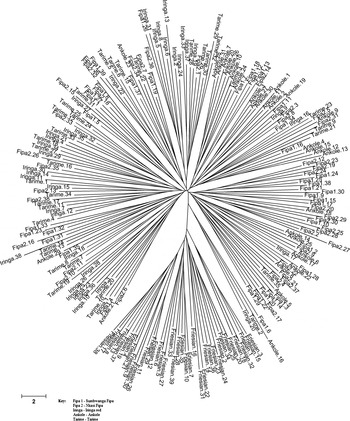
The genetic relationship of the strains was also assessed using the phylogenetic analysis of individual animals. The NJ dendrogram in which each individual animal is treated as a taxonomic unit showed that the animals from each indigenous strain did not separate into specific clusters while the animals from the Friesian breed formed a distinct cluster (Figure 5).
A radiation neighbour-joining dendrogram constructed from allele-sharing distances among 220 individual animals from four Tanzanian strains and one exotic breed.

Discussion
Within-strain genetic variability and compliance to HWE
The estimates of genetic diversity were based on a set of markers showing relatively high levels of polymorphism. The total number of alleles per locus in all the studied indigenous cattle ranged from 6 to 16, with an average of 9.345. This level is considered sufficient and above the recommended number of alleles (>4) to reduce the standard error estimates of genetic distances (FAO, 2004). The total numbers of alleles per locus and high PIC values that were observed in this study suggest that these markers are informative for genetic diversity in Tanzanian cattle and that Tanzanian cattle possess a wide genetic base that allows for adaptation to a wide variety of ecological environments. This is also an indication of heterogeneity of individual animals that were sampled in all the strains/breeds. However, the Nkasi Fipa cattle had the highest number of alleles per locus while the Ankole cattle had the lowest. The mean number of alleles per locus found in the present study is lower than the 12.5 alleles per microsatellite locus observed by Okomo-Adhiambo (Reference Okomo-Adhiambo2002) in Kenyan Zebu strains and 11.5 alleles per microsatellite locus observed by Ibeagha-Awemu et al. (Reference Ibeagha-Awemu, Jann, Weimann and Erhardt2004) in West/Central African cattle breeds.
All the indigenous strains exhibited significant deviations from HWE at some of the loci. Although, it is difficult to envisage the exact basis of this deviation, yet the presence of heterozygote deficiencies at some of the loci studied may suggest inbreeding to be a possible reason. However, it should be noted that the deficiency of heterozygotes within indigenous strains is not only an indicator of inbreeding, but also non-random mating or population subdivision.
The mean gene diversity as indicated by UHe had a range of 69.1 percent for the Iringa red to 73.2 percent for the Nkasi Fipa cattle. This is within the range of 60–75 percent reported by Ibeagha-Awemu et al. (Reference Ibeagha-Awemu, Jann, Weimann and Erhardt2004) and Dalvit et al. (Reference Dalvit, De Marchi, Dal Zotto, Zanetti, Meuwissen and Cassandro2008) in both native and commercial cattle breeds. These values are also within the range of 70.7–75.4 percent reported by Okomo-Adhiambo (Reference Okomo-Adhiambo2002) in Kenyan Zebu cattle. However, the UHe values in the present study are slightly higher than the value of 64.1 percent reported by Okomo-Adhiambo (Reference Okomo-Adhiambo2002) in Sahiwal cattle.
The Fipa cattle are kept by a considerable number of rural farmers, who practice uncontrolled (random) mating (Mwambene et al., Reference Mwambene, Katule, Chenyambuga and Mwakilembe2012). This might explain why the within Fipa cattle population genetic diversity was rather high. Toro and Maki-Tanila (Reference Toro, Maki-Tanila and Oldenbroek2007) also suggested that the high genetic diversity observed within strains could arise from overlapping generations and population mixtures from different geographical locations, with natural selection favouring heterozygosity. A similar notion was expressed by Machado et al. (Reference Machado, Antonio, Schuster, Martinez and Campos2003) to explain the high diversity within the local Brazilian Gyr cattle breed. Normally, high levels of gene flows among different populations maintain high genetic diversity within each population and therefore, make them little susceptible to genetic drift (Falconer and Mackay, Reference Falconer and Mackay1996).
The high gene diversity observed in the Fipa and other indigenous strains suggests the existence of a high underlying genetic diversity within the strains that can be utilised to improve desirable traits. This result is coherent with the great phenotypic diversity that was previously reported in the Fipa cattle population (Mwambene et al., Reference Mwambene, Katule, Chenyambuga and Mwakilembe2012), which is also an indication of a great functional genetic diversity in the strain. Functional diversity is valuable for achieving present or future breeding objectives and, therefore, strains with high functional diversity (i.e. measured by neutral genetic markers) coupled with other physical and socio-economical attributes should receive a high priority for conservation. According to Notter (Reference Notter1999), the high diversity of native strains which are usually subjected to traditional husbandry practices enhances adaptation ability of the strains to changing environment, market demand and breeding goals.
The levels of gene diversity in five indigenous strains did not differ significantly. The lack of significant differences between strains observed in this study with respect to within-strain gene diversity might have been caused by a recent differentiation of the strains from a common ancestral population, coupled with the continuous mixing and interbreeding between geographically proximal strains. In the last four decades some agro-pastoral communities, particularly the Sukuma, have been migrating from one place to another in the South-Western Highlands of Tanzania in search of pastures. This has led to the coexistence of the Fipa with other indigenous strains in this area, thus leading to an admixture and interbreeding among the indigenous strains.
Never-the-less, all the strains had mean Ho values lower than He values and therefore, pointing to a possible departure from random mating. This is evidenced by the fact that of the 29 loci studied, 12 loci revealed heterozygote deficiency. This observation might have resulted from mating between relatives, similar to what has been reported by Rehman and Khan (Reference Rehman and Khan2009) in Hariana and Hissar cattle populations.
Inbreeding coefficients of the strains
The total inbreeding coefficient (F IT value) observed in this study was moderate and it could be accounted for by the observed mean within-heterozygote deficiency (F IS value). Increasing F IT values are an indication of some measure of homozygote excess or heterozygote deficit resulting from relatedness of individuals. The presence of positive F IS values for some loci suggests heterozygote deficiencies, as it has been reported in other studies on cattle breeds (MacHugh et al., Reference MacHugh, Shriver, Loftus, Cunningham and Bradley1997; Ciampolini et al., Reference Ciampolini, Cetica, Ciani, Mozzanti, Fosella, Marroni, Biagetti, Sebastiani, Papa, Filippini, Cianci and Presciuttini2006; Dalvit et al., Reference Dalvit, De Marchi, Dal Zotto, Zanetti, Meuwissen and Cassandro2008; Rehman and Khan, Reference Rehman and Khan2009). The heterozygote deficiencies might have been caused by pooling together different populations in the analysis which are actually subdivided. This is because the samples for each strain were collected from different areas.
The average F IS values for most of the loci in Sumbawanga Fipa and Ankole cattle were positive but not significantly (P > 0.05) different from zero, thus indicating a very low rate of inbreeding within each strain. On the contrary, the Nkasi Fipa, Tarime and Iringa red cattle had positive F IS values that were significant (P < 0.05). This observation suggests some degree of inbreeding or non-random mating within each strain. It is not clear how such a result could come about for the Nkasi cattle as they do almost coexist with Tarime and Ankole cattle unlike the Sumbawanga Fipa cattle. These results could also explain the deviation from HWE observed in some loci, both in the whole sample and in each strain. Generally, the F IS values per strain observed from this study were still low in comparison with those reported from the other studies on local breeds. Moioli, Napolitano and Catillo (Reference Moioli, Napolitano and Catillo2004) reported values ranging from 0.102 to 0.138 in their study on three indigenous Italian cattle breeds and Rendo et al. (Reference Rendo, Iriondo, Jugo, Aguirre, Mazon, Vicario, Gomez and Estonba2004) reported an F IS estimate of 0.108 in the Betizu cattle, a native breed in Spain. However, it is important to note that the F IS values observed in the present study might have been based on different markers, sample sizes and sampling procedures from those obtained from other studies.
Distinctiveness and relationships of the Fipa with other strains
One of the main objectives of this study was to evaluate the genetic distinctiveness of the Fipa cattle strain in reference to other indigenous strains in order to determine if it merits to be considered for conservation, promotion and improvement. The evaluation was based on coefficients of genetic differentiation (F ST), genetic distances (D A), Neighbour-joining (NJ) tree, population structure and principal component (PC) analyses. The mean coefficients of genetic differentiation observed in this study demonstrated that only about 3.2 percent of the total genetic variation was accounted for by between-indigenous strain differences, while the rest (96.8 percent) was attributed to differences among individuals within indigenous strains. Molecular genetic variation was therefore observed to be higher within strains than among strains, which suggest high heterogeneity within the strains sampled. The observed overall level of differentiation among indigenous strains was lower than that reported (9 percent) by Okomo et al. (Reference Okomo, Rege, Teale and Hanotte1998) in East African cattle, 11 percent reported by MacHugh et al. (Reference MacHugh, Shriver, Loftus, Cunningham and Bradley1997) in European cattle and 6.8 percent reported by Jordana et al. (Reference Jordana, Alexandrino, Beja-Pereira, Bessa, Canon, Carretero, Dunner, Laloe, Moazami-Goudarzi, Sanchez and Ferrand2003) in South European beef breeds. The pair-wise F ST values were relatively small, indicating low levels of genetic differentiation between the indigenous strains. Low levels of genetic differentiation between indigenous strains are attributed to high gene flows, admixture and interbreeding in the study area as well as sharing a common ancestry among the strains. According to Laval et al. (Reference Laval, Iannuccelli, Legault, Milan, Groenen, Giuffra, Anderson, Nissen, Jorgensen, Beeckmann, Foulley, Chevalet and Ollivier2000), migration and admixture may exert a greater effect than mutation or drift on the reduction of genetic differentiation between populations.
The Ankole breed was relatively distantly related from the other indigenous strains. This finding can be attributed to the different ancestral origin of the Ankole cattle (which is a Sanga), from that of the Fipa and Tarime (which are Zebu × Sanga crosses), and the Iringa red (which is a Zebu). The Fipa cattle were more closely related to the Tarime than to the Iringa red cattle. This is because both Tarime and Fipa cattle are Sanga × Zebu crosses. They are also kept in the proximity with each other in the area, particularly in Nkasi district. Although the Iringa red strain is far more isolated by distance from the Fipa population than the Ankole subpopulation sampled in the current study, the genetic analysis results showed that the Fipa cattle are more closely related to the Iringa red than to the Ankole cattle. This observation suggests that the Fipa cattle have more Zebuine than Sanga inheritance in their genetic constitution. The genetic distance between the Sumbawanga Fipa and Nkasi Fipa cattle was the smallest. This finding confirms a recent separation of the strains from a common ancestry. Accordingly, the two Fipa subpopulations showed a significant genetic divergence between them. The divergence might be attributed to genetic introgression from either the Tarime or Ankole in the Nkasi subpopulation. The Fipa cattle population subdivision leading to independent genetic drift in each subpopulation, as well as limited gene flow between them because of being isolated by a large physical distance might also be the additional causes of observed divergence. The existence of substantial genetic differentiation between cattle populations has been considered by many scholars to be advantageous for conservation purpose (Talle, Reference Talle2004).
Genetic structure of indigenous strains
The cluster, breed assignment and dendrogram analyses using individual animals as operational taxonomic units showed an intermixing of the indigenous strains. Some individuals from different strains appeared in the other groups and therefore lacking very specific population subclusters. The analyses revealed that the five indigenous strains are closely related. These results confirmed further the lack of genetic distinctiveness of the Fipa population from the other indigenous strains.
The results for principal component analysis supported the close relationships among the indigenous strains, except the Ankole breed. These observations signify further that the indigenous strains share a common ancestry and that their separation is only recent. The mis-assignments of the animals were also probably caused by admixture and interbreeding of the strain as a result of coexisting in the same geographical areas, as well as by the movement of animals in search for pastures. The findings of the present study are consistent with the results that have been reported by Moioli, Napolitano and Catillo (Reference Moioli, Napolitano and Catillo2004) in the Italian cattle breeds. These authors observed that individual animals from breeds that had no gene-flow between them were clearly coherent in their respective clusters. But, breeds that had been admixed had some of their members mis-assigned away from their respective clusters.
Even if the Fipa population is not at risk of extinction (Mwambene et al., Reference Mwambene, Katule, Chenyambuga and Mwakilembe2012), the results of this study point to the merit of considering an immediate conservation programme for the Fipa cattle, with the aim of conserving the genetic purity of the strain and slowing down its rate of admixture/introgression with other indigenous strains. Conservation measures would aim at maintaining the desirable traits of the Fipa cattle that are preferred by the Fipa community. Despite the genetic indistinctiveness of the Fipa population from the other indigenous strains, the Sumbawanga Fipa germplasm deserves to be conserved based on its within-population genetic diversity, very low inbreeding coefficient and threat emanating from population admixture with other indigenous strains. However, these results need also to be complemented by detailed phenotypic, desirable (adaptive and productive) attributes, socio-economic roles, ecological, cultural values and population status (degree of endangerment) information for development of rational conservation and improvement strategies.
Conclusion and recommendations
On the basis of the findings of the current study, it is concluded that:
1. The Fipa and other indigenous strains have considerably high within-population genetic diversity, as measured by MNA, observed and expected heterozygosities.
2. The Sumbawanga Fipa and Ankole cattle have very low inbreeding coefficients, not significantly different from zero, while the Nkasi Fipa, Tarime and Iringa red cattle strains show significant inbreeding levels.
3. Indigenous cattle strains are genetically more closely related, as shown by low F ST and D A values among them.
4. The Fipa cattle population is genetically indistinct from the other indigenous strains, as indicated by the NJ, PC, individual animal assignment and structure analyses.
5. It is recommended that further genetic analyses on the Fipa cattle strain be undertaken using mitochondrial DNA analyses in order to better understand the origins and uniqueness of the Fipa population.
Ethical clearance statement: Research protocols followed the guidelines stated in the Guide for the Care and Use of Agricultural Animals in Research and Teaching (FASS, 2010).
Statement of interest: The authors strongly declare that there are no conflicts of interest.
Acknowledgements
This study is part of the phenotypic and genetic characterization work of the Fipa cattle in the South-Western Highlands of Tanzania. The authors wish to thank E. Rugaimukamu from Veterinary Molecular Biology Laboratory, Sokoine University of Agriculture, Tanzania and Pamela Hind from Agriculture and Agri-Food Canada for the field and laboratory work, and farmers from Katavi, Rukwa, Mbeya and Iringa regions for allowing the researchers to collect blood samples from their herds. We are also grateful to two anonymous reviewers for constructive feedback and insightful suggestions. This research was financially supported by the Agricultural Sector Development Programme (ASDP) in Tanzania. The financial and technical supports are highly acknowledged.