1. Introduction
Yaglom’s equation (Yaglom Reference Yaglom1949; Monin & Yaglom Reference Monin and Yaglom1975), which relates the second-order moment of the scalar increment
 $\overline {{{(\delta \theta )}^2}}$
to the third-order mixed moment
 $\overline {{{(\delta u )(\delta \theta )}^2}}$
, is given by
 \begin{equation} - \overline {\delta u\,{{(\delta \theta )}^2}} + 2\kappa \frac {\partial }{{\partial r}}\overline {{{(\delta \theta )}^2}} = \frac {4}{3}{\overline \varepsilon _\theta }r, \end{equation}
where
 $\delta u$
is the velocity increment
 $u(x+r)-u(x)$
between two points separated by a distance
 $r$
in the
 $x$
direction,
 $\delta \theta$
is the scalar increment
 $\theta (x+r)-\theta (x)$
,
 $\kappa$
is the thermal diffusivity,
 $\overline \varepsilon _{\theta }=3\kappa\, \overline {{{ ( {\partial \theta /\partial x} )}^2}}$
is the isotropic scalar dissipation rate, and the overbar denotes time averaging. To obtain (1.1), local isotropy and homogeneity are assumed, and the large-scale forcing, or the energy input, is ignored. With the further assumption that the molecular diffusion is not important, (1.1) yields the famous
 $4/3$
law (Yaglom Reference Yaglom1949), i.e.
 \begin{equation} - \overline {\delta u\,{{(\delta \theta )}^2}} = \frac {4}{3}{\overline \varepsilon _\theta }r, \end{equation}
in the inertial range. It is worth emphasising that (1.2) is an asymptotic result, valid only when the Reynolds and Péclet numbers are very large.
After normalisation by the Batchelor scalar scale
 ${\theta _B} = {({\overline \varepsilon _\theta }{(\nu /\overline \varepsilon )^{1/2}})^{1/2}}$
and the Kolmogorov velocity scale
 ${u_K} = {(\nu \overline \varepsilon )^{1/4}}$
and Kolmogorov length scale
 $\eta = {({\nu ^3}/\overline \varepsilon )^{1/4}}$
(where
 $\nu$
is the kinematic viscosity, and
 $\overline \varepsilon =15\nu\, \overline {{{ ( {\partial u /\partial x} )}^2}}$
is the isotropic form of the mean turbulent kinetic energy dissipation rate), relation (1.2) can be rewritten as
 \begin{equation} - \overline {\delta u^*{{(\delta \theta ^* )}^2}} = \frac {4}{3}r^*, \end{equation}
where
 $*$
denotes normalisation by
 $\theta _B$
,
 $u_K$
and
 $\eta$
. Equation (1.3) indicates that
 $\overline {\delta u\,{{(\delta \theta )}^2}}$
satisfies similarity based on
 $\theta _B$
,
 $u_K$
and
 $\eta$
, provided that the Reynolds and Péclet numbers are very large so that (1.2) is valid over a significant range of
 $r$
. Also, using normalisation by
 $\theta '\ (\equiv \overline {\theta ^2}^{1/2})$
,
 $u'\ (\equiv \overline {u^2}^{1/2})$
and the integral length scale
 $L$
, one can write (1.2) as
 \begin{equation} - \overline {\delta u^+\,{{(\delta \theta ^+ )}^2}} = C_{\varepsilon \theta } \frac {4}{3}r^+. \end{equation}
The superscript
 $+$
denotes normalisation by
 $\theta '$
,
 $u'$
and
 $L$
, and
 $C_{\varepsilon \theta }$
(
 $=\overline \varepsilon _\theta L/\overline {u^2}^{1/2} \overline {\theta ^2}$
) is the non-dimensional scalar dissipation rate. Since
 $C_{\varepsilon \theta }$
is constant at large
 $Re_\lambda$
(
 $= \overline {u^2}^{1/2}\lambda /\nu$
, where
 $\lambda = \overline {u^2}^{1/2}/ \overline {(\partial u/\partial x)^2}^{1/2}$
is the longitudinal Taylor microscale), and when the Schmidt number
 $Sc=\nu /\kappa$
is of order 1 (see e.g. figure 1 of Buaria et al. Reference Buaria, Clay, Sreenivasan and Yeung2021), (1.4) indicates that
 $\overline {\delta u\,{{(\delta \theta )}^2}}$
satisfies similarity based on
 $\theta '$
,
 $u'$
and
 $L$
. In summary,
 $\overline {\delta u\,{{(\delta \theta )}^2}}$
satisfies the dual scaling, i.e. the scaling based on
 $\theta _B$
,
 $u_K$
,
 $\eta$
and
 $\theta '$
,
 $u'$
,
 $L$
simultaneously, when the Reynolds number is very large and the Schmidt number is
 $1$
. It is worth mentioning that Tennekes & Lumley (Reference Tennekes and Lumley1972) (see their chapter 8.3) and Gamard & George (Reference Gamard and George2000) have examined the dual scaling, i.e. the Kolmogorov scaling and the large-scale scaling, in the context of the energy spectrum in a shear flow and grid turbulence, respectively. They showed that the dual scaling leads to a
 $-5/3$
power-law scaling, which is likely to emerge at very large
 $Re_\lambda$
. Recently, Tang, Antonia & Djenidi (Reference Tang, Antonia and Djenidi2023) examined the dual scaling of the longitudinal velocity structure function
 $\overline {{(\delta u)}^n}$
in the context of both the transport equation for the second-order velocity structure function
 $\overline {{(\delta u)}^2}$
and experimental grid turbulence data. Their results indicate that the dual scaling leads to a power-law relation
 $\overline {{(\delta u)}^n} \sim r^{n/3}$
when the inertial range is rigorously established as
 $Re_\lambda \to \infty$
. (Strictly, an infinite Reynolds number is achievable only if
 $\nu \to 0$
. Since our interest is in real flows, ‘as
 $Re_\lambda \to \infty$
’ should be interpreted as ‘when
 $Re_\lambda$
is very large’.) We want to stress that the Kolmogorov scaling and the large-scale scaling are not only based on physical arguments, they also satisfy similarity of the relevant transport equations (Tang et al. Reference Tang, Antonia and Djenidi2023). However, while the Kolmogorov scaling holds for small scales, the large-scale scaling holds for the large scales. As the Reynolds number increases, the former scaling holds for increasingly larger scales, while the latter scaling holds for increasingly smaller scales; this is supported by a relatively large amount of data in the literature (see § 3 in the review paper of Tang et al. Reference Tang, Danaila, Antonia and Danaila2024). Eventually, as the Reynolds number increases to a very large, if not infinite, value, these two scalings will hold over a common range, leading to a dual scaling.
The major objective of the present paper is to extend the above analysis to the second-order scalar structure function
 $\overline {{{(\delta \theta )}^2}}$
, whose behaviour has received significant attention (e.g. Mydlarski & Warhaft Reference Mydlarski and Warhaft1998; Antonia, Zhou & Xu Reference Antonia, Zhou and Xu2000; Shraiman & Siggia Reference Shraiman and Siggia2000; Warhaft Reference Warhaft2000; Antonia & Orlandi Reference Antonia and Orlandi2002; Chassaing et al. Reference Chassaing, Antonia, Anselmet, Joly and Sarkar2002; Yeung, Xu & Sreenivasan Reference Yeung, Xu and Sreenivasan2002; Watanabe & Gotoh Reference Watanabe and Gotoh2004, Reference Watanabe and Gotoh2007; Lepore & Mydlarski Reference Lepore and Mydlarski2009; Gotoh, Watanabe & Suzuki Reference Gotoh, Watanabe and Suzuki2011; Lepore & Mydlarski Reference Lepore and Mydlarski2012; Gauding Reference Gauding2014; Gotoh & Watanabe Reference Gotoh and Watanabe2015; Briard & Gomez Reference Briard and Gomez2017; Gauding, Danaila & Varea Reference Gauding, Danaila and Varea2017; Iyer et al. Reference Iyer, Schumacher, Sreenivasan and Yeung2018; Buaria et al. Reference Buaria, Clay, Sreenivasan and Yeung2021; Shete et al. Reference Shete, Boucher, Riley and de Bruyn Kops2022; Djenidi, Antonia & Tang Reference Djenidi, Antonia and Tang2022).
We recall that the classical hypotheses of Kolmogorov (Reference Kolmogorov1941), Obukhov (Reference Obukhov1949) and Corrsin (Reference Corrsin1951), based on the forward energy cascade, predict
 \begin{equation} \overline {{{(\delta \theta )}^2}} = C_\theta r^{2/3}, \end{equation}
where
 $C_\theta$
is a constant. However, because of the tenuous support for (1.5), the departure of the scaling exponent from
 $2/3$
was attributed to the so-called ‘internal intermittency’ effect (Kolmogorov Reference Kolmogorov1962; Obukhov Reference Obukhov1962; Sreenivasan & Antonia Reference Sreenivasan and Antonia1997; Warhaft Reference Warhaft2000). Equation (1.5) was replaced by
 \begin{equation} \overline {{{(\delta \theta )}^2}} \sim r^{\zeta _2}, \end{equation}
where
 $\zeta _2$
is smaller than
 $2/3$
(e.g. Antonia et al. Reference Antonia, Hopfinger, Gagne and Anselmet1984; Mydlarski & Warhaft Reference Mydlarski and Warhaft1998; Warhaft Reference Warhaft2000; Watanabe & Gotoh Reference Watanabe and Gotoh2007; Lepore & Mydlarski Reference Lepore and Mydlarski2009; Gotoh et al. Reference Gotoh, Watanabe and Suzuki2011; Lepore & Mydlarski Reference Lepore and Mydlarski2012; Gotoh & Watanabe Reference Gotoh and Watanabe2015; Iyer et al. Reference Iyer, Schumacher, Sreenivasan and Yeung2018; Buaria et al. Reference Buaria, Clay, Sreenivasan and Yeung2021). We should stress that, like (1.2), both (1.5) and (1.6) require the Reynolds and Péclet numbers to be very large, which is not achievable in either experiments or direct numerical simulations (DNS) where
 $Re_\lambda$
very seldom exceeds
 $10^3$
. Therefore, the finite Reynolds number effect needs to be carefully assessed before drawing any definitive conclusions regarding the validity of (1.5) or (1.6).
In this paper, we test the dual scaling of
 $\overline {{{(\delta \theta )}^2}}$
in the context of the transport equation for
 $\overline {{(\delta \theta )}^2}$
and DNS data over a relatively wide range of
 $Re_\lambda$
and a Schmidt number of order 1, in statistically stationary homogeneous isotropic turbulence with a uniform mean scalar gradient, with a view to examine the constraints imposed by the dual scaling approach on the behaviour of
 $\overline {{{(\delta \theta )}^2}}$
as
 $Re_\lambda \to \infty$
, and the finite Reynolds number effect on the behaviour of
 $\overline {{{(\delta \theta )}^2}}$
. The reasons why we focus on this flow for a Schmidt number of order 1 are as follows. (i) The transport equation for
 $\overline {{{(\delta \theta )}^2}}$
has been derived and tested by Danaila & Mydlarski (Reference Danaila and Mydlarski2001). (ii) The distributions of
 $\overline {{{(\delta \theta )}^2}}$
– or equivalently the scalar spectra – have been reported in several publications (e.g. Yeung et al. Reference Yeung, Xu and Sreenivasan2002; Gotoh et al. Reference Gotoh, Watanabe and Suzuki2011; Gauding Reference Gauding2014; Gotoh & Watanabe Reference Gotoh and Watanabe2015; Gauding et al. Reference Gauding, Danaila and Varea2017; Shete et al. Reference Shete, Boucher, Riley and de Bruyn Kops2022), and values of
 $Re_\lambda$
as large as 800. (iii) It is well established that a mean scalar gradient induces anisotropy in the scalar field along the direction of the gradient, as evidenced by third-order statistics such as the skewness of scalar structure function and the skewness of the scalar derivative (see e.g. figures 11(b) and 14 of Yeung et al. Reference Yeung, Xu and Sreenivasan2002). In contrast, second-order statistics, which are the focus of the present paper, appear to be less sensitive to local anisotropy, thus do not exhibit significant deviations from local isotropy (Yeung et al. Reference Yeung, Xu and Sreenivasan2002).
The structure of the paper is as follows. In § 2, we examine the dual scaling in the context of the transport equation for
 $\overline {{{(\delta \theta )}^2}}$
in statistically stationary homogeneous isotropic turbulence with a uniform mean scalar gradient. In § 3, we test the dual scaling, using published DNS data, and examine the constraints imposed by the dual scaling approach in the context of the finite Reynolds number effect on the behaviour of
 $\overline {{{(\delta \theta )}^2}}$
, as well as the behaviour of
 $\overline {{{(\delta \theta )}^2}}$
as
 $Re_\lambda \to \infty$
. Conclusions are given in § 4.
2. Dual scaling for the transport equation for
 $\overline {{{(\delta \theta )}^2}}$

The transport equation for
 $\overline {{{(\delta \theta )}^2}}$
in statistically stationary homogeneous isotropic turbulence under a uniform mean scalar gradient in the
 $x$
direction (
 ${{\partial \Theta }}/{{\partial {x}}}$
) is given by (Danaila & Mydlarski Reference Danaila and Mydlarski2001)
 \begin{equation} -\frac {2\,{{\rm d}\Theta /{\rm d} x}}{{{r^2}}}\int _0^r {s^2}\,\overline { \delta \theta\, \delta u}{\rm d}s - \overline {\delta u\,{{(\delta \theta )}^2}} + 2\kappa \frac {\partial }{{\partial r}}\overline {{{(\delta \theta )}^2}} = \frac {4}{3}{\overline \varepsilon _\theta }r, \end{equation}
where
 $s$
is a dummy variable. The second and third terms on the left-hand side of (2.1) represent the scalar variance transfer and molecular diffusion, respectively. The first term is a production term due to the mean temperature gradient.
We first examine the scaling based on
 $\theta _B$
,
 $u_K$
and
 $\eta$
. When the effect of the production term, i.e. the first term in (2.1), is neglected, the similarity of (2.1) is readily satisfied by
 \begin{align}&\,\,\, \frac {{\overline {{{(\delta \theta )}^2}} }}{{\theta _B^2}} = f_1\left ( {\frac {r}{{{\eta }}}} \right ), \end{align}
 \begin{align}& \frac {{\overline {{{\delta u\,{(\delta \theta )}^2}}} }}{{u_K \theta _B^2}} = g_1\left ( {\frac {r}{{{\eta }}}} \right ), \end{align}
when the
 $\theta _B$
,
 $u_K$
,
 $\eta$
scaling applies. This was discussed in Lemay, Djenidi & Antonia (Reference Lemay, Djenidi and Antonia2020) (see also Djenidi et al. Reference Djenidi, Antonia and Tang2022). Equation (2.1) can be rewritten as
 \begin{eqnarray} \frac {4}{3}\frac {r}{{{\eta }}} = \frac {{2\kappa \theta _B^2}}{{\overline \varepsilon _\theta \eta ^2}}\,f'_1\left ( {\frac {r}{{{\eta }}}} \right ) - \frac {{u_K\theta _B^2}}{{\overline \varepsilon _\theta {\eta }}}\,g_1\left ( {\frac {r}{{{\eta }}}} \right ) \end{eqnarray}
(here, the prime signifies a derivative with respect to
 $r/\eta$
), so that
 $ {{\kappa \theta _B^2}}/{{\overline \varepsilon _\theta \eta ^2}}$
and
 ${{u_K\theta _B^2}}/{{\overline \varepsilon _\theta {\eta }}}$
(or
 ${{u_K\theta _B^2}}/{{\overline \varepsilon _\theta {\eta }}}$
and
 ${{u_K}/{\eta }}{Sc\,\nu }$
) are constants when
 $Sc\approx 1$
. The scaling based on
 $\theta _B$
,
 $u_K$
and
 $\eta$
is a possible solution since
 \begin{eqnarray} \frac {{\kappa \theta _B^2}}{{\overline \varepsilon _\theta \eta ^2}}=1 \quad \text{and} \quad \frac {{u_K}{\eta }}{Sc\nu }=\frac {1}{Sc}. \end{eqnarray}
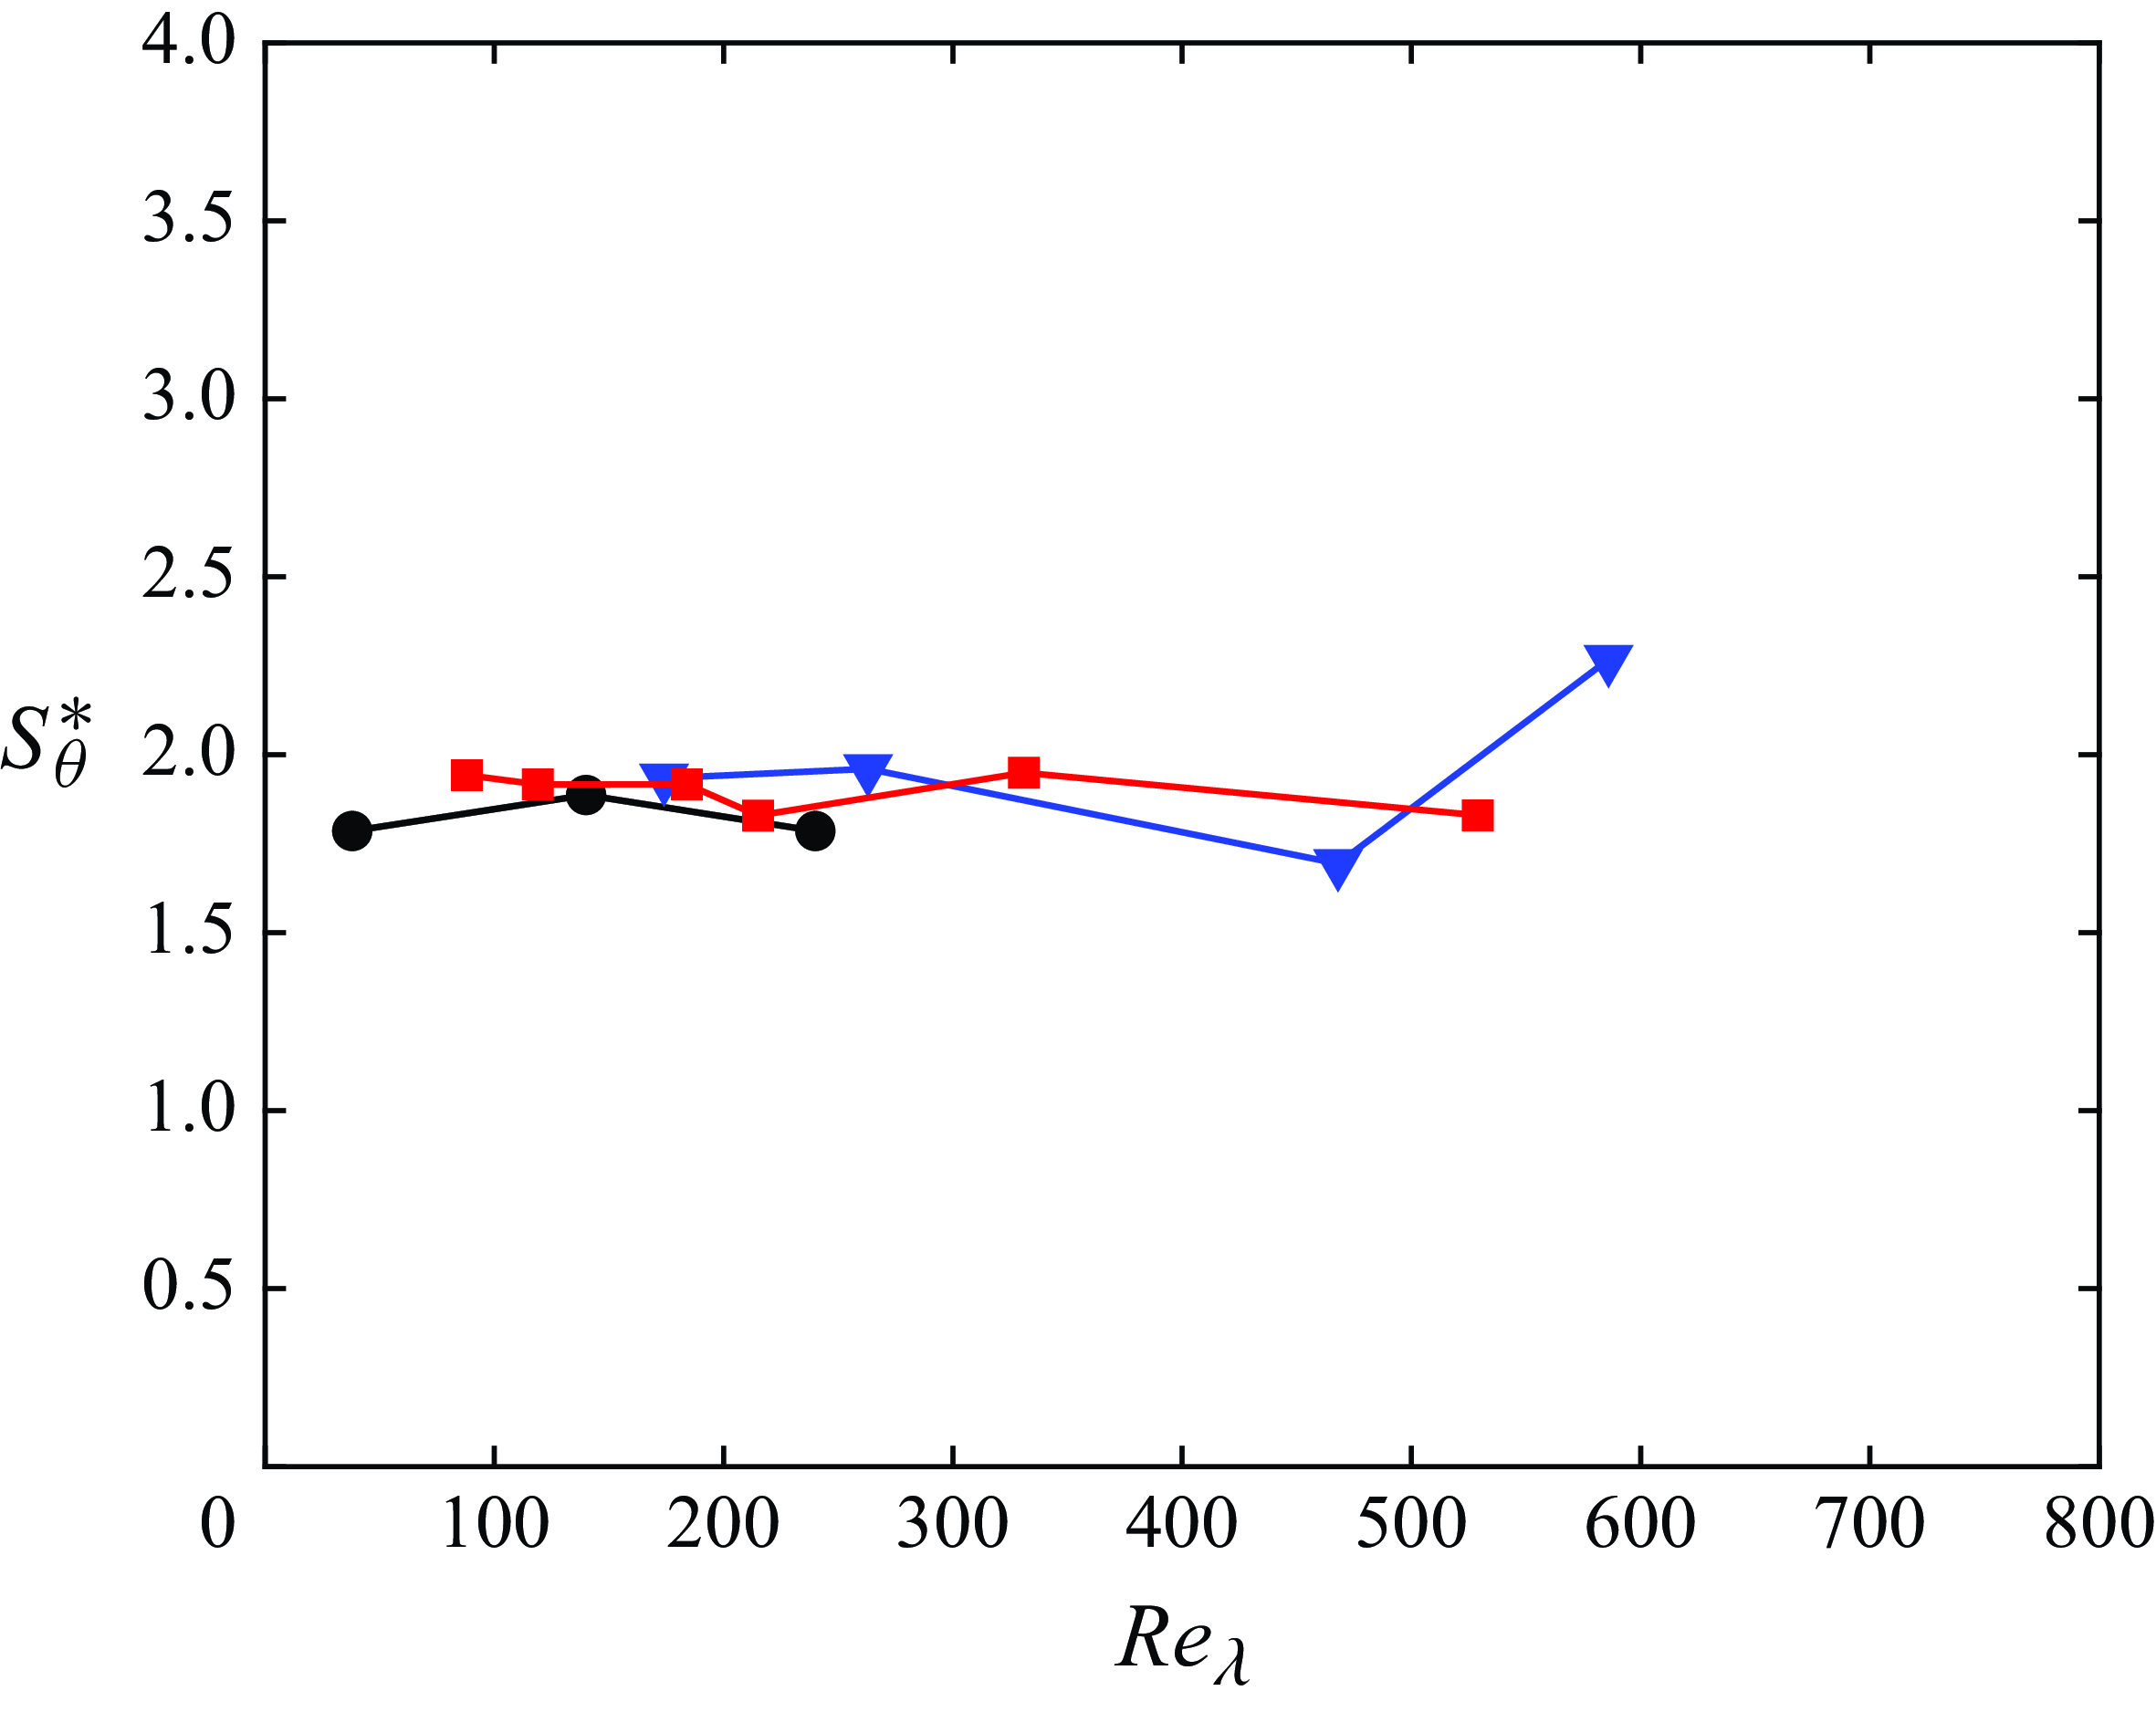
Dependence of
 $S^*_\theta$
on
 $Re_\lambda$
in the stationary homogeneous isotropic turbulence with a uniform mean scalar gradient at
 $Sc=1$
; they are estimated from the DNS data of Yeung et al. (Reference Yeung, Xu and Sreenivasan2002) (circles), Gotoh & Watanabe (Reference Gotoh and Watanabe2012) (triangles) and Gauding (Reference Gauding2014) (squares).

We next examine the scaling based on
 $\theta '$
,
 $u'$
and
 $L$
. When the production term, i.e. the first term in (2.1), is retained and the molecular diffusion term in (2.1) is neglected, one can show that the similarity of (2.1) is satisfied by
 \begin{align}&\,\,\, \frac {{\overline {{{(\delta \theta )}^2}} }}{\overline {\theta ^2}}= f_2\left ( {\frac {r}{{{L}}}} \right ), \end{align}
 \begin{align}& \frac {{\overline {{{\delta u\,{(\delta \theta )}^2}}} }}{{\overline {u^2}^{1/2}\, \overline {\theta ^2}}} = g_2\left ( {\frac {r}{{{L}}}} \right ), \end{align}
when the
 $\theta '$
,
 $u'$
,
 $L$
scaling applies. Indeed, under this scaling, (2.1) can be rewritten as
 \begin{eqnarray} \frac {4}{3}\frac {r}{{{L}}} = - \frac {{\overline {u^2}^{1/2}\, \overline {\theta ^2}}}{{\overline \varepsilon {L}}}\,g_2\left ( {\frac {r}{{{L}}}} \right ) -\frac {2S_\theta }{{{(r/L)^2}}}\int _0^{r/L} {(s/L)^2}\frac {\overline { \delta \theta\, \delta u}}{\overline {u^2}^{1/2}\, \overline {\theta ^2}^{1/2}}\, {\rm d}(s/L), \end{eqnarray}
where
 $S_\theta = {{{{\overline {{\theta ^2}} }^{1/2}}\,{{\overline {u^2} }^{1/2}}({{{{\rm d}\Theta }}/{{{\rm d}{x}}}}}})/{{{{\bar \varepsilon }_\theta }}}$
is the non-dimensional scalar gradient. Since the coefficient of the left-hand side term of (2.8) is constant, the coefficients of the first and second terms on the right-hand side must also be constant for similarity to be satisfied. Data of Yeung et al. (Reference Yeung, Xu and Sreenivasan2002), Gotoh & Watanabe (Reference Gotoh and Watanabe2012) and Gauding (Reference Gauding2014) (see figure 1) were used to estimate these two coefficients. We found that the first coefficient
 $C_{\varepsilon \theta }^{-1}$
, where
 $C_{\varepsilon \theta }= {{\overline \varepsilon {L}} }/{{\overline {u^2}^{1/2}\, \overline {\theta ^2}}}$
, is approximately constant when
 $Re_\lambda \gt 100$
and
 $Sc\approx 1$
(e.g. Donzis et al. Reference Donzis, Sreenivasan and Yeung2005; Buaria et al. Reference Buaria, Clay, Sreenivasan and Yeung2021). The second coefficient
 $S_\theta$
is also constant, with value approximately 2.
The above considerations indicate that similarity based on
 $\theta _B$
,
 $u_K$
and
 $\eta$
can satisfy (2.1) when
 $r$
is sufficiently small. Equally, (2.1) admits a similarity solution based on
 $\theta '$
,
 $u'$
and
 $L$
when
 $r$
is sufficiently large, which shows that both
 $\overline {{{(\delta \theta )}^2}}$
and
 $\overline {{{\delta u\,{(\delta \theta )}^2}}}$
satisfy the dual scaling as
 $Re_\lambda \to \infty$
. Although not shown here, it is worth mentioning that the same conclusions can be drawn when the above dual scaling is applied to a slightly more general transport equation for
 $\overline {{{(\delta \theta )}^2}}$
, e.g. (8) of Gauding et al. (Reference Gauding, Danaila and Varea2017), than (2.1). In the next section, we will assess the validity of the dual scaling in the context of
 $\overline {{{{(\delta \theta )}^2}}}$
, and the range of
 $r/\eta$
or
 $r/L$
over which it applies.
Effect of
 $Re_{\lambda }$
on the distributions of
 $\overline {{(\delta \theta )}^2}$
in statistically stationary homogeneous isotropic turbulence with a uniform mean scalar gradient at
 $Sc=1$
, normalised by (a)
 $\theta _B$
,
 $\eta$
, and (b) (
 $\theta '$
,
 $L$
). Data are from Gauding (Reference Gauding2014) and Gauding et al. (Reference Gauding, Danaila and Varea2017).

3. Dual scaling of
$\overline {{{(\delta \theta )}^2}}$

Using the data of Gauding (Reference Gauding2014) and Gauding et al. (Reference Gauding, Danaila and Varea2017), we show in figure 2 the distributions of
 $\overline {{{(\delta \theta )}^2}}$
normalised by
 $\theta _B$
,
 $\eta$
and
 $\theta '$
,
 $L$
, respectively, in statistically stationary homogeneous isotropic turbulence with a uniform mean scalar gradient for
 $Re_\lambda$
ranging from 88 to 529, and
 $Sc=1$
. One can observe that as
 $Re_\lambda$
increases, the scaling based on
 $\theta '$
,
 $L$
extends to increasingly smaller values of
 $r/L$
, while the scaling based on
 $\theta _B$
,
 $\eta$
extends to increasingly larger values of
 $r/\eta$
. These observations suggest that both scalings should eventually overlap as
 $Re_\lambda$
increases indefinitely. It is therefore reasonable to assume that similarity solutions of the form
 \begin{align}& \frac {{\overline {{{(\delta \theta )}^2}} }}{{\theta _B^2}} = {f_1}\left ( {\frac {r}{\eta }} \right ), \end{align}
 \begin{align}& \frac {{\overline {{{(\delta \theta )}^2}} }}{{\overline {{\theta ^2}} }} = {f_2}\left ( {\frac {r}{L}} \right ), \end{align}
Local slope
 $LS={\rm d} \log (\overline {{{(\delta \theta )}^2}})/{\rm d} (\log r)$
, corresponding to the data in figure 2.

may be observed for a given
 $Sc$
and infinitely large
 $Re_\lambda$
. Figure 2 suggests that the ranges of
 $r/\eta$
and
 $r/L$
over which (3.1) and (3.2) are valid increase with increasing
 $Re_\lambda$
, with the expectation that these ranges eventually overlap over the inertial range as
 $Re_\lambda \to \infty$
. It is important to recall that that we are dealing with the same distribution of
 $\overline {{{(\delta \theta )}^2}}$
, after subjecting it to two different types of normalisation. Accordingly, matching (3.1) with (3.2) requires that
 \begin{eqnarray} \theta _B^2\,{f_1}\left ( {\frac {r}{\eta }} \right ) = \overline {{\theta ^2}}\, {f_2}\left ( {\frac {r}{L}} \right ). \end{eqnarray}
If one assumes that
 ${f_1}(r/\eta )$
exhibits a power-law form in the inertial range, namely
 \begin{eqnarray} {f_1}\left ( {\frac {r}{\eta }} \right ) =C {\left ( {\frac {r}{\eta }} \right )^\alpha }, \end{eqnarray}
where
 $C$
is a constant, then
 \begin{eqnarray} {f_2}\left ( {\frac {r}{L}} \right )=C \frac {{\theta _B^2}}{{\overline {{\theta ^2}} }}{\left ( {\frac {L}{\eta }} \right )^\alpha }{\left ( {\frac {r}{L}} \right )^\alpha } = C\frac {{{C_{\varepsilon \theta }}}}{{{C_\varepsilon }}}\frac {{{{15}^{1/2}}}}{{{{{Re} }_\lambda }}}{\left ( {\frac {{{{C_\varepsilon }\, Re} _\lambda ^{3/2}}}{{{{15}^{3/4}}}}} \right )^\alpha }{\left ( {\frac {r}{L}} \right )^\alpha }. \end{eqnarray}
To arrive at (3.5), we used
 ${{u_K^2}}/{{\overline {{u^2}} }} = {{{{15}^{1/2}}}}/{Re_\lambda }$
and
 ${L}/{\eta } = C_\varepsilon\, {Re_\lambda ^{3/2}}/{{{{15}^{3/4}}}}$
. The plots in figure 2 support the argument that (3.4) and (3.5) will eventually and simultaneously be satisfied for significant ranges of
 $r/\eta$
and
 $r/L$
. Since
 $C_\varepsilon$
and
 $C_{\varepsilon \theta }$
are approximately constant for
 $Re_\lambda \gtrsim 200$
(see the inset of figure 2
b), the collapse based on
 $\theta '$
,
 $L$
becomes more convincing for
 $Re_\lambda \gtrsim 200$
. While an overlap region has not emerged yet in the distributions of figure 2, on can expect that as
 $Re_\lambda$
continues to increase, a region of overlap between the two different normalisations will emerge. Eventually, when
 $Re_\lambda \to \infty$
, an inertial range should be established rigorously where the two sets of scales become interchangeable. It is of interest to note that the formulation (3.5), or equivalently
 \begin{eqnarray} {f_2}\left ( {\frac {r}{L}} \right )=C_1\,Re_\lambda ^{3/2\alpha - 1}{\left ( {\frac {r}{L}} \right )^\alpha }, \end{eqnarray}
where
 $C_1={15}^{1/2-3\alpha /4} C C_{\varepsilon \theta }C_{\varepsilon }^{\alpha -1}$
, is independent of
 $Re_\lambda$
when
 $3/2\alpha -1=0$
, i.e. when
 $\alpha =2/3$
, which corresponds to the Kolmogorov–Obukhov–Corrsin prediction. Although not reported here, it is easy to show that applying a plausibility analysis (see Djenidi, Antonia & Tang Reference Djenidi, Antonia and Tang2023) to both (3.5) and (3.6), one can show that
 $\alpha = 2/3$
is the only possibility that does not violate the plausibility constraints.
Figure 3 shows the corresponding local slope
 $LS={\rm d} \log (\overline {{{(\delta \theta )}^2}})/{\rm d} (\log r)$
of the distributions shown in figure 2. We can observe that there is no well-defined plateau for all the data, even at
 $Re_\lambda \sim 500$
, underlining the importance of the finite Reynolds number effect in the context of establishing the inertial range. The same feature has been observed for the velocity structure functions in grid turbulence at higher
 $Re_\lambda$
(
 $ \sim 1500$
) (e.g. Tang et al. Reference Tang, Antonia and Djenidi2023). This indicates that there is no well-established overlap region (or inertial range) for the
 $Re_\lambda$
range considered. We note, however, that the larger
 $Re_\lambda$
, the closer
 $LS$
is to
 $2/3$
at scales
 $r/\eta \sim 200$
. The same feature can be observed for the data of Gotoh et al. (Reference Gotoh, Watanabe and Suzuki2011) and Shete et al. (Reference Shete, Boucher, Riley and de Bruyn Kops2022) at comparable
 $Re_\lambda$
(
 $=174{-}633$
) and
 $Sc=1$
(figure 4).
Distributions of
 $\overline {{(\delta \theta )}^2} /\theta _B^2$
and corresponding local slope
 $LS(r/\eta )$
at
 $Sc=1$
in statistically stationary homogeneous isotropic turbulence with a uniform mean scalar gradient. These are calculated based on the spectra of Gotoh et al. (Reference Gotoh, Watanabe and Suzuki2011) (
 $Re_\lambda =174{-}468$
) and Shete et al. (Reference Shete, Boucher, Riley and de Bruyn Kops2022) (
 $Re_\lambda =633$
); note that the distribution at
 $Re_\lambda =586$
of Gotoh et al. (Reference Gotoh, Watanabe and Suzuki2011) is not shown for clarity.

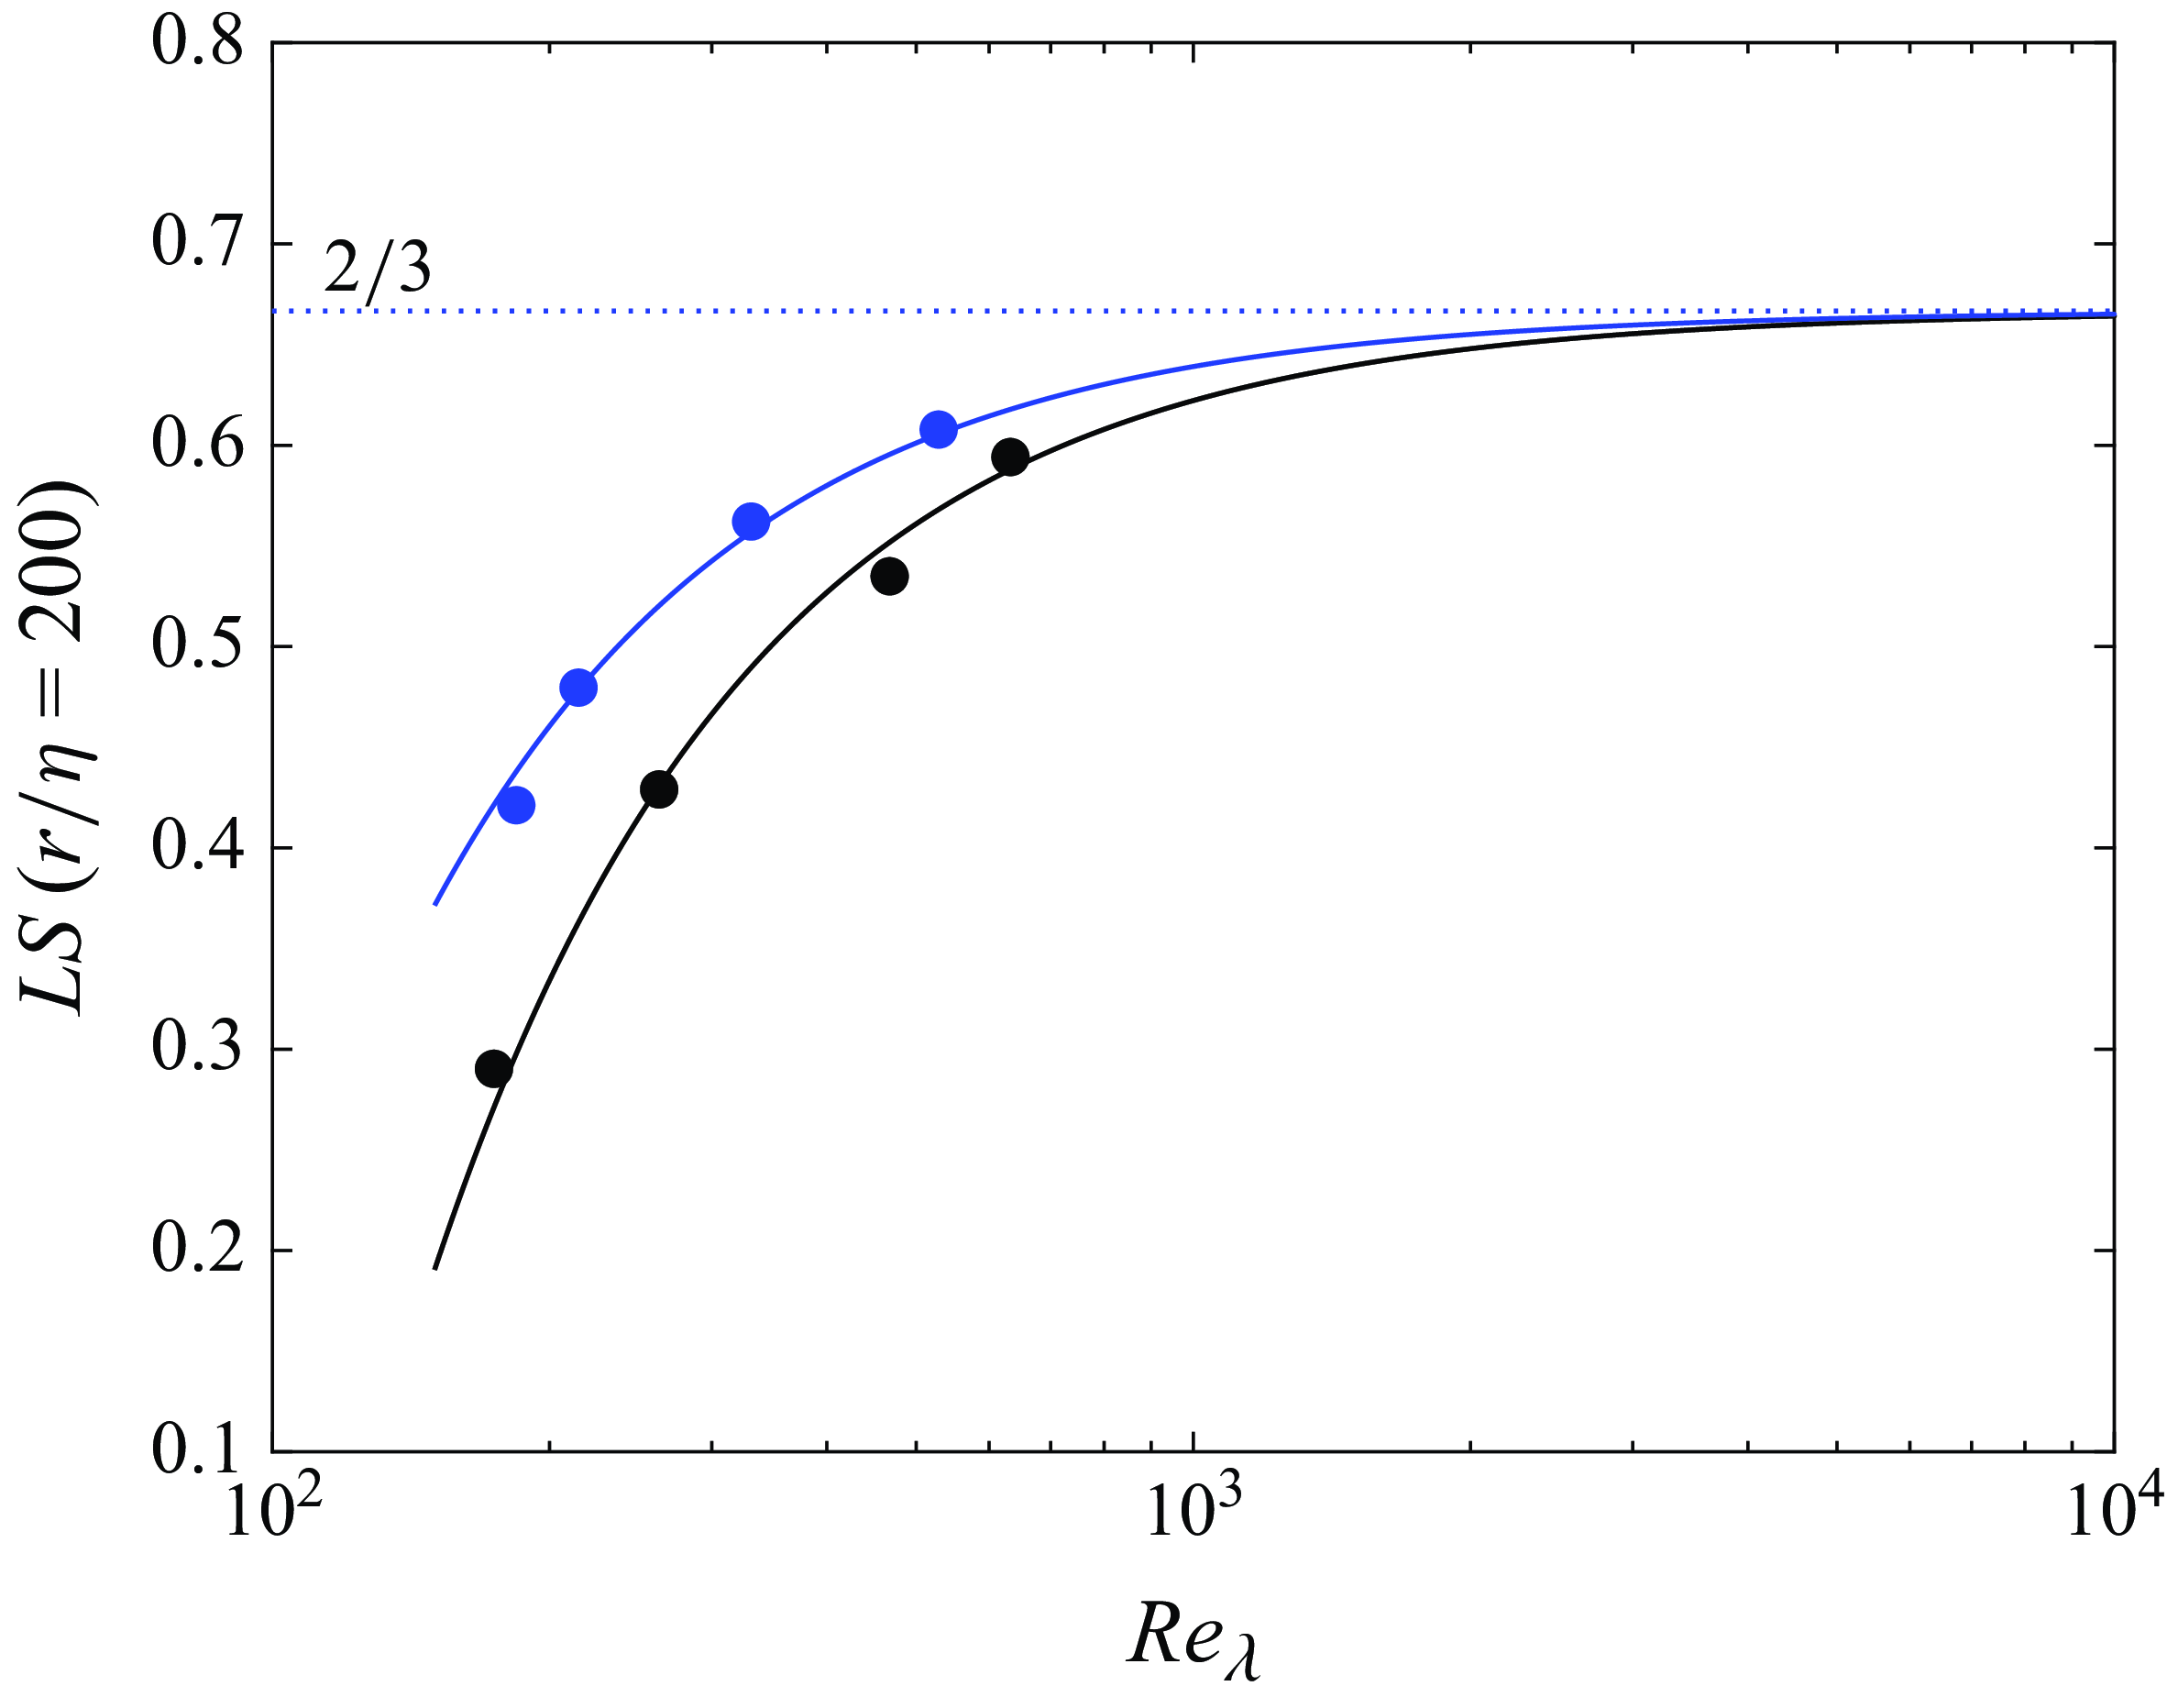
Local slope
 $LS={\rm d} \log (\overline {{{(\delta \theta )}^2}})/{\rm d} (\log r)$
at
 $r/\eta =200$
. Black and blue symbols correspond to the data in figures 4 and 3, respectively. Note that the data for only
 $Re_\lambda \gtrsim 184$
in figure 3 are shown since this range of
 $Re_\lambda$
is large enough so that the scale
 $r=200\eta$
is not close to
 $L$
. The black and blue curves are the fits to the data based on (3.7) with
 $C_2=250$
and 155, respectively. The dotted horizontal line corresponds to the value
 $2/3$
.

In order to quantify, albeit approximately, the value of
 $Re_\lambda$
required for the
 $2/3$
power law to be established, we use the following Reynolds number dependent expression of
 $LS(r/\eta )$
at
 $r/\eta =200$
:
 \begin{equation} LS(r/\eta =200)=2/3-\frac {C_2}{{Re_\lambda ^{1.25}} }. \end{equation}
The constants
 $C_2$
(250 or 155) and exponent 1.25 are selected so that (3.7) fits the data in figures 3 and 4 reasonably well, as seen in figure 5. The data at
 $Re_\lambda =88$
and 119 in figure 3 are not shown since one cannot expect to observe a scaling range at such a relatively low
 $Re_\lambda$
. One can see that at least
 $Re_\lambda \sim 10^4$
is required to reach the
 $2/3$
power-law scaling. This value of
 $Re_\lambda$
is currently beyond the reach of the experiments in the laboratory and DNS. One expects that the value should be much larger in the absence of a mean scalar gradient. Interestingly, the way the
 $2/3$
power-law scaling is approached is different for the data of Gotoh et al. (Reference Gotoh, Watanabe and Suzuki2011) and Shete et al. (Reference Shete, Boucher, Riley and de Bruyn Kops2022) (blue symbols) and those of Gauding et al. (Reference Gauding, Danaila and Varea2017) (black symbols). A possible explanation is that the large-scale forcing for velocity and/or scalar fields varies between different studies, affecting the magnitude of the last term in (2.1), leading to different behaviour of
 $\overline {{{(\delta \theta )}^2}}$
at moderate scales; this merits further investigation.
Distributions of
 $\overline {{(\delta \theta )}^2} /\theta _B^2$
and corresponding local slope
 $LS$
at
 $Sc\approx 0.7$
(blue and red curves) in statistically stationary homogeneous isotropic turbulence with a uniform mean scalar gradient. They are calculated based on the spectra of Shete et al. (Reference Shete, Boucher, Riley and de Bruyn Kops2022) (
 $Re_\lambda =633$
) and Gotoh & Watanabe (Reference Gotoh and Watanabe2015) (
 $Re_\lambda =805$
). For comparison, also shown is the distribution of Gotoh & Watanabe (Reference Gotoh and Watanabe2015) with
 $Re_\lambda =805$
in stationary box turbulence with the scalar being excited by a random external force at low wavenumbers (black curve).

We conclude this section by examining (see figure 6) the distributions of
 $\overline {{{(\delta \theta )}^2}} /\theta _B^2$
and their local slope at
 $Re_\lambda =633$
(blue curves; Shete et al. Reference Shete, Boucher, Riley and de Bruyn Kops2022) and
 $Re_\lambda =805$
(red curves; Gotoh & Watanabe Reference Gotoh and Watanabe2015), and
 $Sc=0.7$
, in stationary forced periodic box turbulence with a uniform mean scalar gradient. The increase in
 $Re_\lambda$
is reflected in the distributions
 $\overline {{{(\delta \theta )}^2}} /\theta _B^2$
as well as in the local slopes beyond the dissipative range (i.e.
 $r/\eta \gtrsim 20$
). Gotoh & Watanabe (Reference Gotoh and Watanabe2015) argue that the power-law exponent for
 $\overline {{{(\delta \theta )}^2}}$
in the range
 $80 \lesssim r/\eta \lesssim 400$
is approximately 0.642. However, they also argue that the power-law exponent for stationary box turbulence with the scalar being excited by a random external force at low wavenumbers is given by
 $0.639 +0.057\log (r/r_x)$
, where
 $r_x=70\eta$
, which led them to conclude that the ‘scaling exponents of passive scalars are not universal’. Included in figure 6 is the distribution of Gotoh & Watanabe (Reference Gotoh and Watanabe2015) at
 $Re_\lambda =805$
for stationary box turbulence with the scalar being excited by a random external force at low wavenumbers (black curve). Comparison between the distributions at the same
 $Re_\lambda =805$
shows clear differences between the cases with and without scalar gradient. The addition of a scalar gradient appears to accentuate the large-scale effects on the small scales, as illustrated on
 $LS(r/\eta )$
. This is indeed observed in figure 2 of Gotoh & Watanabe (Reference Gotoh and Watanabe2015), which shows that the contributions of the scalar gradient at
 $r/L\approx 0.145$
(
 $r/\eta \approx 200$
) are larger for the statistically stationary homogeneous isotropic turbulence with a uniform mean scalar gradient than with the scalar being excited by a random external force at low wavenumbers. Consequently, one expects the emergence of an inertial-convective range to be delayed in the former case; this is indeed observed in figure 6. Evidently, it would be desirable to further investigate the finite Reynolds number effect on the behaviour of
 $\overline {{{(\delta \theta )}^2}}$
and its local slope at moderate scales by further increasing
 $Re_\lambda$
.
4. Conclusions
A dual scaling analysis, based on the scaling sets
 $\theta _B$
,
 $u_K$
,
 $\eta$
and
 $\theta '$
,
 $u'$
,
 $L$
, was carried out in the context of the transport equation for the second-order scalar structure function
 $\overline {{(\delta \theta )}^2}$
(i.e. (2.1)) in statistically stationary homogeneous isotropic turbulence under a uniform mean scalar gradient. When the production term (or large-scale term) is neglected in the equation, the scaling
 $\theta _B$
,
 $u_K$
,
 $\eta$
is tenable; this is so because the two dimensionless parameters in the normalised equation of
 $\overline {{(\delta \theta )}^2}$
are constant for a given
 $Sc$
(see (2.5)). Also, when the molecular diffusion term is neglected, the scaling
 $\theta '$
,
 $u'$
,
 $L$
is also tenable since both the non-dimensional scalar gradient
 $S_\theta$
and the non-dimensional scalar dissipation rate
 $C_{\varepsilon \theta }$
are constant when the Taylor microscale Reynolds number is
 $Re_\lambda \gtrsim 200$
. Further, since (2.1) is a relation between
 $\overline {{{{(\delta \theta )}^2}}}$
and
 $\overline {{{\delta u\,{(\delta \theta )}^2}}}$
, the dual scaling that applies to
 $\overline {{(\delta \theta )}^2}$
also applies to
 $\overline {{{\delta u\,{(\delta \theta )}^2}}}$
. Note that it is well accepted that
 $\overline {{{\delta u\,{(\delta \theta )}^2}}}$
satisfies the dual scaling as
 $Re_\lambda \to \infty$
. The dual scaling of
 $\overline {{{{(\delta \theta )}^2}}}$
was tested using DNS data over a wide range of
 $Re_\lambda$
with Schmidt number of order 1. It is found that the scaling based on
 $\theta '$
,
 $L$
extends to increasingly smaller values of
 $r/L$
, while the scaling based on
 $\theta _B$
,
 $\eta$
extends to increasingly larger values of
 $r/\eta$
as
 $Re_\lambda$
increases. More importantly, the inference from these observations is that as
 $Re_\lambda$
increases further, both scalings should eventually overlap and conform with the power-law relation
 $\overline {{(\delta \theta )}^2} \sim r^{2/3}$
in the overlap region as
 $Re_\lambda \to \infty$
. An empirical model for the local slope of
 $\overline {{(\delta \theta )}^2}$
at
 $r=200\eta$
shows that values of
 $Re_\lambda$
of order
 $10^4$
are required for the initial emergence of the
 $2/3$
power-law scaling.
Evidently, the trend exhibited by the data shows that a dual scaling leads to the power-law relation
 $\overline {{(\delta \theta )}^2} \sim r^{2/3}$
in the overlap region as
 $Re_\lambda \to \infty$
. The data also show that the local slope of
 $\overline {{(\delta \theta )}^2}$
(i.e.
 $\zeta _2$
) increases systematically with
 $Re_\lambda$
at moderate scales (figures 3–6) and exhibit a trend towards
 $2/3$
. These observations lead us to argue that the trend shown by the DNS data is consistent with the similarity hypotheses of Kolmogorov (Reference Kolmogorov1941), Obukhov (Reference Obukhov1949) and Corrsin (Reference Corrsin1951), but in contradiction with the modified similarity hypotheses of Kolmogorov (Reference Kolmogorov1962) and Obukhov (Reference Obukhov1962). In other words, even though one cannot definitively test the above similarity hypotheses at an infinite Reynolds number, our results suggest that the similarity hypotheses of Kolmogorov (Reference Kolmogorov1941), Obukhov (Reference Obukhov1949) and Corrsin (Reference Corrsin1951) may well be appropriate when the Reynolds number is very large. Since the Reynolds number is finite for all turbulent flowsthat we are likely to encounter, the finite Reynolds number effect cannot be ignored.
Finally, we should also draw attention to the limitations of the present work. Although both the similarity hypotheses of Kolmogorov (Reference Kolmogorov1941), Obukhov (Reference Obukhov1949) and Corrsin (Reference Corrsin1951), and the modified similarity hypotheses of Kolmogorov (Reference Kolmogorov1962) and Obukhov (Reference Obukhov1962), have received significant attention in the literature, they are both phenomenological, and a rigorous proof of their predictions is not yet available. We concede that in some mixing situations, e.g. when more than one chemical species is present in significant mass fractions, the assumption of Fickian diffusion may not be adequate. We should also stress that the present results apply only for a Schmidt/Prandtl number of order 1, thus the cases
 $Sc\ll 1$
and
 $Sc\gg 1$
need to be investigated in the future.
Funding
This research was supported by the Guangdong Basic and Applied Basic Research Foundation (project no. 2023B1515020069), Shenzhen Science and Technology Program (project nos RCYX20210706092046085 and GXWD20220817171516009) and Fundamental Research Funds for the Central Universities (project no. HIT.OCEF.2024016).
Declaration of interests
The authors report no conflict of interest.