

Introduction
Political economy scholars have long touted the benefits of economic specialization. Adam Smith's famous example of a pin factory highlights this important concept, whereby each worker focuses on a single task needed to manufacture a pin rather than making an entire pin from start to finish. When workers specialize on individual pin-making tasks and coordinate their activities, Smith argues, the factory's production of pins can be much higher.Footnote 1 The benefits of specialization are thought to extend to entire economies. In 1817, David Ricardo wrote that countries should specialize in areas of the economy in which they have a comparative advantage, and trade the output from this sector for goods which they cannot easily produce.Footnote 2 More than two hundred years later, scholars are still exploring how economic specialization affects economic growth at various stages of a nation's development.Footnote 3
But there can be downsides of economic specialization. For instance, Smith argued that increasing economic specialization, for all its merits, would result in an ignorant population desperately in need of education.Footnote 4 Today, writings on the “resource curse” hold that countries specializing in oil production are likely to experience uneven economic development, autocratic governments, and civil conflict.Footnote 5 Many would highlight decaying cities in the Rust Belt of the United States as a key example of how economic specialization can go awry.
Our paper posits that highly specialized economies—that is, when a particular sector dominates a region's economy—should exhibit different patterns of government spending on public goods as compared to more diverse economies. Specifically, politicians in regions with high levels of economic specialization should favor spending on core economic sectors at the expense of public goods, such as investments in human capital.Footnote 6 This is because highly specialized economies should produce a symbiotic alignment of core sectors’ interests with the interests of non-core workers. This symbiotic alignment of interests puts pressure on politicians to spend scarce governmental resources on subsidies for core sectors rather than providing public goods that benefit the regional economy as a whole. Economically diverse regions, however, do not produce this same alignment of interests between core and non-core sectors. Consequently, the interests of non-core workers are more supportive of the government providing public goods rather than subsidies to core sectors.
To investigate our hypothesis, we examine the relationship between economic specialization, education expenditures, and subsidies in two countries: the United States and India. We start by examining U.S. states. We find that highly specialized U.S. states spend a smaller share of the government's budget on education and a larger share on industrial subsidies. Next, we explore the implications of an immediate shock in economic specialization that occurred at the state-level in India. In November 2000, the Indian government bifurcated a large, economically diverse state, Undivided Bihar, into two smaller, highly specialized states, Bihar and Jharkhand. We examine the effect of the bifurcation on state education spending and sectoral subsidies. We find a substantial decrease in education spending and an increase in subsidies to core sectors. In order to help rule out the influence of other plausible factors, we compare Bihar and Jharkhand to other Indian states bifurcated in the same year.
Our paper proceeds as follows. First, we briefly discuss the writings on economic specialization and public goods provision. Second, we present a hypothesis about the effects of economic specialization on subsidies for core sectors and public goods provision. Third, we examine the evidence from the United States. Fourth, we examine education spending and subsidies in Indian states that experienced a shock in their level of economic specialization. The final section concludes and discusses the contributions of our findings.
Economic specialization and public goods
At the outset, it is important to define the concept of economic specialization. In essence, economic specialization assesses the extent to which a particular sector dominates a region's economy. This needs to be distinguished from a seemingly-related concept: economic concentration. Economic concentration assesses the extent to which firms are geographically clustered within a region. Although economic specialization and concentration are sometimes treated as the same, they are not synonymous. For example, industry X might only be located in state Y, but state Y might also have many other industries that balance out the economy. Therefore, while state Y would have a high concentration of industry X, it would still be economically diverse. Conversely, it is possible for industry Z to be spread out across many states, but if state Y has few other economic activities and industry Z dominates state Y's economy, then state Y would be highly specialized. It also should be noted that economic specialization and concentration are treated differently in policy debates. Whereas increasing specialization is often seen as “good” from an economic growth standpoint, increasing concentration is seen as “bad” because it is associated with greater regional inequality.Footnote 7
Although scholars have long theorized about the effect of increasing economic specialization on the government's role in public goods provision,Footnote 8 there is very little empirical work on the subject. Whereas the public goods literature centers on important determinants, such as institutions,Footnote 9 electoral cycles,Footnote 10 social fragmentation,Footnote 11 and civil society,Footnote 12 the writings on economic specialization tend to focus on how it impacts economic growth, private investment, innovation, and trade patterns.Footnote 13 To our knowledge, there is no empirical study that seeks to evaluate the relationship between economic specialization and governmental public goods provision, whether cross-nationally or within a single country over time.
That said, there is a considerable amount of work on the patterns of public goods provision in the most economically specialized states in the world today: oil- and mineral-rich states. The research on “rentier states” often posits that a natural resource windfall leads a government to make large investments in public goods such as education, health, and infrastructure, all of which can help a leader buy off the citizenry and rule as an autocrat.Footnote 14 Yet, cross-national and subnational quantitative work on the link between natural resources and public goods yields inconsistent results. For instance, while some observe a negative relationship between natural resources and education spendingFootnote 15 other studies of autocratic resource-rich states find mixed results with regards to social spending.Footnote 16 Although democratic resource-rich states have received less scholarly attention, current findings suggest a positive link with public goods. Subnational analyses in countries as diverse as Indonesia and the United States observe a positive effect of resource wealth on various areas of social spending.Footnote 17
Other research suggests a vague or indirect effect of economic specialization on public goods provision. Economic specialization is found to influence the size of trade union membershipFootnote 18 and support for the left,Footnote 19 which logically can shape the preferences of certain citizens about public goods. Some demonstrate that high economic specialization is linked with a decrease in civic participation, including voting,Footnote 20 and this may affect the extent to which citizens are able to voice their concerns about public goods. Economic specialization is sometimes tied to economic and political inequality.Footnote 21 In societies where inequality is high, politicians may be less willing to provide public goods because they can sustain and empower social groups who ultimately challenge the state.Footnote 22
Thus, while the topic of economic specialization has long interested scholars, we do not know if it has a systematic relationship with a government's commitment to public goods. The causal mechanism that explains such a relationship, for that matter, is unclear. Our paper argues that firms and voters in highly specialized economies should have symbiotic preferences that in turn shape a government's spending priorities about firm subsidies and key public goods. Next, we outline the logic of this argument and then turn to the empirical evidence.
Hypothesis
We hypothesize that regions with a high level of economic specialization will provide more benefits to their core economic sectors (the sectors that are economically dominant in a particular region) in lieu of spending on public goods. However, we break with the existing literature which assumes that a government's increased support for core economic sectors is entirely due to the influence of a powerful industrial lobby or unscrupulous politicians. Although these forces can surely play a role, we argue that the electoral pressures of citizens living in highly specialized regions are equally important. In effect, industry as well as voters in a highly specialized economy should have aligned interests about the optimal level of government spending on subsidies and public goods.Footnote 23
When a region's economy is highly specialized, we argue that their government will shift spending towards core sector firms at the expense of public goods due to the alignment of interests among core sector firms and voters. The interests of core sector firms are simple: They desire preferential policy, subsidies, cheap credit, regulatory protection, procurement contracts, etc., to give themselves advantages over their competitors and secure future monetary gains. With fewer competitors, core sector firms in highly specialized economies should be able to leverage their clout to get increased benefits from the government.Footnote 24 The political economy literature refers to this as “rent-seeking behavior,” which is demonstrated to provide substantial advantages to firms who engage in it successfully.Footnote 25
Alongside rent-seeking core sector firms, we posit that highly specialized economies will exhibit greater electoral pressures on the government to shift its spending priorities towards core sectors and away from public goods. Building on work in economic geography by Pred (Reference Pred1966), we assume that citizens in a highly specialized economy are employed in one of two broad sectors: core sectors or non-core sectors. Core sectors export their product to locations outside the geographic area in which it is produced (acting as a Keynesian multiplier for the local economy), while non-core sectors are reliant on local income created by core sectors. The non-core sector workers are the restaurant employees, auto mechanics, teachers, etc. that provide goods and services to the people in the region, many of whom receive an income directly from core sectors. From an electoral standpoint, however, non-core workers are a much larger group than core workers in the vast majority of economies.
Since non-core workers benefit from core sectors’ spillover into the local economy, their preferences about government spending will be influenced by the level of economic specialization in the region. In highly diverse economies, where non-core workers benefit from several industries, non-core workers should not favor any particular economic sector. In highly specialized economies, however, core and non-core workers should have symbiotic preferences about government spending and believe that what is good for core sectors is also good for non-core workers. In effect, non-core workers view core sector subsidies as an “insurance mechanism”: when there are a small number of core industries that non-core workers’ livelihoods depend upon, they will be more willing to fund them. However, if non-core workers’ livelihoods depend upon many different core sectors with uncorrelated risk profiles, it makes little sense to hedge risk by helping a core sector directly, since the non-core worker has many other sectors as a backup. For this reason, we expect non-core workers to align with core sectors when the economy is specialized rather than diverse.
This alignment of core and non-core workers’ interests in a highly specialized economy means that government funds, which could be utilized for investing broadly in public goods and services, are more likely to be diverted towards benefits for core sector firms.Footnote 26 This should disproportionately affect goods and services whose impact on a local economy is broad-reaching and long-term, such as investments in human capital. Consequently, our theoretical expectation is that highly specialized economies will witness more benefits to core sector firms and less spending on public goods.Footnote 27
It is additionally important to note that our hypothesis is not about the amount but rather the proportion of government spending on public goods. To be sure, economically specialized regions may be richer than more diverse regions and therefore spend more money on public goods in absolute terms. Our hypothesis is that governments of highly specialized regions should have fundamentally different spending priorities than more diverse regions. Therefore, the proper counterfactual for our argument is to look at regions of equal wealth, but with different economic compositions, and see if their spending priorities differ in regard to public goods. We posit that governments of highly specialized regions will spend less of their budget on public goods than more economically diverse ones at the same income level.
We investigate our hypothesis in two different contexts: the United States and India. These countries were selected for two main reasons. For one, the need for broadly comparable, time-series data on our key variables of interest requires us to select countries that have extensive data collection practices. Second, the unique history of India provides us with a rare opportunity to examine the effect of a shock in the level of economic specialization.Footnote 28
We start by examining state-level data in the United States. We then turn to India and focus on the bifurcation of Undivided Bihar, an economically diverse state that was split into two highly specialized states, Bihar and Jharkhand. In both the U.S. and Indian contexts, we find evidence that a high level of economic specialization is related to less spending towards education and more spending towards core economic sectors.
Economic specialization in the United States
The United States provides an excellent place to explore our hypothesis for two reasons. First, each state autonomously sets its own budgetary expenditures, which are highly responsive to the public's will. Second, the United States is one of the only places in the world with detailed subnational data on economic specialization and public goods expenditures dating back to the 1960s. We focus on the share of the government's budget committed to education, which allows us to capture a government's effort towards education relative to other important areas of the budget.
As a measure of the economic specialization of U.S. states, we construct an Herfindahl-Hirschman Index (HHI) of the core economic activity of the area using state-level economic data from the U.S. Bureau of Economic Analysis. In order to capture only the relevant specialization of the economy—and not economic activity located in service or non-core sectors—we create an HHI index that only looks at core sectors.Footnote 29 For our statistical models, we run OLS regressions with both fixed and random effects and robust standard errors clustered at the state-level. The dependent variable is the percentage of a state's budget spent on education in a given year and the main independent variable is its HHI in a given year.Footnote 30
We control for several variables that influence education spending. We control for the percentage of the state that is under the age of nineteen and over the age of sixty-five, per the findings in Poterba (Reference Poterba1997) and Levy (Reference Levy2005). Controlling for a state's share of individuals over the age of sixty-five is important because this group receives less direct benefits from education spending and therefore tends to have lower support for it.Footnote 31 We include a control for the average state income in order to account for the argument that richer polities will demand more public goods than poorer ones.Footnote 32 We include a measure of unemployment given that struggling economies might spend less on public goods. Since spending on education, or public goods writ large, might be more efficient the larger the polity,Footnote 33 we include a measure of total population and population density. Finally, ethnic heterogeneity has been found to decrease public goods,Footnote 34 and therefore we control for the percentage of the population that is non-white.
We also control for variables that could serve as alternate pathways to explaining a trade-off between subsidies and education spending. Controlling for unionization rates is important because unions have an influence on subsidies and could affect, per our hypothesis, how much is spent on public goods like education. Partisan differences may influence the attention given to public goods and the extent to which politicians privilege the business lobby.Footnote 35 Consequently, we include the percentage vote share for the Democratic candidate in the previous presidential election. A control for core sector GDP is also included because it is plausible that the overall size of core sectors is just as important as how they contribute to the level of economic specialization.
U.S. states’ results
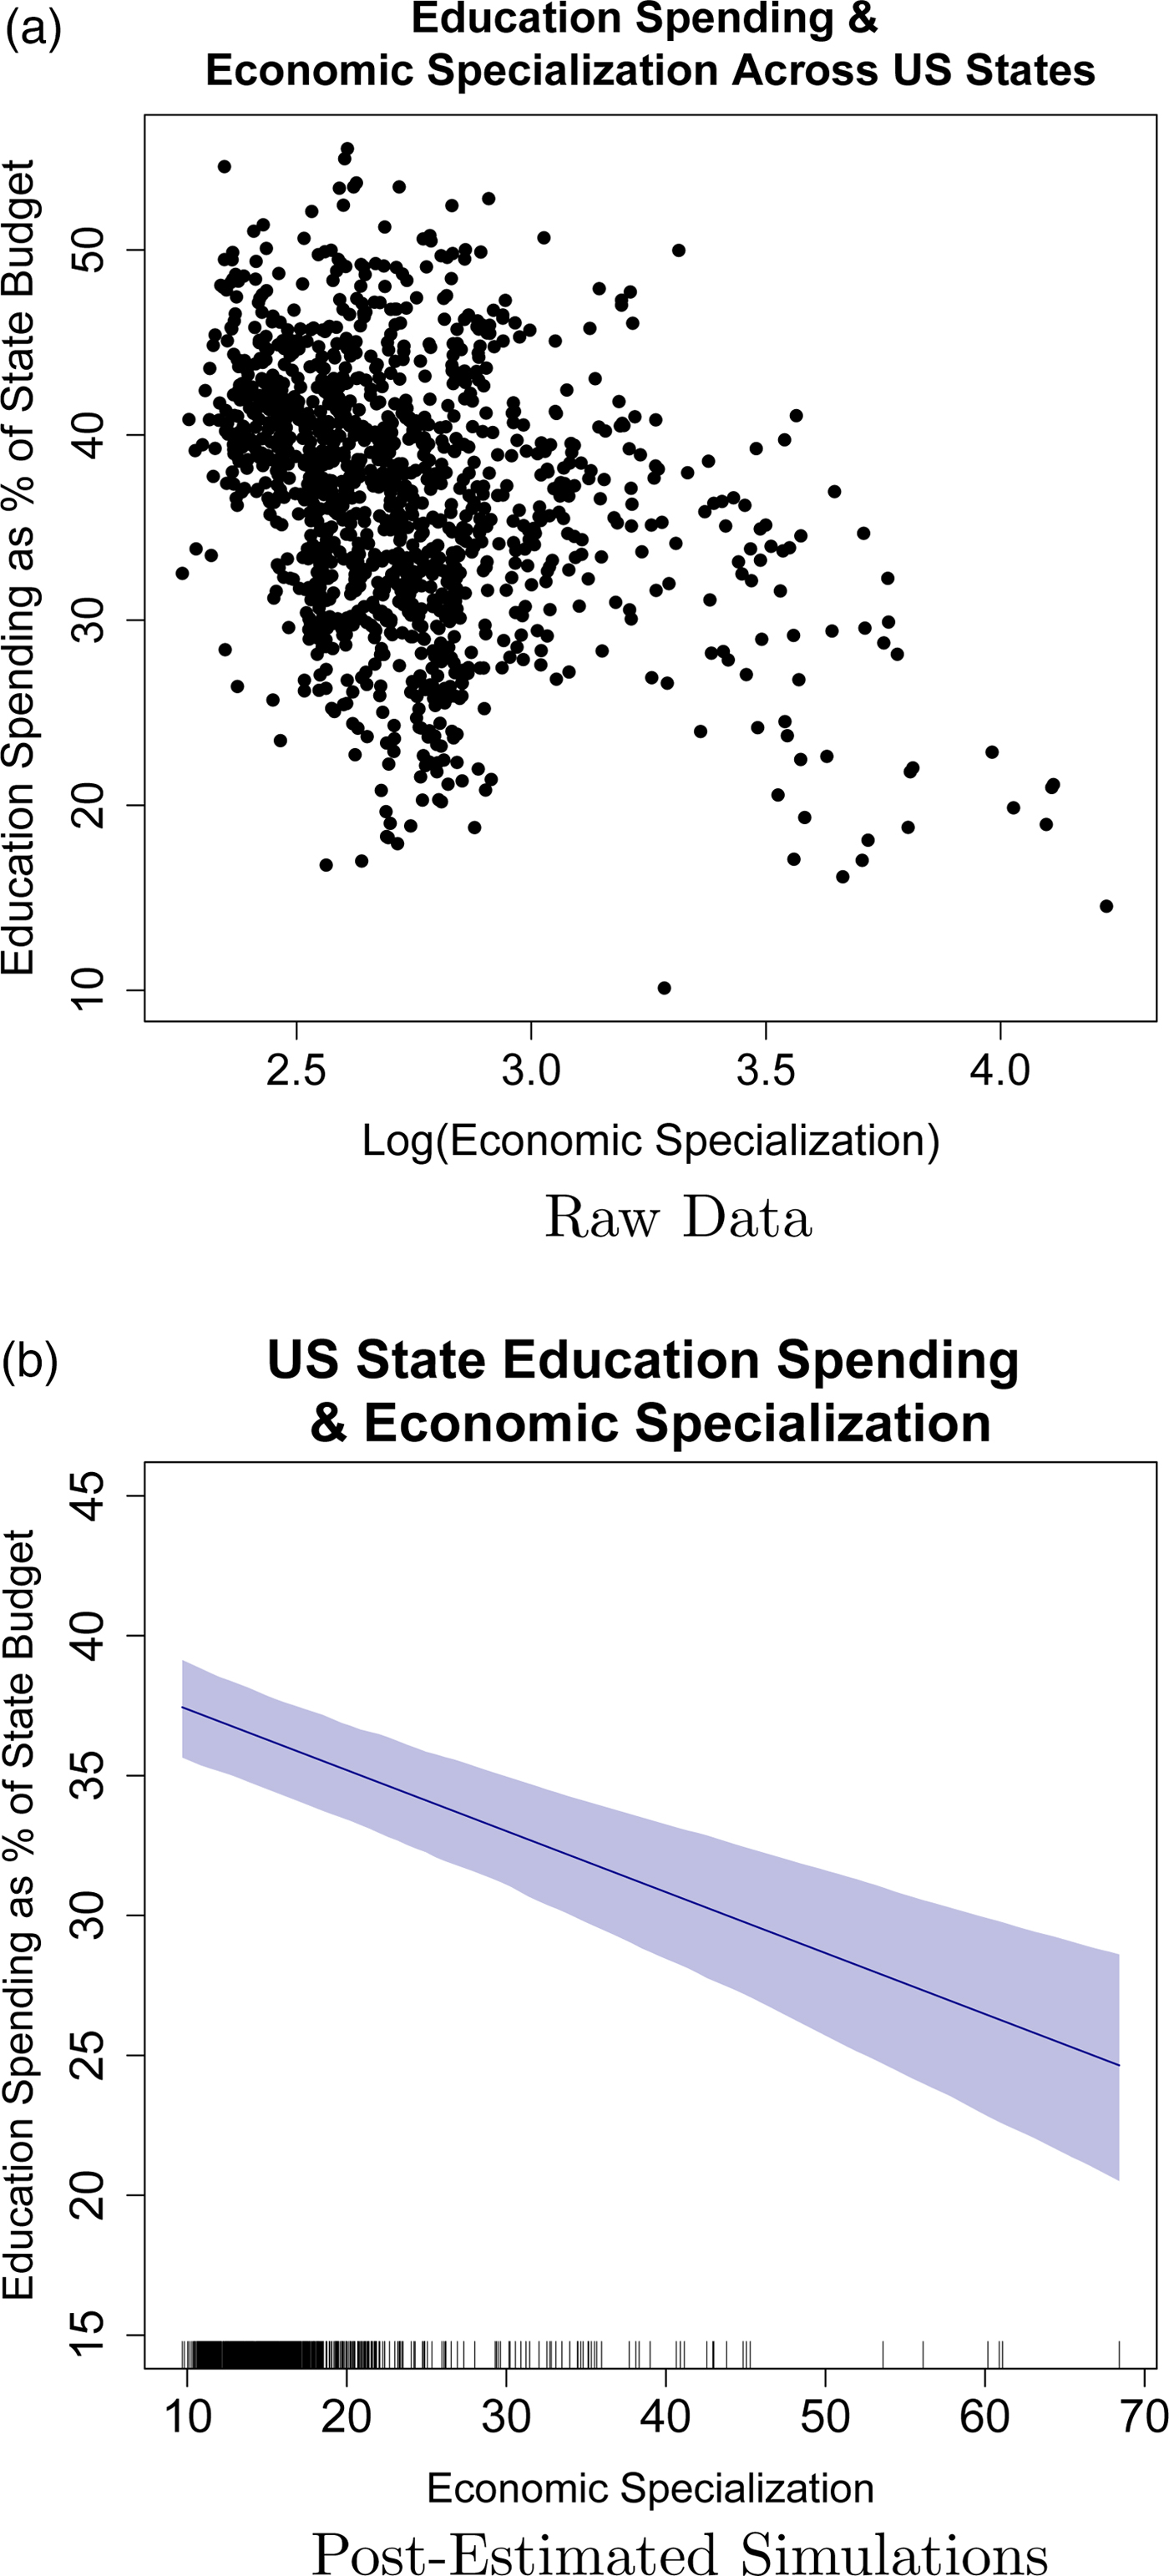
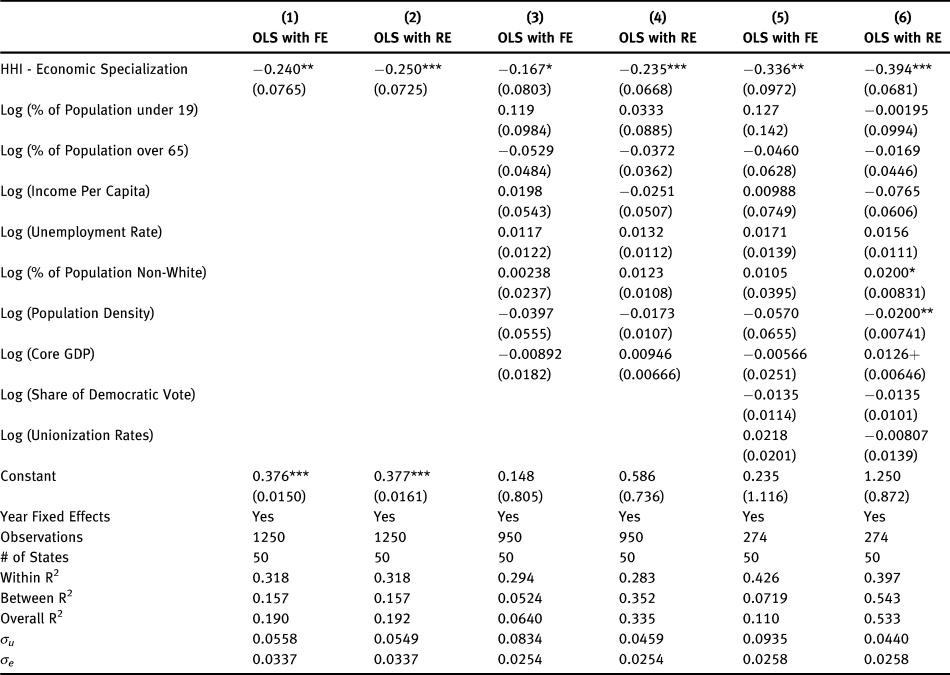
We find evidence that the level of economic specialization is negatively associated with education spending both across and within U.S. states from 1968 to 2000. Figure 1(a) uses the raw data and shows the bivariate relationship between education expenditures as a percentage of a state's budget and the level of economic specialization in the state.Footnote 36 This figure shows a clear negative relationship between economic specialization and education expenditures as a percentage of a state's budget. To get a sense of how robust this relationship is, Table 1 displays the results after running OLS regressions with fixed and random effects and robust standard errors clustered at the state-level. Our main finding is that the more specialized a state is, the lower the share of its budget devoted to education. The size of the core sectors, however, is not a predictor of education spending.
Education Spending and Economic Specialization Across U.S. States

U.S. States Public Education Spending & Economic Specialization—Fixed & Random Effects Models with Robust Clustered Standard Errors

Robust clustered standard errors at the county level in parentheses
+ p < 0.10, * p < 0.05, ** p < 0.01, *** p < 0.001
The substantive relationship between economic specialization and education spending is displayed in Figure 1(b), which is derived from post-estimated simulations. As the figure reveals, there is a strong negative relationship. A move from the 20th percentile to the 80th percentile of economic specialization is roughly associated with a decrease in education expenditures from 37 percent to 25 percent of the state budget. Since education tends to represent a large portion of state budgets, this indicates a significant decrease in a state's commitment towards education in real terms. These results are robust to multiple specifications including mixed effects models, logging the economic specialization variable, and omitting extreme values of economic specialization.Footnote 37
While the above analysis centered on the state level, the relationship between economic specialization and education spending could exist at lower (county) and higher (country) levels of analysis. Furthermore, education is just one type of public good. In the Appendix (sections A4 and B), we use statistical tests to uncover a negative relationship between economic specialization and government spending on police and health at the county-level in the United States over the period 1970–2000. In addition, we analyze data from 145 countries over the period 1970–2000 to confirm a negative relationship between economic specialization and education spending across countries.
Subsidies in U.S. states
We hypothesize that highly specialized states provide less in the way of public goods because politicians are pressured to spend more on subsidies to core sector firms. But how can we be certain that a trade-off in subsidies versus public goods occurs? Unfortunately, high quality data on government subsidies at the state level are hard to obtain since governments have little incentive to report how much money they provide to firms. Therefore, we turn to the most comprehensive dataset on subnational subsidies in the United States: the Good Jobs First Database.Footnote 38 The Good Jobs First Database compiles state and local subsidies for firms by scouring publicly-available data as well as submitting Freedom of Information requests. The data provide information about grants, tax breaks, subsidies, loans, etc., and provides the value of the subsidy to individual firms.Footnote 39
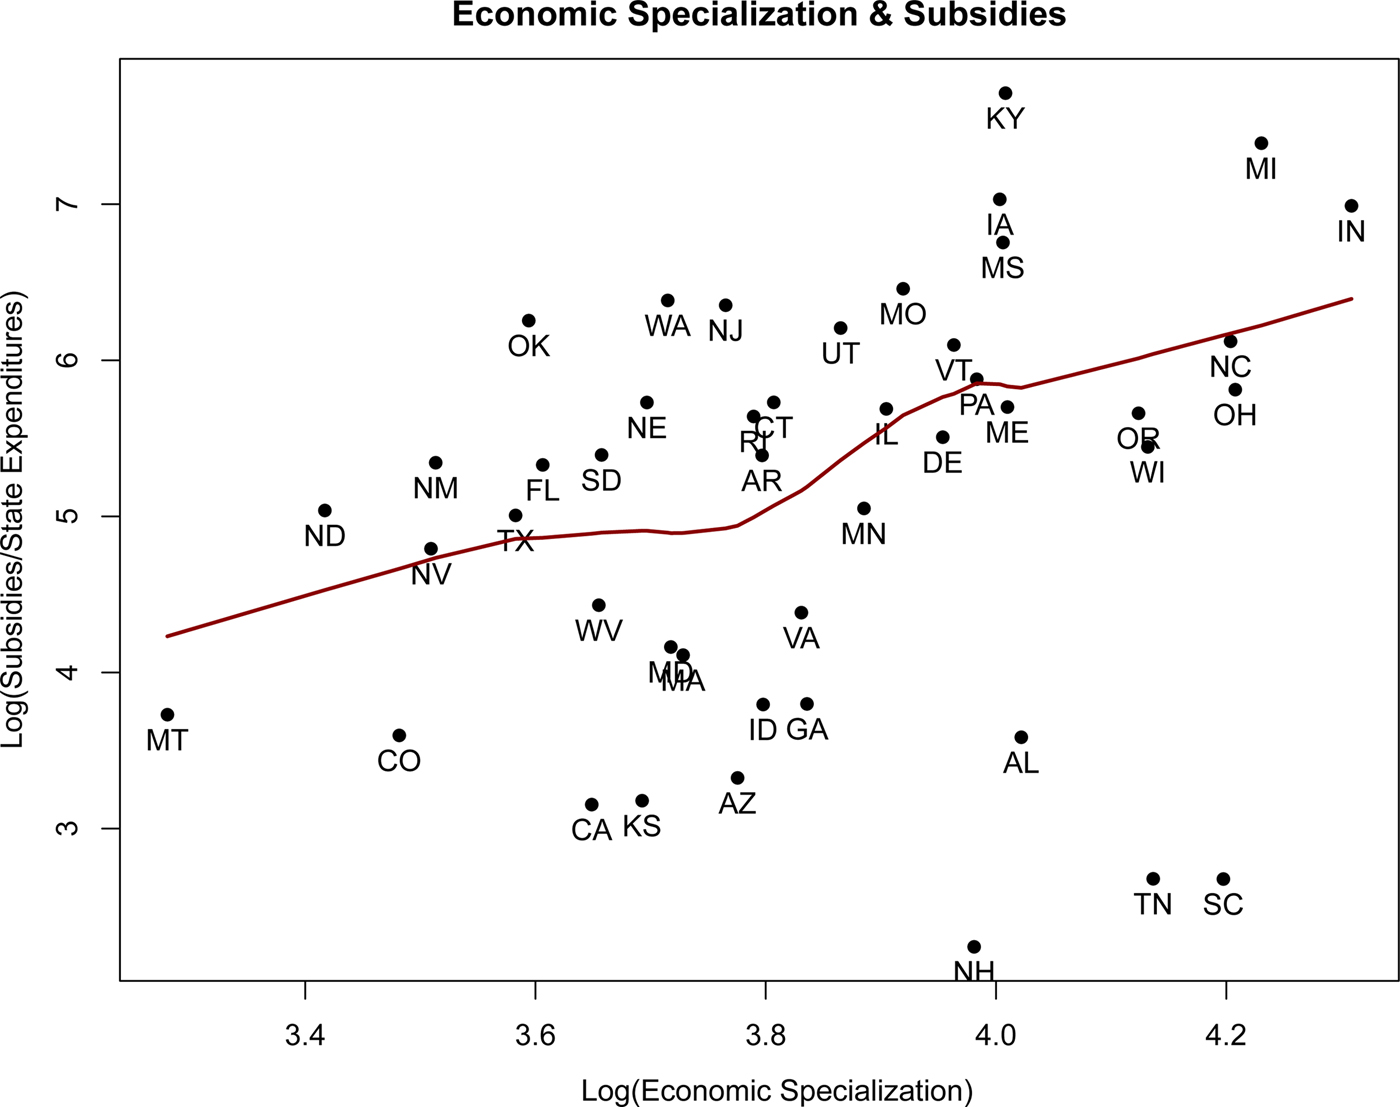
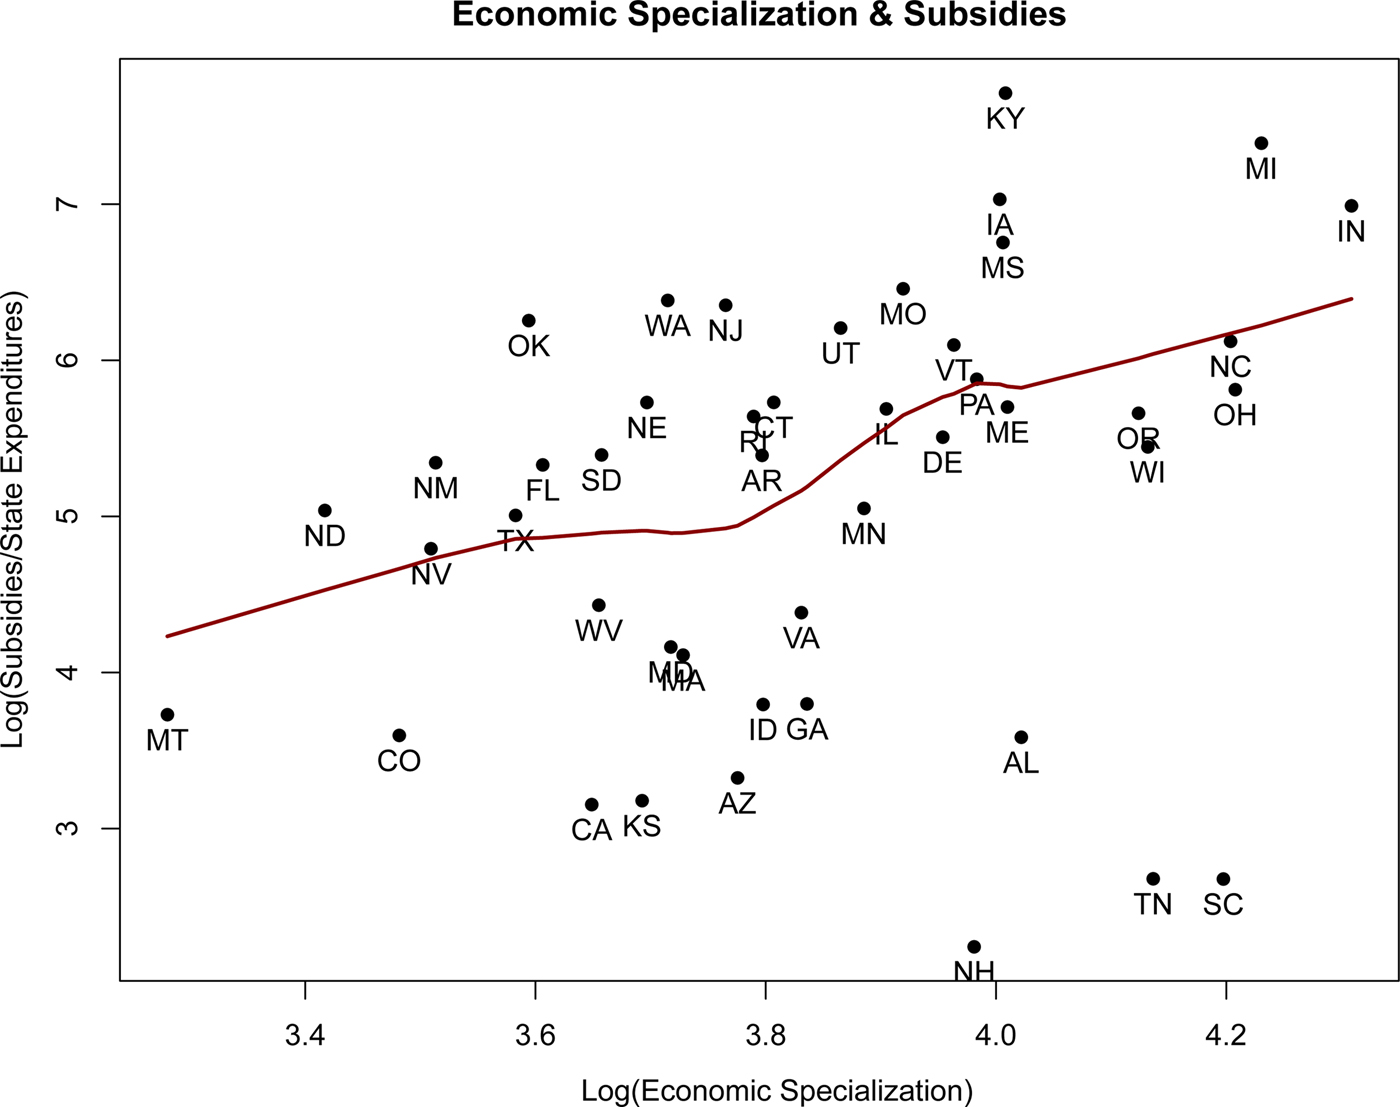
Due to the nature of the dataset, we cannot compare year-to-year values of a state's level of economic specialization with subsidies provided to firms. However, we can look at the broad association between a state's average level of economic specialization and the average annual amount of subsidies provided during the period from 2000 to 2010. Figure 2 visually shows the bivariate relationship between these two variables with a loess fit line.Footnote 40 The x-axis is the logged average value of a state's Herfindahl-Hirschman Index of core industries, while the y-axis is the logged average value of a state's subsidies as a share of total expenditures. As the figure shows, there is a positive association between average economic specialization and average subsidies as a share of total expenditures. States that rely on a few core economic activities (Indiana, Michigan, Ohio, etc.) are states that, on average, provide more subsidies to firms. The magnitude of the association is substantial. A move from a state in the 25th percentile of economic specialization, like Florida, to the 75th percentile of economic specialization, like Pennsylvania, is roughly associated with an increase of $220 million in subsidies to firms per year.
Economic Specialization and Average Subsidies in U.S. States, 2000–2010
Overall, the findings on the U.S. states help us to establish a negative relationship between economic specialization and a state's commitment to spending on education. The findings with respect to firm subsidies are also consistent with our hypothesis, however some caution is needed given limitations on the availability of data. In order to better understand the effects of economic specialization on government spending while exploring our hypothesis in a different context, we next turn to the uniquely shared history of a subset of Indian states.
Economic specialization in India
In late 2000, the Indian Parliament decided to re-draw the federal boundaries of three states. Bihar (what we refer to as “Undivided Bihar”) was bifurcated to create a smaller Bihar and the new state of Jharkhand. Madhya Pradesh (what we refer to as “Undivided Madhya Pradesh”) was bifurcated to create a smaller Madhya Pradesh and the new state of Chhattisgarh. Finally, Uttar Pradesh (what we refer to as “Undivided Uttar Pradesh”) was bifurcated to create a smaller Uttar Pradesh and the new state of Uttarakhand (see Appendix sections C1 and C2 for a map of these states and information on all data sources utilized for the following analysis). This alteration in the Indian federation was a significant event on many levels,Footnote 41 but with respect to economic specialization it had an especially dramatic effect on Undivided Bihar.
Prior to its bifurcation, Undivided Bihar was one of India's poorest states with a bipolar economy divided along geographic lines. Whereas the northern region (the area of future Bihar) was agriculture intensive, in the southern region (the area of future Jharkhand) lay enormous mineral reserves and commercial coal production facilities that had been in operation for over two centuries. In the decades following India's independence in 1947, large-scale factories and industrial cities grew in Undivided Bihar's southern region while the northern region became increasingly dependent on agriculture and related activities.Footnote 42
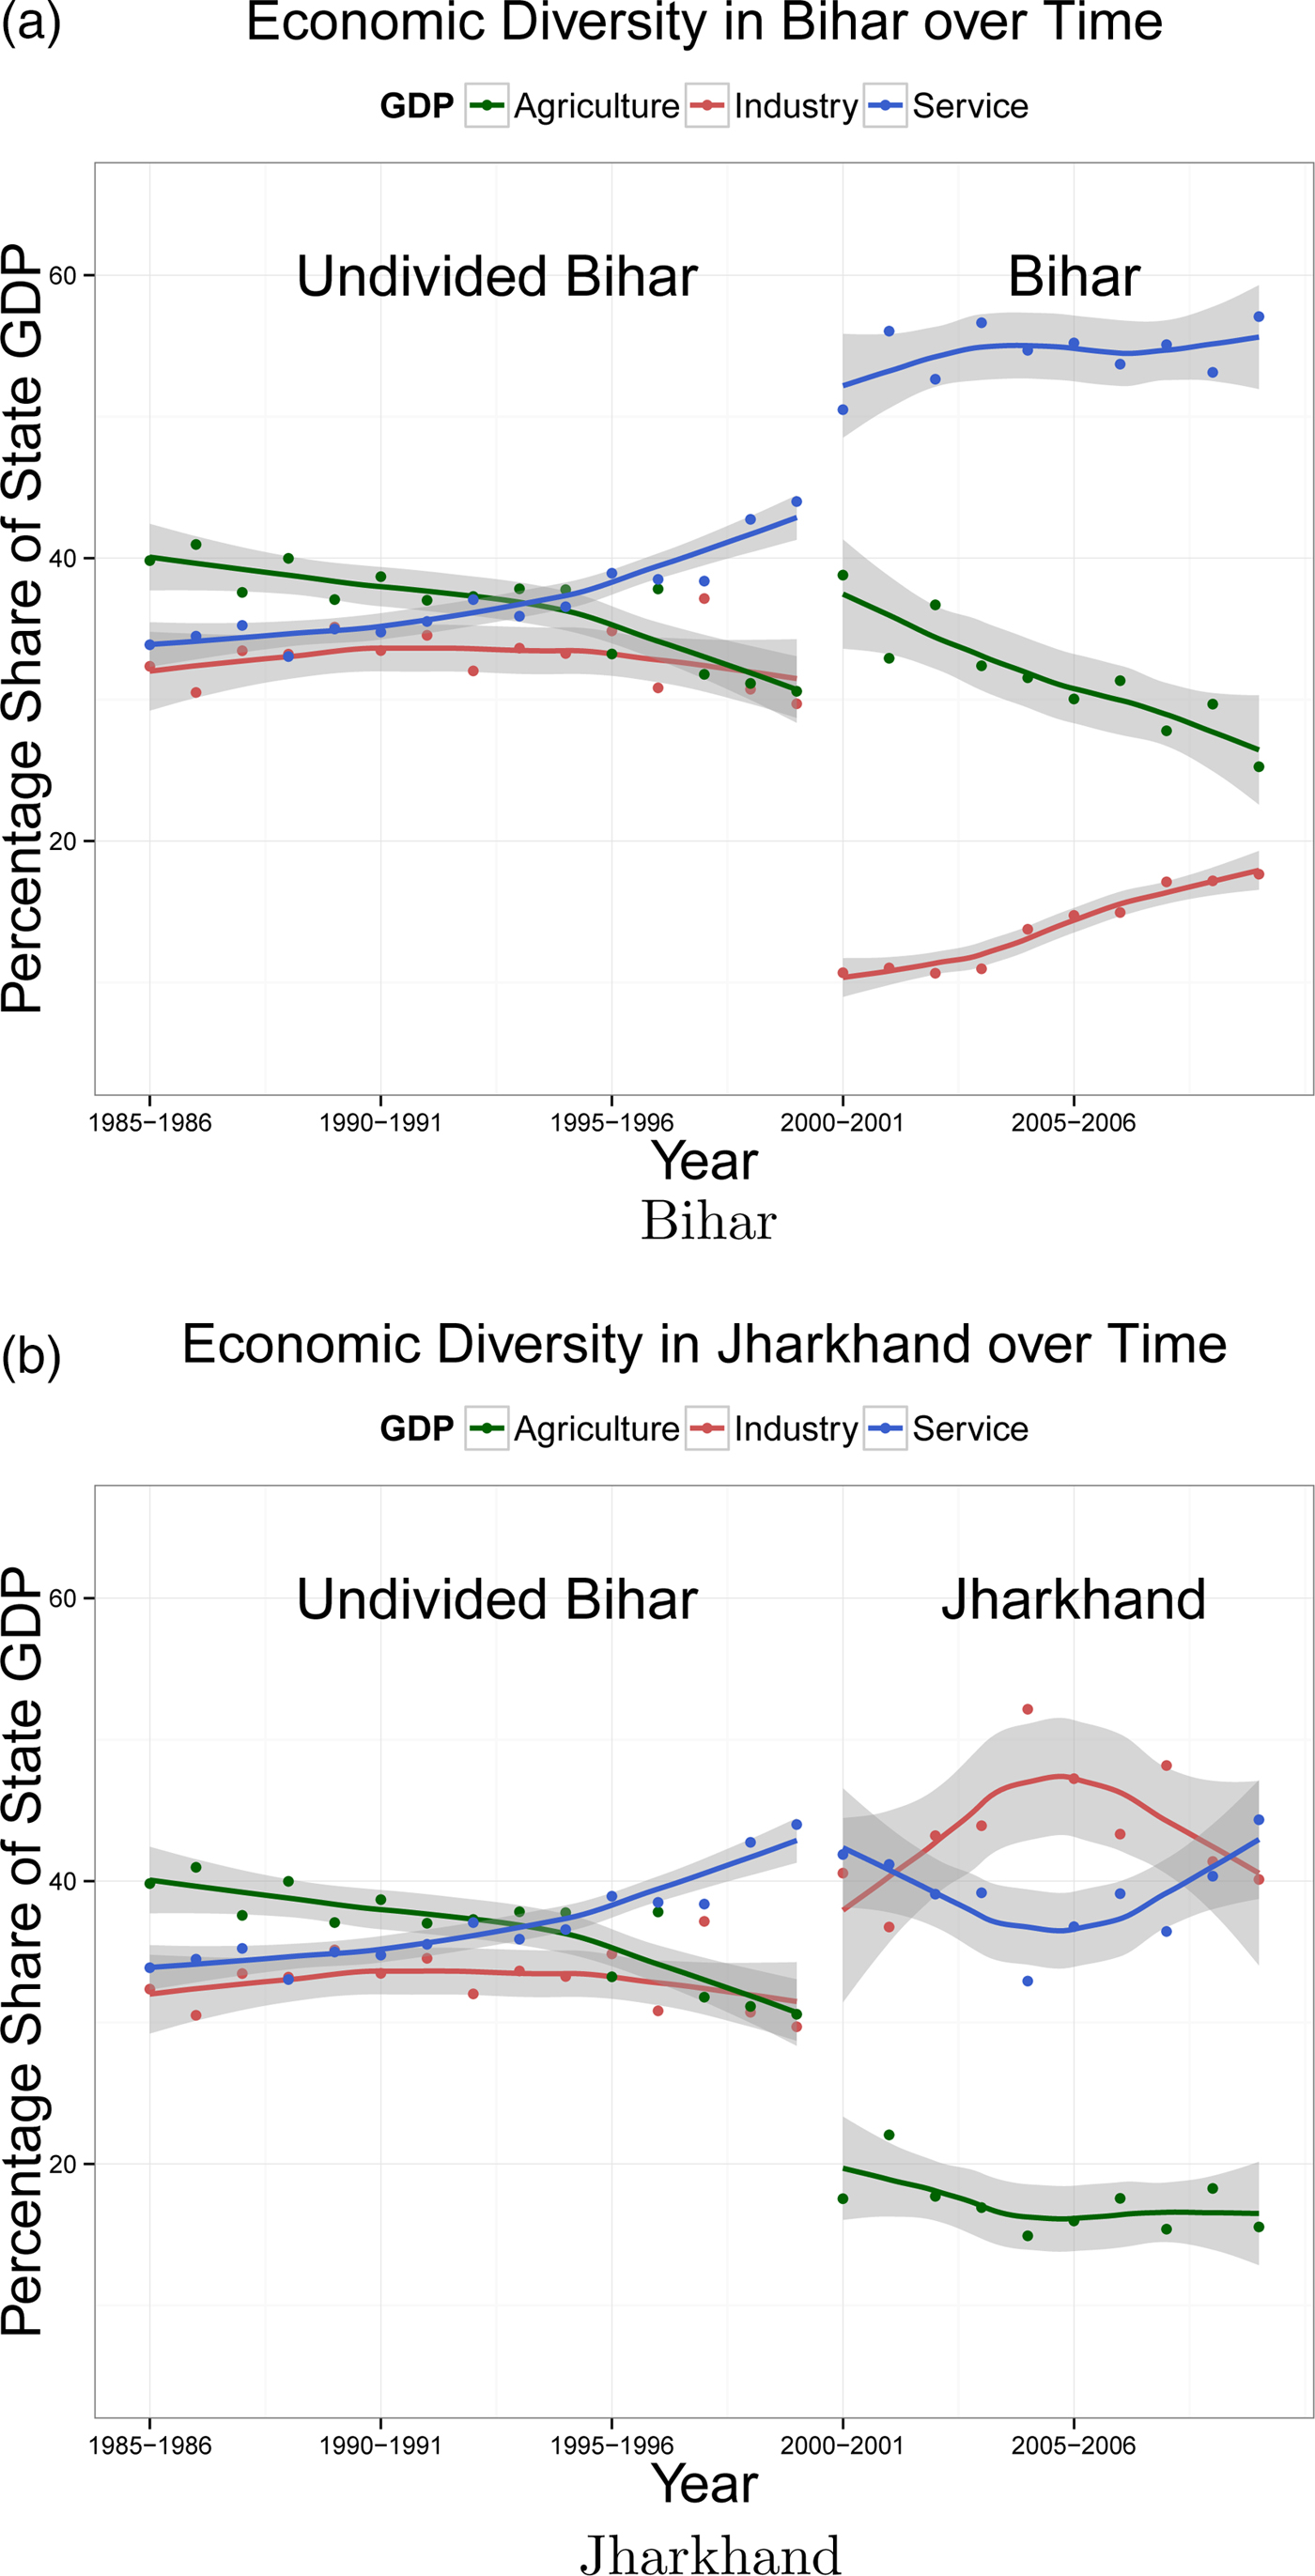
Once Undivided Bihar was bifurcated, the new state of Jharkhand inherited a massive mining and industrial sector but Bihar was left an agriculture dominated state with a denuded industrial sector.Footnote 43 Figure 3 reveals the extent of the economic transformation that took place due to the bifurcation.Footnote 44 In 2001–02, the first full year after the bifurcation, the ratio of Bihar's agricultural output value to industrial output value was 3.6. Since a ratio of one suggests an economy perfectly divided between agriculture and industry, this indicates that post-bifurcation Bihar was highly specialized in agriculture. By contrast, the ratio was 0.24 in Jharkhand, suggesting an economy highly specialized in industry.
Economic Activity in Bihar and Jharkhand

This shock in the level of economic specialization—a variable that tends to change very slowly in the vast majority of places in the world—provides us with a rare opportunity to explore our hypothesis using the method of controlled case comparison.Footnote 45 Furthermore, the appealing aspect of Undivided Bihar's bifurcation is that it happened in a manner exogenous to our area of study. India experts maintain that the bifurcation was the result of local political forces and an indigenous (adivasi, or “tribe”) social movement pushing for Jharkhand's independence since the 1920s.Footnote 46 The creation of Jharkhand was seen as the fulfillment of a dream for a “tribal homeland” in India. This fact helps protect against a concern that the bifurcation was driven by forces that influence our main variable of interest: economic specialization.
Bihar and Jharkhand are also unique because none of the other bifurcated or carry-over states—Madhya Pradesh, Chhattisgarh, Uttar Pradesh, or Uttarakhand—emerged from bifurcation with such highly specialized economies. Although Madhya Pradesh and Chhattisgarh were similar to Jharkhand in having sizeable mining and manufacturing sectors, they inherited economies that were much more balanced between agriculture and industry—their ratios in 2001–02 were much closer to one (0.8 and 0.76, respectively). Uttar Pradesh had an active agricultural sector like Bihar, but its economy was much more balanced with a ratio of 1.2. Uttarakhand emerged from bifurcation with the most balanced economy of the six states with a ratio of 0.94.
If our hypothesis is correct that economic specialization leads to decreased education spending and increased subsidy provision to core sectors, there should be an observable difference in Bihar and Jharkhand before and after the bifurcation. Undivided Bihar should privilege spending on education over subsidies to mining or agriculture due to its low level of economic specialization. After 2000, however, Bihar and Jharkhand should experience a decrease in education spending and an increase in subsidies for their most important sector. There should also be a difference between Bihar/Jharkhand and the other bifurcated and carry-over states after the bifurcation. Since the former emerged from bifurcation with uniquely specialized economies while the latter all had more balanced economies, we would expect Bihar/Jharkhand to devote less of their budget to education compared to Madhya Pradesh/Chhattisgarh and Uttar Pradesh/Uttarakhand. To investigate these expectations, we analyze Indian public finance data and restrict our analysis to post-1990 because this is when the Indian central government first devolved policy autonomy to state governments, which now gave them greater decision-making power over development spending.Footnote 47
Education spending in Bihar and Jharkhand
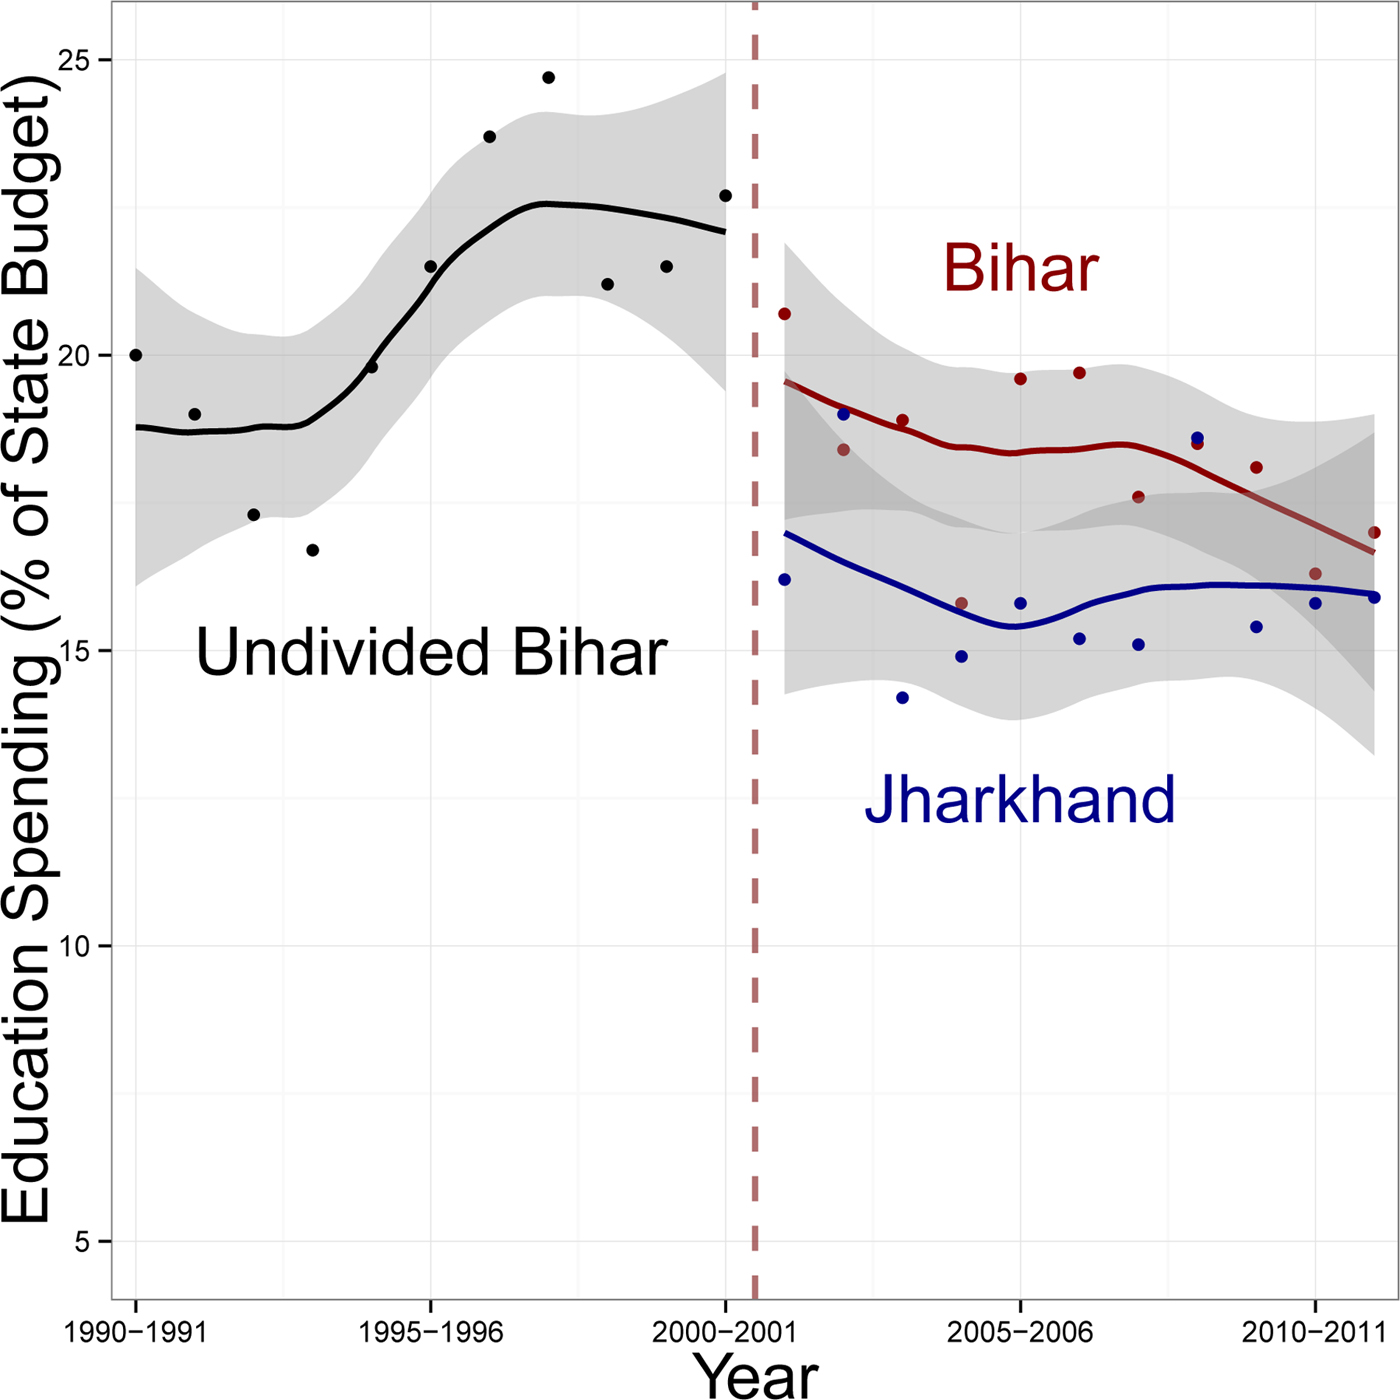
Figure 4 displays the trends in education spending in Undivided Bihar, Bihar and Jharkhand from 1990 to 2012. The figure shows that Undivided Bihar was steadily increasing its education spending during the 1990s, particularly after 1993–94. Education expenditures averaged 21 percent of Undivided Bihar's budget during the pre-bifurcation decade and reached a high of 25 percent in 1997–98. However, education's share of the budget declined in both states during the post-bifurcation decade. From 2001–02 to 2011–12, education's share of Bihar's budget averaged 18 percent. In Jharkhand, education's share was considerably lower, averaging 16 percent over this period. These spending patterns are consistent with our expectations. Education as a share of Undivided Bihar's budget was increasing during the decade before bifurcation, which coincides with the observation of an economically diverse Undivided Bihar. In the decade after bifurcation, education's share of the budget was decreasing in both states, which coincides with the observation of a highly specialized Bihar and Jharkhand.
Bihar & Jharkhand: Educational Spending as a Percentage of the State Budget

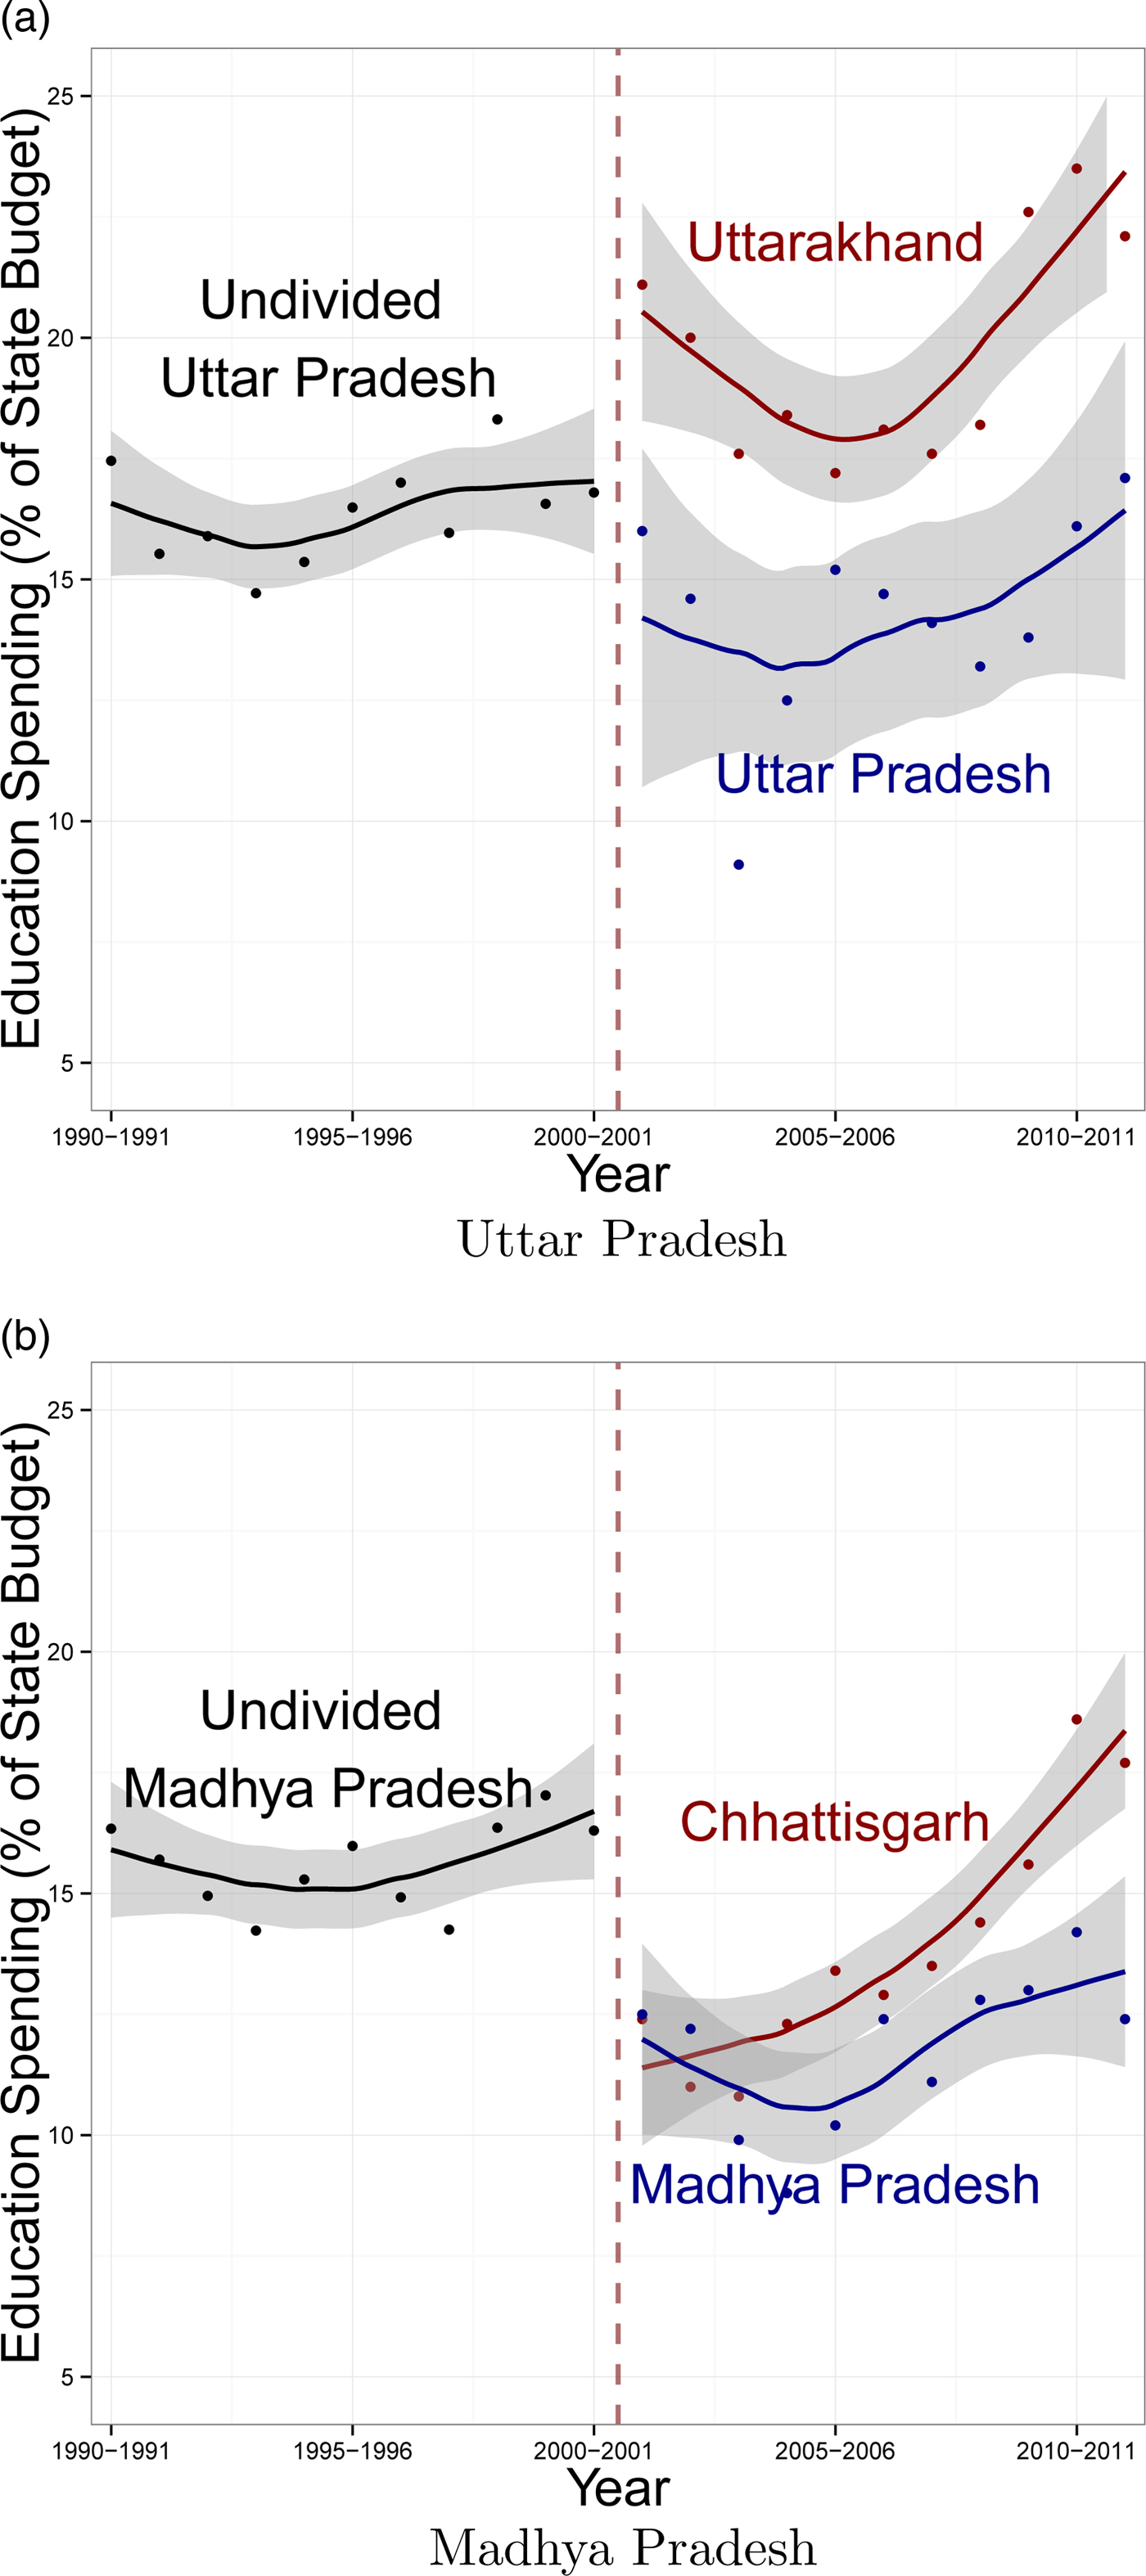
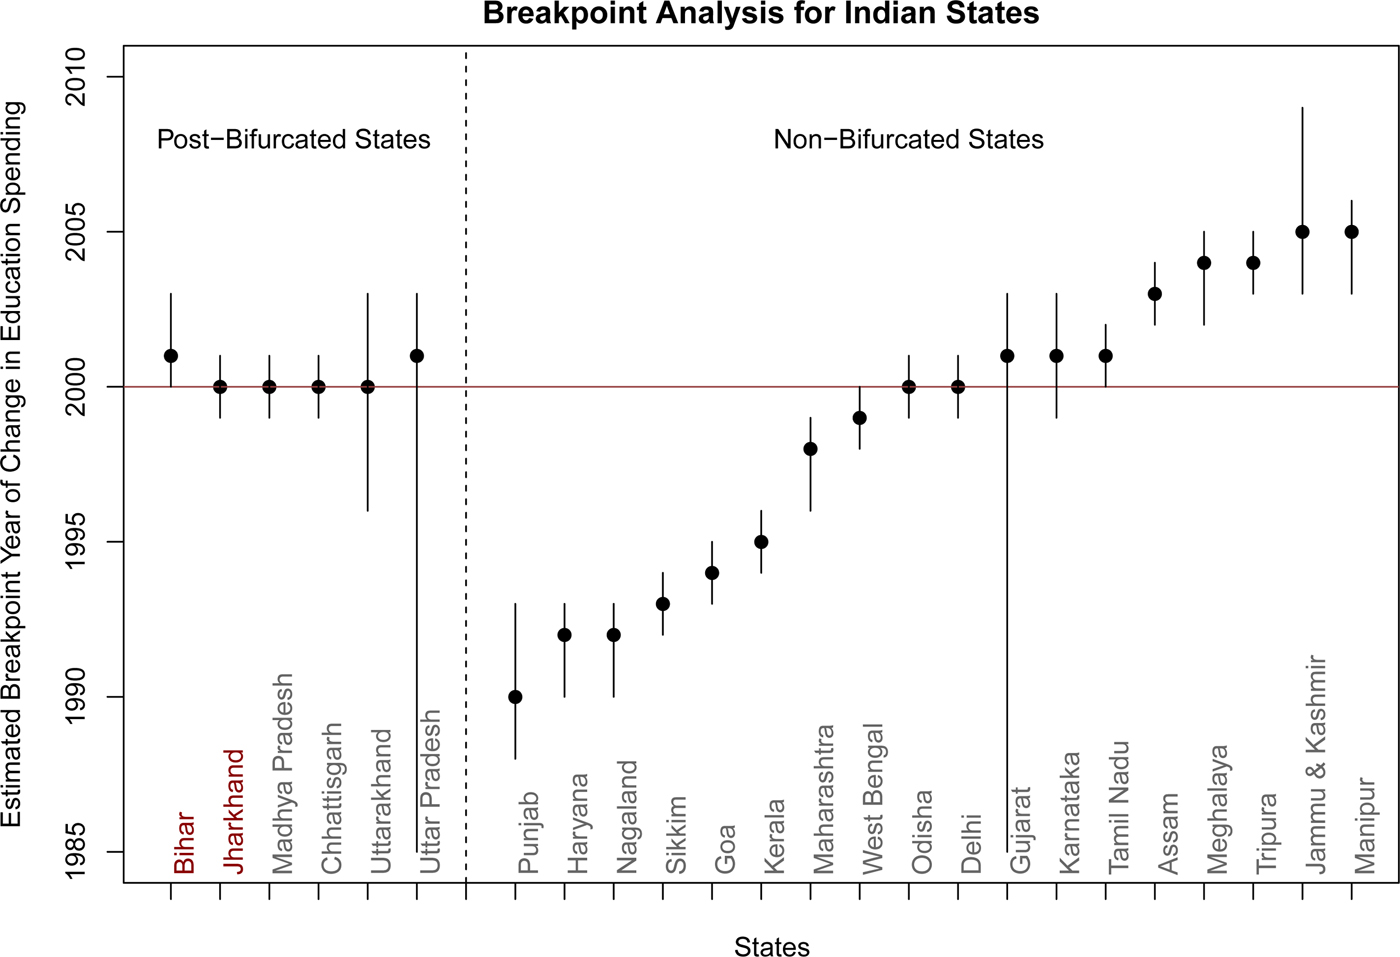
Contrary to Bihar and Jharkhand, and in line with our expectations, the other post-bifurcation states had increasing trends in education spending during the decade after bifurcation. This is displayed in figures 5(a) and 5(b). But the figures also show that most post-bifurcation states witnessed initial drops in education spending after the year of bifurcation (the exception is Uttarakhand). Education spending declined an average of 11.79 percent in these states during 2000–2002 as compared to a decline of 3.74 percent in all other Indian states (see table 2). To confirm that this initial drop in education spending stems from the bifurcation itself and was not part of a broader pattern across India at the time, we conduct a breakpoint analysis.Footnote 48 As figure 6 shows, the year 2000 was accurately identified as the most probable break in the time-series trend for the three states created from bifurcation (Chhattisgarh, Jharkhand, and Uttarakhand) and for the carry-over states it was 2000 (Madhya Pradesh) or 2001 (Bihar and Uttar Pradesh). In all other Indian states, there were various estimates in the break in the time-series and for three states no breaks were identified. Thus, we can confirm that the initial drop in education spending among five of the six post-bifurcation states was most likely due to the shock of bifurcation itself. But it is important to observe that only the highly specialized states of Bihar and Jharkhand continued a steady decline in spending, while the states with more balanced economies quickly recovered.
Other Bifurcated States: Educational Spending as a Percentage of the State Budget

Breakpoint Analysis for Indian States

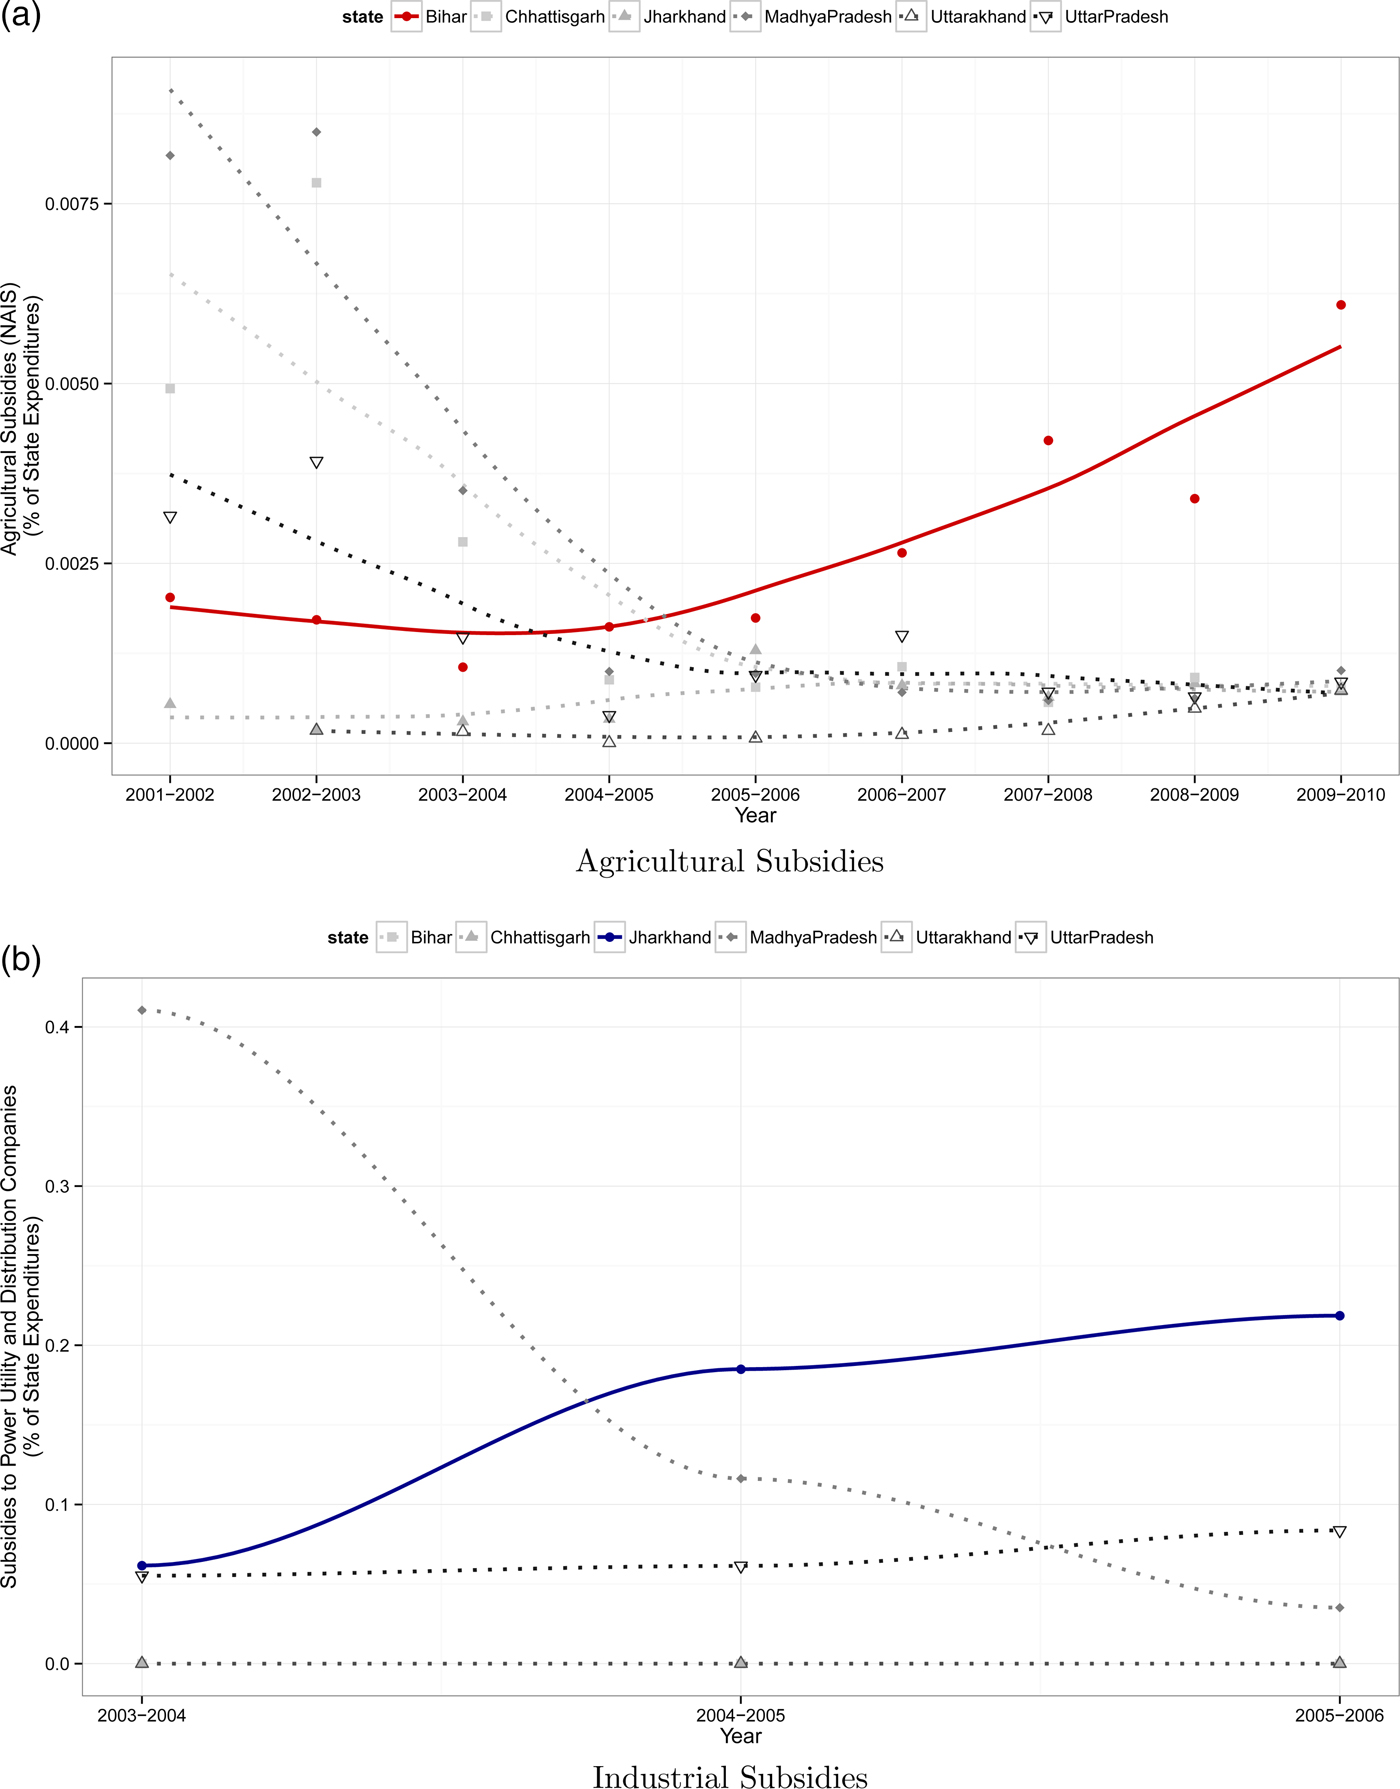
Post-Bifurcation States: Agricultural & Industrial Subsidies as a Percentage of the State GDP

Average Change in Education Spending in India from 2000–2002

To be sure, other confounding factors need to be ruled out before we consider accepting the hypothesis that the level of economic specialization is what explains the differences between Bihar/Jharkhand and the other post-bifurcation states. We can control for a number of socioeconomic factors because all six states shared a similar developmental profile prior to 2000. Since the 1980s, Bihar, Madhya Pradesh, and Uttar Pradesh were lumped in the category of BIMARU states (an acronym meaning “sick” in Hindi), which refers to low-income Indian states with high levels of illiteracy, crime, and corruption. All states also had similar levels of urbanization and shares of Scheduled Caste communities on the eve of the bifurcations.Footnote 49 Thus, differences in states’ economic or demographic profiles cannot explain why Bihar and Jharkhand exhibited different trends in education spending compared with the other four post-bifurcation states.
We can confirm that central transfers are unlikely to have augmented the extent to which these states were motivated to spend on education after bifurcation. During the 2000s, Indian states provided the bulk of total budgeted state expenditures on education (between 75–85 percent) and many of the central transfers for education were made through schemes that have strict guidelines for spending and implementation.Footnote 50 Additionally, central funds sanctioned for education in individual states frequently went unreleased due to coordination and management problems.Footnote 51 Consider also the fact that the state that received the most in central funds, Uttarakhand,Footnote 52 still devoted the highest percentage of its budget to education among all the post-bifurcation states. One might even have expected Uttarakhand to devote less of its budget to education given that it already had the highest literacy rate among the group at the time of bifurcation.Footnote 53
We can largely rule out political factors affecting education spending given that both Undivided Bihar and post-bifurcation Bihar have been led nearly uninterrupted by the same political party since 1990 (Janata Dal or its state offshoot, Rashtriya JanataDal).Footnote 54 Additionally, the roles of leadership tenure or political competition cannot explain why education spending declined in both Bihar and Jharkhand. Whereas Bihar was less politically competitive from 2001 to 2012 with just two different chief ministers and two changes in power, Jharkhand had four different chief ministers and nine changes in power during this time.
Although political party affiliation is often cited as a determinant of state development spending in India,Footnote 55 a clear pattern with respect to education spending does not appear in these six states during the decade after bifurcation. The states with Bharatiya Janata Party (BJP)—affiliated chief ministers during the majority of these years—Madhya Pradesh (69 percent of the time), Jharkhand (60 percent of the time), and Uttarakhand (51 percent of the time)—had very different patterns in education spending. Three states with weaker BJP presence—Chhattisgarh (30 percent of the time), Uttar Pradesh (13 percent of the time), and Bihar (0 percent of the time)—also had contrasting patterns in education spending. Bihar and Uttar Pradesh had strong lower caste political mobilization, which we might surmise is positively linked to education spending, yet they took different approaches to this budget area during the decade after bifurcation. Party politics at the state level, it seems, cannot explain patterns in education spending in this era.
It is also important to observe that Bihar and Jharkhand increased or maintained their high levels of economic specialization over the course of the 2000s. Although data restrictions prevent the construction of state-level HHIs as used in the U.S. analysis (see Appendix section C3 for details), an examination of the available data suggest increasing specialization for both states, especially from 2001–02 to 2005–06. In Bihar, seventeen out of twenty-four non-service sectors saw a decline in their share of total output during this period, suggesting that output was increasingly dominated by a smaller number of sectors. In Jharkhand, sixteen out of twenty-five non-service sectors saw a decline in their shares of total output from 2001–02 to 2005–06, suggesting a similar trend of increasing specialization. Although the latter half of the decade witnessed modest diversification in Bihar, specialization deepened in Jharkhand. From 2005–06 to 2009–10, Bihar saw recovery in its food products manufacturing sector and growth in non-agricultural sectors such as chemicals, plastics, and metals. In Jharkhand, however, specialization increased in its core sector.
By contrast, the other four post-bifurcation states made greater strides in diversification. In Uttar Pradesh, eighteen out of twenty-nine non-service sectors saw an increase in their shares of total output between 2001–02 and 2005–06, indicating greater diversification. Although Uttar Pradesh grew more reliant on certain manufacturing sectors from 2005–06 to 2009–10, the state saw growth in new sectors such as pharmaceuticals and computers/electronics. In Uttarakhand, seventeen out of twenty-six non-service sectors increased their share of total output. By the end of the 2000s, Uttarakhand had experienced growth in computers/electronics, pharmaceuticals, motor vehicles, fabricated metals, textiles, and leather products.
Madhya Pradesh and Chhattisgarh saw more limited diversification during the 2000s, but they still achieved more balanced growth across non-service sectors than Bihar or Jharkhand. In Madhya Pradesh, fourteen out of twenty-seven non-service sectors increased their shares of total output from 2001–02 to 2005–06, whereas in Chhattisgarh the number was fewer, ten out of twenty-three non-service sectors. In the latter half of the decade, Madhya Pradesh saw more specialization in manufacturing sectors but growth in areas such as pharmaceuticals, rubber products, and wood products. In Chhattisgarh, the level of specialization modestly declined from 2005–06 to 2009–10, but there was growth in new sectors such as computers/electronics.
Taken as a whole, the India data broadly confirm our argument that patterns in government spending for a public good like education are related to the level of economic specialization. Economically diverse Undivided Bihar spent an increasing share of its budget on education whereas the highly specialized states of Bihar and Jharkhand spent a decreasing share of their budgets on education after bifurcation. Other Indian states that were bifurcated at the same time were different from Bihar and Jharkhand because they all emerged with more balanced economies, and also quite differently they displayed an increasing commitment towards education spending. The experience of bifurcation or federal independence, socioeconomic factors, the role of center-state transfers, or political factors are unlikely to explain the spending patterns observed in Bihar and Jharkhand.
Subsidies in Bihar and Jharkhand
According to our hypothesis, Undivided Bihar should have provided comparatively less support for core sectors in the decade prior to bifurcation because its economy was more diverse. After the bifurcation, Bihar should have provided more support for its core sectors (agriculture and related activities), and Jharkhand should have provided more support for its core sectors (mining and related industrial sectors). Although testing this component of our argument is difficult given limited data on state-level subsidies in India, the available data broadly confirms these patterns.
In Undivided Bihar during the 1990s, the government of Lalu Yadav was well known for its opposition to providing preferential treatment to the state's leading mining house, the Tatas. Yadav's government chipped away at the waivers, subsidies, and other benefits the Tatas had long received.Footnote 56 Agriculture did not fare much better in this era of Undivided Bihar. As a share of total expenditures, government spending on agriculture declined from 5.8 percent in 1991 to 3.2 percent in 1999. The net domestic product of Bihar's agriculture also declined over this decade, which was in part due to the reduction in subsidies for diesel fuel and fertilizer.Footnote 57
Bihar accelerated its spending for agriculture after bifurcation, which now became its core sector. By 2006–07, annual agricultural subsidies were roughly four times greater than their value in 1990–91. Annual fertilizer subsidies increased nearly twenty-five times between 1990–91 and 2008–09.Footnote 58 During the 2000s, Bihar steadily increased its provision of electricity subsidies for the agricultural sector. In 2007–08, Bihar gave 397 crore Rs in electricity subsidies, and over the next four years the government increased these subsidies by 76 percent.Footnote 59 Figure 6 displays Bihar's trend towards aiding the agricultural sector, which captures how much each post-bifurcation state provided in National Agricultural Insurance Scheme (NAIS) subsidies as a share of the government's budget. NAIS is the largest crop insurance program in the world. As the figure shows, Bihar's government devoted an increasingly higher share of its budget to NAIS subsidies over the decade while all other post-bifurcation states steadily withdrew their support.
In a similar fashion, Jharkhand emerged from bifurcation with a strong commitment to providing subsidies and concessions to its core sectors: mining and related industries. This is especially noticeable in the coal-fueled power sector, where the state provided huge subsidies to the Jharkhand State Electricity Board (JSEB): 75 crore Rs in 2003–04; 275 crore Rs in 2004–05; and 363 crore Rs in 2005–06. As figure 6 displays, Jharkhand devoted an increasingly higher share of its budget in the form of subsidies to power and distribution companies compared to other post-bifurcation states. At times, Jharkhand's reliance on subsidies has drawn terse criticism from the Central Government: “The planning (of the state) is not only still tilted towards providing subsidy/concessions, but also depicts an increasing trend. No subsidy-based projects should be encouraged … Jharkhand is still heavily dependent on subsidy based regime to attract industrial investment.”Footnote 60
These patterns of subsidy provision in Bihar and Jharkhand are not observed in the other post-bifurcation states. Both Madhya Pradesh and Uttar Pradesh provided similar amounts of subsidies to agriculture as Bihar during the 2000s, but they also provided subsidies to their power sectors and negotiated substantially more industrial investment than Bihar. Chhattisgarh and Uttarakhand consistently provided more subsidies to agriculture than Jharkhand, but they also outperformed (or performed just as well as) Jharkhand along all of the industrial investment measures.
The experiences of Undivided Bihar, Bihar, and Jharkhand broadly adhere to our paper's expectation about a relationship between economic specialization, public goods spending, and government subsidies for core sectors. In Undivided Bihar, we observed a more diversified economy providing fewer subsidies to core sectors but spending a greater share of its budget on education. Once bifurcation occurs, the creation of highly specialized economies brings forth a decline in each state's spending on education but an increase in subsidies for core sector firms.
Conclusion
Our paper illustrates that economic specialization is an important and oft–overlooked factor in explaining patterns in government spending. Whereas most previous work on economic specialization focuses on outcomes like economic growth, investment, or trade, we show that a high level of economic specialization is linked to an increase in benefits for core economic sectors but a decrease in spending on public goods, particularly education. We provide evidence for this in two very different contexts: at the subnational level in the United States and India. Statistical analysis demonstrates that increasing economic specialization in the United States is associated with decreasing government spending on education, and state-level data suggest a positive association between economic specialization and industrial subsidies. An analysis of India shows that the level of economic specialization is related to education spending, and that subsidies for core sectors increased alongside the level of economic specialization.
Future research should probe the potential differences between specialized economies according to the type of core sectors present. Indeed, the effects of economic specialization may be different if the core activity is mining versus finance or information technology. Similarly, the overall size of core sectors may matter for some sectors but not others. Although the U.S. analysis found that the size of core sectors was never a statistically significant predictor of education spending, it is reasonable to suppose that a large and dominant high-technology sector could motivate spending on education, particularly higher education. A large and dominant coal mining sector, by contrast, is unlikely to have such an effect given that a large local pool of highly-educated workers is of little benefit to this sector.
Our findings make a direct contribution to the writings in public policy and the political economy of development. Until now, scholars working on government-industry relations or public goods conducted research independently with little conceptual overlap between the two areas. We show that strong linkages emerge between the two, particularly in the context of a highly specialized economy. Here, politicians have to make an important decision about how to spend scarce resources on the development of a region, but their decision is made easier by the fact that voters and core sector firms have aligned interests. However, aligned interests may not result in better outcomes for the population over time. Indeed, the systematic under-provision of important public goods like education only magnifies the potential problems associated with economic specialization. By failing to invest in one of the key inputs—human capital—needed to spark entrepreneurship and attract the growth of other types of industries, it becomes increasingly difficult to break a region's reliance on a core economic sector and push for broad-based economic growth.
Supplementary material
To view supplementary material for this article, please visit https://doi.org/10.1017/bap.2018.33