The geological cycle of nitrogen in the Earth system is slow, starting when organic matter sinks and settles in oceanic sediments. Once fixed in sediments and crust, N is converted to NH4+ via hydrolysis (Hall, Reference Hall1999). Nitrogen may be carried into subduction zones, where it is volatilized (Elkins et al., Reference Elkins, Fischer, Hilton, Sharp, McKnight and Walker2006), or carried into the mantle, where it is mostly recycled (Marty, Reference Marty1995). Either subduction or volcanic–basement interaction zones with high geothermic gradients favour volatilization, where N as NH4+ may be incorporated in clay minerals from argillic envelopes (i.e. low- or high-sulfidation zones) related to the fossil hydrothermal systems (Bobos & Williams, Reference Bobos and Williams2017).
Because NH4+ has the same charge as K+ and a similar ionic radius (1.43 Å and 1.38 Å, respectively), it may substitute K+ in the mineral lattice sites; illite (I) is one of the minerals where the NH4+ may replace K+, forming NH4-I (Stevenson & Dhariwal, Reference Stevenson and Dharival1959; Higashi, Reference Higashi1982; Williams & Ferrell, Reference Williams and Ferrell1991).
Several NH4-I occurrences have been reported around the world in a wide variety of geological environments (i.e. sedimentary, metamorphic and hydrothermal). The structure, morphology, crystal chemistry and formation of NH4-I in diagenetic to low-grade metamorphic shales, and anthracite-rank coal environments have been extensively studied by X-ray diffraction (XRD), infrared (IR) spectroscopy and electron microscopy techniques (Sterne et al., Reference Sterne, Reynolds and Zantop1982; Cooper & Evans, Reference Cooper and Evans1983; Juster et al., Reference Juster, Browne and Bailey1987; Daniels & Altaner, Reference Daniels and Altaner1990; Compton et al., Reference Compton, Williams and Ferrell1992; Lindgreen, Reference Lindgreen1994; Šucha et al., Reference Šucha, Kraus and Madejova1994; Schroeder & McLain, Reference Schroeder and McLain1998; Lindgreen et al., Reference Lindgreen, Drits, Sakharov, Salyn, Wrang and Dainyak2000; Nieto, Reference Nieto2002; Drits et al., Reference Drits, Lindgreen, Sakharov, Jakobsen, Salyn and Dainyak2002, Reference Drits, Sakharov, Salyn and Lindgreen2005; Árkai et al., Reference Árkai, Livi, Frey, Brukner-Wein and Sajgo2004; Bauluz & Subías, Reference Bauluz and Subías2010).
The NH4-I samples in anthracite-rank coals described by Juster et al. (Reference Juster, Browne and Bailey1987) were studied by Jiang et al. (Reference Jiang, Essene and Peacor1990a), where NH4-I and K-I intergrown packets without smectite layers were identified by TEM. In very-low-grade metapelites from the Douro-Beira Carboniferous basin in Portugal, Nieto (Reference Nieto2002) described the NH4- and K-micas segregated into well-separated packets with few interstratifications. In addition, the NH4-bearing mica layers intergrown with K-mica layers were identified in low-grade metaclastic rocks and polymetamorphic schists from the Betic Cordillera (Ruiz-Cruz & Sanz de Galdeano, Reference Ruiz-Cruz and Sanz de Galdeano2008, Reference Ruiz-Cruz and Sanz de Galdeano2010).
X-ray diffraction (XRD) is an accurate method for detecting the interstratifications between NH4-I and other 2:1 layer types such as K-I, smectite or vermiculite (Drits et al., Reference Drits, Lindgreen and Salyn1997a). Thus, an I-S mixed-layer containing illite-tobelite-smectite and vermiculite interlayers was described previously (Drits et al., Reference Drits, Sakharov, Lindgreen and Salyn1997b, Reference Drits, Lindgreen, Sakharov, Jakobsen, Salyn and Dainyak2002, Reference Drits, Sakharov, Salyn and Lindgreen2005; Lindgreen et al., Reference Lindgreen, Drits, Sakharov, Salyn, Wrang and Dainyak2000), in which the layer thickness variations of interstratified layers significantly influenced the relationship between the basal reflection widths. Similarly, K-I and NH4-I or K-I and paragonite mixed layers were also identified by XRD (Jiang & Peacor, Reference Jiang and Peacor1993; Drits et al., Reference Drits, Lindgreen and Salyn1997a). However, the XRD technique is not sufficiently sensitive to identify heterogeneous I-S interstratified structures (Drits, Reference Drits2003), requiring the application of the multi-specimen XRD method (Drits et al., Reference Drits, Sakharov, Lindgreen and Salyn1997b; Sakharov et al., Reference Sakharov, Lindgreen, Salyn and Drits1999).
Furthermore, the distribution of NH4+ and K+ in the illite interlayer may be homogeneous or heterogeneous (Drits et al., Reference Drits, Lindgreen and Salyn1997a). Two different cases in relation to the NH4+ and K+ distribution in the illite interlayer were assumed by Drits et al. (Reference Drits, Lindgreen and Salyn1997a, Reference Drits, Lindgreen, Sakharov, Jakobsen, Salyn and Dainyak2002, Reference Drits, Sakharov, Salyn and Lindgreen2005): the K+ and NH4+ were homogenously or rather heterogeneously distributed within each interlayer. The latter case represents a mixed-layer structure of K-I and NH4-I layers and the former is similar to the formation mechanism of tobelite (NH4-mica) described by Higashi (Reference Higashi1978, Reference Higashi1982), in which a progressive substitution of K+ for NH4+ was proposed.
The K-I and NH4,K-I physical mixture and NH4-I-S mixed layer with a percentage of smectitic layers (%S) ranging from 5%S to 40% S were identified in the hydrothermal area of Harghita Bãi from the Eastern Carpathians (Bobos, Reference Bobos2012; Bobos & Eberl, Reference Bobos and Eberl2013). The structure, morphology and chemistry of the NH4-I-S mixed layer (the <2 µm clay fractions) were studied to provide new insight into the mechanism of smectite tobelitization in hydrothermal systems (Bobos & Ghergari, Reference Bobos and Ghergari1999; Bobos, Reference Bobos2012). In addition, isotopic (δ18O; K–Ar) and trace rare earth element (REE) geochemistry was performed on the <2 µm clay fractions of the NH4,K-I/K-I mixture and the NH4-I-S mixed layer to constrain the timing of K-I (and NH4-I) formation and the isotopic signature of NH4-I crystallization (Clauer et al., Reference Clauer, Liewig and Bobos2010).
The present study was largely built on previous work and aimed to examine the textural relationships of K-I, NH4,K-I and NH4-I-S (5%S or 12%S) as the important reservoir of N in silicate minerals. In addition, an understanding of the crystal chemistry of NH4-I requires a more complete description of this mineral in order to determine the formation of NH4-I in hydrothermal systems.
The NH4-I-S samples with higher NH4+ contents reported in literature and NH4-I with three interlayer cations (i.e. K+ and Na+) are studied at lattice scale by TEM-AEM. The main purpose of this work is to determine and to compare the textural, structural and crystal chemical characteristics of K-I, NH4,K-I and NH4-I-S mixed layers from undisturbed altered andesitic rocks.
Geological framework
The Neogene volcanism of the East Carpathians was related to the subduction of the East European Plate beneath the Tisza–Dacia continental microplate (Fig. 1a) (Seghedi et al., Reference Seghedi, Balintoni and Szakacs1998, Reference Seghedi, Downes, Szakacs, Mason, Thirlwall, Rosu, Pécskay, Márton and Panaiotu2004). The Călimani–Gurghiu–Harghita (CGH) volcanic chain (Fig. 1b), known for its diminishing age and volume southwards from 10 to 3.9 Ma, consists of calc-alkaline rocks that occurred along the easternmost margin of the rigid Tisza–Dacia block (Szakacs & Seghedi, Reference Szakacs and Seghedi1995) and marks the end of the post-collisional subduction-related magmatism along the front of the European convergent plate margin (Mason et al., Reference Mason, Downes, Thirlwall, Seghedi, Szakacs, Lowry and Mattey1996, Reference Mason, Seghedi, Szakacs and Downes1998; Seghedi et al., Reference Seghedi, Balintoni and Szakacs1998). The relatively large volume of magma in the CGH chain was associated with asthenosphere uprise, explained by progressive break-off of the Miocene subducted slab (Mason et al., Reference Mason, Seghedi, Szakacs and Downes1998; Seghedi et al., Reference Seghedi, Balintoni and Szakacs1998). Otherwise, Seghedi & Downes (Reference Seghedi and Downes2011) suggested only a post-collisional setting, where a large volume of calc-alkaline magmas was formed at destructive boundaries along transtensional faults (e.g. at margins of the Transylvanian basin).
(a) Geotectonic sketch of the Carpatho–Pannonian area showing major tectonic units and boundaries and the main occurrence areas of the Neogene calc-alkaline volcanic rocks from the East Carpathians (Seghedi et al., Reference Seghedi, Balintoni and Szakacs1998, Reference Seghedi, Downes, Szakacs, Mason, Thirlwall, Rosu, Pécskay, Márton and Panaiotu2004). Legend: 1 = Outer Carpathians (Moldavide), Neogene–Quaternary sediments and flysch nappes; 2 = Pieniny klippe belt; 3 = Pre-Neogene rocks of the inner Alpine–Carpathian Mountains; 4 = Neogene calc-alkaline volcanic areas; 5 = major thrusts; 6 = strike-slip faults. (b) Geological map of the Cãlimani–Gurghiu–Harghita Mountains, where the central facies is constituted by enlarged central eroded volcanic depressions, the crater and/or caldera remnants and eruptive vents, whereas the proximal facies corresponds to lava flow piles and subordinate pyroclastic interbeds, which accompany the modified outer slopes of the volcanic edifices (Szakacs & Seghedi, Reference Szakacs and Seghedi1995). Legend: 1 = upper structural compartment (central or ‘core’ and proximal or ‘flank’ facies model); 2 = lower structural compartment (peripheral distal or volcanoclastic facies model, which surrounds the bases of the volcanoes); 3 = craterial area; 4 = centres of eruptions.

The volcanic structure of the CGH volcanic chain consists of the eroded central-summit part of the volcanoes, including the generally unroofed intrusive core complexes and related hydrothermal alteration halos, the crater and/or caldera remnants that form the central facies (Szakacs & Seghedi, Reference Szakacs and Seghedi1995). The anatomy of composite volcanic edifices comprises a proximal and distal facies with lava flows and pyroclastic interbeds.
The area north of the Harghita Mountains consisted of the complex volcanic structure of Vârghis–Harghita Bãi where the ‘caldera’ (‘horseshoe depression’) formation in the Vârghis region was formed by one or more edifice failures and debris avalanche events (Szakacs & Seghedi, Reference Szakacs and Seghedi1995). An independent and partially buried smaller edifice occurs at the Harghita Bãi (southeast of the main summit), where an intrusive core complex and its eastern flank are visible. The andesitic rocks of the intermediate zone of the Vârghis–Harghita Bãi volcanic structure range in age from 5.3 to 4.1 Ma, Upper Pliocene, Pontian–Dacian (Peltz et al., Reference Peltz, Vâjdea, Balogh and Pécskay1987).
The hydrothermal area of Harghita Bãi is the largest field of argillic alteration in the Neogene volcanic area of the Eastern Carpathians, where the magmatic–hydrothermal fluids generated an alteration halo (biotite → amphibole → propylitic → argillic) centred on the subvolcanic body, in which a possible porphyry copper system occurs (Stanciu, Reference Stanciu1984).
K-I and NH4,K-I clays (sample HB-9) were identified at –110 m outside of the breccia structure, whereas NH4-I (samples HB-18 and HB-12) occurs in the barren part of the hydrothermal breccia structure. The breccia consists of irregular andesite blocks hydraulically fractured and argillized, where NH4-I is the main clay mineral. The formation of NH4-I was related to the post-breccia evolution.
Materials and methods
Materials
Samples were collected from the mine drafts and shafts located at –110 m (sample HB-9), –94 m (sample HB-18) and –80 m (sample HB-12) underground outside and within the hydrothermal breccias. The locations of samples across and around the breccia structure were shown by Bobos & Eberl (Reference Bobos and Eberl2013).
Two representative samples containing the NH4-I-S mixed layer (samples HB-12 and HB-18) and one containing K-I + NH4,K-I physical mixtures (sample HB-9) were selected for XRD, IR spectroscopy, scanning electron microscopy (SEM) and TEM. The <2 µm clay fractions of samples HB-9 and HB-12 had previously been studied for isotope and trace element geochemistry (Clauer et al., Reference Clauer, Liewig and Bobos2010), sample HB-18 for structural, morphological and chemical studies (Bobos, Reference Bobos2012) and samples HB-9 and HB-18 for illite crystal thickness distribution (Bobos & Eberl, Reference Bobos and Eberl2013).
Sample HB-12 was revisited because greater amounts of Na2O than K2O were measured in the <2 µm clay fractions by flame atomic absorption spectroscopy (see Supplementary Material, available online) and related XRD patterns did not reveal a possible mixture with K-I. Sample HB-18 was selected due to a higher NH4+ content reported elsewhere (Bobos, Reference Bobos2012).
The andesitic samples with argillic alteration were crushed and sieved to a grain size of <177 µm. Then, the samples were chemically purified following the procedures described by Jackson (Reference Jackson1975). Briefly, the samples were treated with Na-acetate (NaOAc) to remove carbonate (pH = 5.5; T = 100°C). Both Fe- and Al-oxyhydroxides were removed using Na-dithionite and Na-citrate (pH = 7; T = ~80°C). Excess salt was removed from the <2 µm clay fraction by dialysis using distilled water. The <2 µm clay fraction was separated by successive dispersion and sedimentation cycles in distilled water according to the Stokes’ law. After extraction, the clay fractions were concentrated by centrifugation and re-dispersed with an ultrasonic probe.
Analytical techniques
X-ray diffraction
The oriented clay-aggregate specimens of the <2 µm fraction were prepared by clay suspension pipetting and drying onto glass slides. The XRD data were obtained in both an air-dried (AD) state and after ethylene glycol (EG) solvation with a Rigaku Giegerflex D/max C-series automated diffraction system (Institute of Earth Sciences, Porto, Portugal) using a graphite monochromator. Samples were analysed with Cu-Kα radiation in the range 2–50°2θ, using a 1° divergence slit, a step increment of 0.05°2θ and a counting time of 5 s/step.
The NEWMOD© computer program (Reynolds, Reference Reynolds1985) enables estimation of the %S and verification of the NH4-I-S structure behaviour based on the calculation of one-dimensional X-ray patterns. The data were acquired according to Moore & Reynolds (Reference Moore and Reynolds1997), where the maxima of the scattering amplitudes for K+ and NH4+ were 18 and 10 electron units, respectively. Layer charge, total fixed cation content, hydration/swelling behaviour and 001 reflection values obtained from chemical and X-ray data were used to simulate the X-ray patterns. Calculations of XRD patterns for NH4-I-S recorded were performed using three different configurations corresponding to the intercalation of zero, one or two water molecules in the smectite interlayer. This allowed the investigation of the NH4-I-S mixed layer, where various hydration states coexist. The relative proportions of each mixed layer and of each layer type were adjusted to fit the experimental XRD patterns.
Infrared spectroscopy
15 mm discs were prepared by mixing 1 mg of sample (<2 µm fraction) with 200 mg of KBr and then pressing at 14 kg/cm2. Prior to analysis, the pellets were heated overnight at 150°C to remove adsorbed water. The samples were studied in the absorption mode using a Bruker Tensor 27 spectrometer (Institute of Earth Sciences, Porto, Portugal) equipped with a deuterated triglycine sulfate single detector plate. The IR spectra were recorded in the 4000–400 cm–1 frequency region. The measurements of the integrated intensity of the vibration molecular bands were made with the OPUS 4.2® software supplied by Bruker.
Scanning electron microscopy
The rocks were crushed into small pieces (5–8 mm in diameter) and cleaned in an ultrasonic probe for SEM. The critical-point drying method was used (McHardy & Birnie, Reference McHardy, Birnie and Wilson1987) to preserve the textural morphology of clay minerals. The samples were mounted on a carbon holder and sputter-coated with a thin carbon film. The SEM study was performed with a Hitachi S-4100 electron microscope (DEMaC; University of Aveiro, Aveiro, Portugal) operated at an accelerating voltage of 25 kV and 5 nA beam current, equipped with an X-ray energy-dispersive spectral spectrometer (Oxford Instruments INCA Energy). A 200 nm spot size and 100 s of live time were used.
Transmission and analytic electron microscopy
Representative areas identified by optical microscopy of the matrix of the altered andesites containing K-I and NH4-I were selected from thin sections for TEM work. Very fine aggregated grains of NH4-I observed in thin section showed distinguishing optical features characterized by the low birefringence light interference colour, which was different from the usual optical features of hydrothermal sericite.
Uncovered thin sections were prepared and copper rings with a single central hole of 1 mm in diameter were glued to the sections. Then, the rings plus sample were detached through gentle heating. Selected areas were further thinned with a Gatan Dual Ion Mill 600 using an acceleration voltage of 6 kV in three steps: (1) incident angle of 15° and probe current of 1 nA; (2) incidence angle of 12° and probe current of 0.6 nA; and (3) incidence angle of 12° and probe current of 0.4 nA. Selected areas were ion thinned following the procedure of Nieto (Reference Nieto2002) and then carbon coated for TEM observations.
Two selected rings were taken from thin section of HB-9 (phyllic alteration and no brecciated rock sample) where three areas were labelled as specimens HB-9, HB-9a and HB-9a* for TEM-AEM investigation. Specimen HB-9 contains K-I and NH4,K-I intergrowths, specimen HB-9a contains NH4,K,Na-I and the specimen labelled HB-9a* contains NH4,Na,K-I.
A Philips CM-20 scanning transmission electron microscope (STEM) fitted with an EDAX solid-state detector for energy-dispersive analysis was used (Centro de Instrumentación Científica, University of Granada, Granada, Spain). The TEM was operated at 200 kV with a point-to-point resolution of 2.7 Å in the TEM mode. The procedures suggested by Buseck (Reference Buseck and Buseck1992) and Buseck et al. (Reference Buseck, Cowley and Eyring1988) were employed for the collection of TEM images and selected area electron diffraction (SAED) patterns.
Chemical analyses of the illite phases were made in STEM mode with an EDAX microanalysis system, where the quantitative chemical analyses were obtained only from thin edges. Areas for phyllosilicate analysis were selected on lattice-fringe images to control the textural position and to prevent contamination by other phases. The samples were tilted by 20° towards the detector. A 20 nm × 100 nm area, with the long axis oriented parallel to the phyllosilicate cleavage, was scanned using a 5 nm diameter beam. Albite, spessartine, muscovite, olivine, titanite and biotite were used to obtain K-factors for the determination of intensity ratios and concentration ratios (Cliff & Lorimer, Reference Cliff and Lorimer1975). Loss of alkalis (especially K+) is a significant problem in the analysis of defect-rich minerals (Van der Pluijm et al., Reference Van der Pluijm, Lee and Peacor1988); therefore, shorter counting times (30 s) were used as a compromise for K+ measurements (Nieto et al., Reference Nieto, Ortega-Huertas, Peacor and Arostegui1996). The concentration ratios were normalized to six cations in octahedral plus tetrahedral sites.
Results
X-ray diffraction
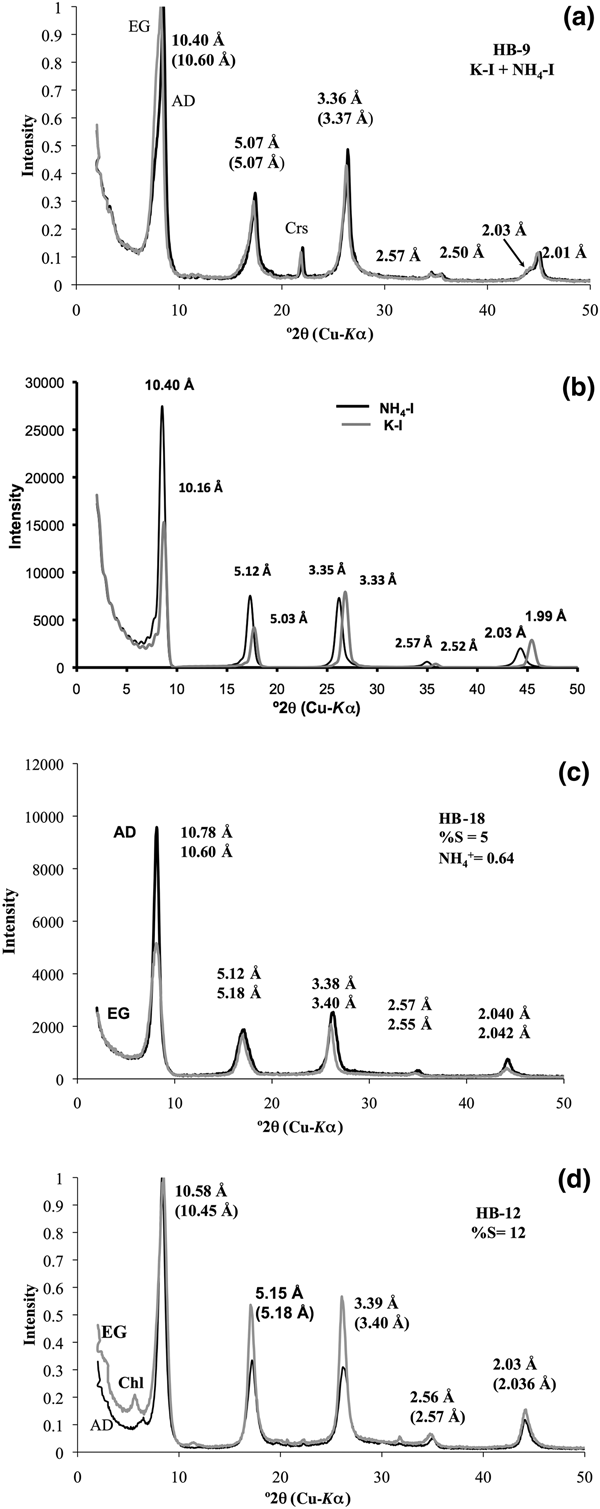
Sample HB-9 contains a physical mixture of K-I plus NH4,K-I (Fig. 2a) in the <2 µm fractions. The XRD pattern of the K-I/NH4,K-I shows the 001 peak at 10.40 Å, which expanded after the EG solvation at 10.60 Å, suggesting a few smectite layers interstratified within NH4,K-I (Fig. 2a). The intensity of the 001 peak of NH4,K-I is greater than that of K-I, which indicates that the expandability observed is clearly related to NH4,K-I. In addition, two distinct peaks are observed at 2.50 Å (K-I) and 2.57 Å (NH4,K-I) for the 004 diffraction, whereas the 005 peak occurs at 2.00 Å (K-I), with a shoulder at 2.03 Å (NH4,K-I) (Fig. 2a) that is well defined after the peak decomposition (see Supplementary Material).
(a) XRD patterns of the <2 µm clay fraction oriented specimens corresponding to NH4,K-I/K-I mixed phase. (b) XRD patterns of NH4-I and K-I were simulated (air-dried (AD) condition) using NEWMOD© code (Reynolds, Reference Reynolds1985). XRD patterns of NH4,K-I/K-I and NH4-I-S mixed layers with (c) 5%S and (d) 12%S were obtained in AD (black lines) and ethylene glycol (EG) state (grey lines). XRD patterns in (a), (b) and (c) were adapted after Bobos & Eberl (Reference Bobos and Eberl2013). Chl = chlorite; Crs = cristobalite.

The XRD patterns of K-I and NH4,K-I were simulated (Fig. 2b) by mixing two calculated patterns of K-I plus NH4-I (AD condition) and adding MIXER and MIX accessory data files of NEWMOD© code (Reynolds, Reference Reynolds1985). An assumption was that only NH4+ is fixed in NH4-I interlayers and K+ in K-I interlayers. The XRD patterns correspond to a mixed phase of NH4-I and K-I in approximately equal proportions. The 001 peak of NH4-I is higher than that of K-I in simulated XRD patterns of sample HB-9 (Fig. 2b). The 005 peak occurs at 2.06 Å (2.06 × 5.00 = 10.30 Å) for the end-member NH4-I, which would mean that only NH4+ occurs in the interlayer site. In our case, the 005 peak at 2.03 Å corresponds to NH4,K-I, and it was assumed that both NH4+ and K+ cations are distributed homogeneously in each illite interlayer. The proportion of each mineral phase in sample HB-9 is 47% NH4,K-I and 53% K-I according to the UnMIXER code (Eberl, Reference Eberl, Rule and Guggenheim2002).
The samples HB-18 and HB-12 represent NH4-I-S mixed layers with 5%S and 12%S, respectively. The XRD patterns of NH4-I-S (Fig. 2c,d) correspond to a mixed layer with one-water layer smectite (sample HB-18) and two-water layer smectite (sample HB-12). The estimated %S and the number of H2O molecules in the smectite interlayer were simulated from NEWMOD code (Reynolds, Reference Reynolds1985). The %S estimated in sample HB-12 represents a mean value between 15%S and 10%S. The NH4+ and K+ are homogeneously distributed in each illite interlayer corresponding to sample HB-18 (Bobos, Reference Bobos2012).
The 001 peaks of samples HB-9 and HB-12 were decomposed using the MacDiff code (Petschick, Reference Petschick2000). Two peaks were identified corresponding to K-I (10.03 Å) and NH4,K-I (10.45 Å) for sample HB-9, and only one peak was identified at 10.45 Å in sample HB-12 (see Supplementary Material). There is no evidence of any paragonitic layers in the illite structure.
Infrared spectroscopy
Infrared spectra show values of absorption bands characteristic of illite minerals (Fig. 3). Four absorption bands attributed to N–H stretching and bending are observed at 3340 cm–1, 3040 cm–1, 2840 cm–1 and 1430 cm–1 (the bending band is at 1430 cm–1). The absorption bands at 1430 cm–1 indicate the presence of NH4+ cations in illite, corresponding to the fundamental vibration (ν4) model for NH4+ (Chourabi & Fripiat, Reference Chourabi and Fripiat1981; Nadeau & Bain, Reference Nadeau and Bain1986; Petit et al., Reference Petit, Righi and Madejová2006). Small amounts of quartz (815 cm–1 and 775 cm–1) and cristobalite (796 cm–1 and 624 cm–1) were identified in the HB-9 and HB-18 samples (Fig. 3).
IR spectra of NH4,K-I + K-I (light grey line) and the NH4-I-S mixed layer: samples HB-12 (grey line) and HB-18 (black line). N–H-bending vibration occurs at 1430 cm–1. Crs = cristobalite; Q = quartz.

Ammonium was quantified (samples HB-9, HB-18 and HB-12) using the areas of the OH– stretching bands at 3640 cm–1 and the band vibration at 1430 cm–1, being then transformed to optical intensities of IOH and INH4 (Higashi, Reference Higashi2000; Drits et al., Reference Drits, Lindgreen, Sakharov, Jakobsen, Salyn and Dainyak2002). The NH4+ amounts estimated in illite crystals from the <2 µm clay fractions are 0.60 atoms per formula unit (apfu; sample HB-18), 0.52 apfu (sample HB-12) and 0.43 apfu (sample HB-9).
Scanning electron microscopy
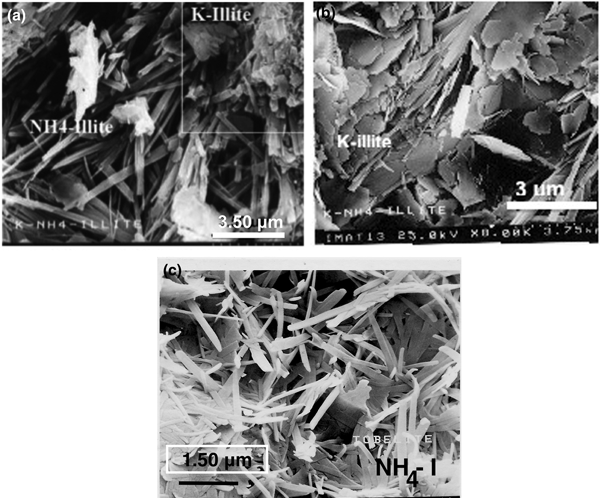
The illite minerals exhibit randomly oriented lath-like aggregates with variable widths in both HB-9 and HB-18 samples (Fig. 4). Two populations of illite aggregates with distinct morphologies were recognised in the HB-9 sample. Oriented crystals with a lath-shaped morphology and a smaller K+ content correspond to NH4-I (Fig. 4a). The other population attributed to K-I is composed of small pseudohexagonal platy aggregates (quadrangle area in Fig. 4a) and detailed platy aggregates (Fig. 4b). The lath-shaped crystals NH4-I (5%S) are up to 2 µm long, also displaying a random orientation (Fig. 4c).
SEM images of NH4,K-I + K-I (sample HB-9) (a, b) and NH4-I (sample HB-18) (c).

Transmission electron microscopy
Low-magnification TEM images (Fig. 5) were obtained on K-I/NH4,K-I (sample HB-9) and NH4-I-S mixed layers (samples HB-18 and HB-12), respectively. Sample HB-9 (Fig. 5a) exhibits randomly oriented NH4,K-I/K-I packets with thicknesses estimated from 950 to 5000 Å. The TEM images (Fig. 5b,c) of NH4-I-S (samples HB-18 and HB-12) show a texture composed of thin, randomly oriented packets with a size estimated from 350 to 1400 Å (sample HB-12) and from 300 to 700 Å (sample HB-18). In addition, a chaotic intergrowth of curved packets and abundant pore spaces occurs between packets (Fig. 5b,c).
Low-magnification TEM images showing an overview of NH4,K-I + K-I (a) and the NH4-I-S mixed layer with 5%S (b) and 12%S (c). Randomly oriented packets of NH4,K-I/K-I (a) and a typical texture of ‘tobelitic’ rocks with chaotic intergrowths, open space pores and randomly thin oriented packets (b, c).

Specimen HB-9: K-I and NH4,K-I
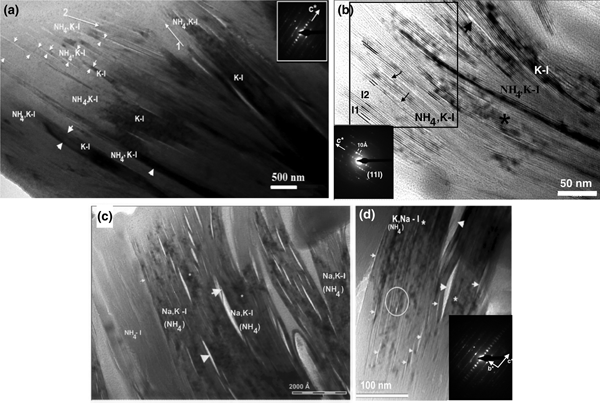
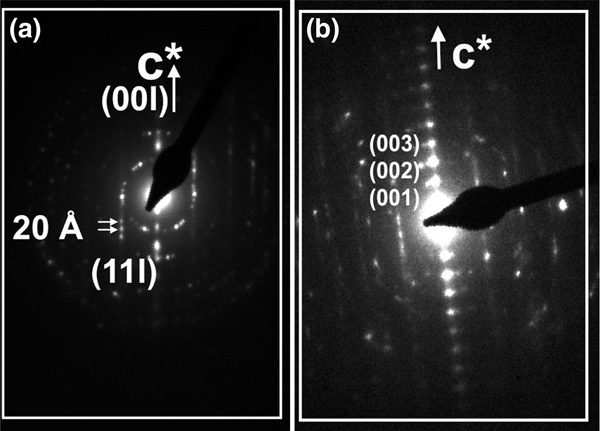
Low-magnification TEM images show subparallel individual packets of K-I and NH4,K-I exhibiting dark and light contrast, respectively (Fig. 6a). In addition, contrast is strongly observed along the NH4,K-I packets. The interface between NH4,K-I packets is defined by lines with light contrast or by sparingly abundant collapsed layers in the top left corner (Fig. 6a, labelled with small arrowheads). The thicknesses of NH4,K-I packets range from 200 to 500 Å. In addition, slightly different orientations of illite packets are observed (Fig. 6a); namely, thin NH4,K-I packets show a different orientation (arrow 2) from the subparallel packets of K-I and NH4,K-I (arrow 1). The NH4,K-I and K-I packets (Fig. 6a,b) were also analysed by AEM (Table 1). The SAED pattern of NH4,K-I (Fig. 6a) corresponds to a one-layer polytype with abundant stacking disorder, where 001 reflections show a 10 Å periodicity.
(a) TEM image of subparallel K-I and NH4,K-I packets (specimen HB-9) exhibiting dark and light contrast. Packets of illite with slightly different orientations are labelled with arrows 1 and 2. Collapsed smectite-like layers are indicated by the small arrowhead (left corner), whereas a net contact between packets is labelled with large arrowheads. The SAED pattern of NH4,K-I shows a one-layer polytype with abundant stacking disorder. (b) TEM image of K-I (darker contrast) and NH4,K-I interleaved packets. High-strain fields (marked with the asterisk) and narrow voids (labelled with the large arrowhead) are highlighted. Change in contrast of lattice fringes and differences in spacing of some NH4,K-I layer sequences (quadrangle area) are typical of the presence of smectite-like layers where I-S individual units (I) are shown (I1 for 20–21 Å periodicity and I2 for ~31 Å periodicity). Lattice fringes in the NH4,K-I packets are subparallel and discontinuous as a result of smectite-like layer dehydration (labelled with small arrowheads). The SAED pattern shows a 1M polytype. (c) TEM image showing NH4,Na,K-I packet intergrowths (specimen HB-9a*) with straight interfaces parallel to basal planes. Lenticular pores or lens-like separation (labelled with arrowheads) occur along the basal planes between NH4,Na,K-I packets, and high-strain fields (lattice distortion) are marked by an asterisk. (d) The NH4,K,Na-I packets (specimen HB-9a) observed by TEM, where lenticular-layer separation (labelled with large arrowheads) and lattice fringes with structural imperfections at the fine scale corresponding to dislocation and different periodicity (labelled with a circle) are highlighted. Narrow voids are labelled with small arrowheads. The SAED pattern exhibits a 1M d polytype.

Crystal chemistry of K-illite and NH4,K-illite (specimen HB-9), NH4,Na,K-illite (specimen HB-9a*) and NH4,K,Na-illite (specimen HB-9a) crystals analysed by analytic electron microscopy.

Figure 6b shows K-I packets interleaved with a few NH4,K-I packets. Variable degrees of curvature of K-I and NH4,K-I packets and continuous lines with light contrast are observed (Fig. 6b, small arrowheads). K-I packets show fringes with 10 Å spacing (Fig. 6b), lattice distortion, high-strain fields (labelled with an asterisk) and few voids (labelled with a large arrowhead). Differences in contrast and spacings of lattice fringes (Fig. 6b) are typical of smectite-like layers within I-S sequences (Guthrie & Veblen, Reference Guthrie and Veblen1989; Veblen et al., Reference Veblen, Guthrie, Livi and Reynolds1990). Lattice fringes are subparallel and discontinuous as a result of dehydration of smectite-like layers (quadrangle area, Fig. 6b). The SAED pattern shows a 1M polytype with a 10 Å periodicity for all 00l rows (Fig. 6b).
Specimens HB-9a* and HB-9a: NH4,Na,K,-I and NH4,K,Na-I
The NH4,Na,K-I packets (Fig. 6c) correspond to specimen HB-9a* from the AEM data (Table 1), where the Na+ content is greater than that of K+. Low-magnification TEM images show a well-defined textural relationship between subparallel packets (Fig. 6c). The contrast is sharp between the packets of different illitic composition and well-defined boundaries occur between these packets. However, the pore spaces and lenticular layer separations (Fig. 6c, large arrowheads) occur along the boundaries between the NH4,Na,K-I packets, where fissures along boundaries and thin lens or lenticular-layer separations are developed. Similar fissures and lenses observed in K-micas were attributed to electron-beam damage of paragonite layers (Ahn et al., Reference Ahn, Peacor and Essene1985; Jiang & Peacor, Reference Jiang and Peacor1993). The widths of the lenses range between 60 and 240 Å, whereas the thicknesses of NH4,Na,K-I packets range from 300 to 1200 Å.
The TEM images of NH4,K,Na-I packets (specimen HB-9a) also show lenticular-layer separation (Fig. 6d, labelled with the large arrowheads) and lattice fringes with structural defects at the fine scale. Semi-coherent boundaries with defects in which the lattice fringes are mismatched were observed in NH4,K,Na-I packets (labelled with a circle). The SAED pattern reflects disordered stacking sequences (Fig. 6d).
Sample HB-18: NH4-I, 5%S
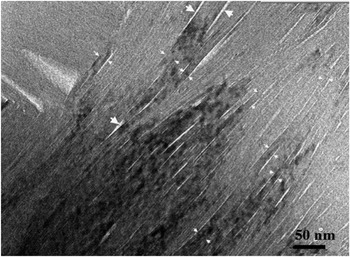
Lattice fringes show straight packets, sharp boundaries and continuous 00l layers (Fig. 7). Bright fringes of apparently collapsed smectite interlayers (labelled with small arrowheads) occur between the boundary of NH4-I packets. Well-defined parallel packets formed by ~10 Å spacing layers often end abruptly by wedging out, becoming subparallel and thinner. Inclined interfaces to basal planes of NH4-I associated with layer termination and low-angle boundaries between the crystallites (labelled with large arrowheads) are clearly observed. The thicknesses of NH4-I packets range from 20 to 95 Å, with most being in the range of 30–70 Å.
TEM image of NH4-I (5%S) packets (sample HB-18) showing straight interfaces parallel to the basal planes, where collapsed swelling layers (labelled with small arrowheads) occur at the boundary of individual packets together with low-angle boundaries between crystallites (labelled with big arrowheads).

The sequence of packets shows variable spacing and contrast, where some lattice fringes are uniformly darker than lighter adjacent ones. Parallel to subparallel packets with dark and light contrast exhibit either 20 or 10 Å spacing layers. The SAED patterns show 20 Å periodicity corresponding to the 2M 1 polytype (Fig. 8a) or the one-layer polytype with abundant disordered stacking (Fig. 8b).
SAED patterns corresponding to the (a) 2M 1 and (b) 1M d polytype with stacking of disordered NH4-I packets (sample HB-18).

Sample HB-12: NH4-I-S/NH4,Na,K-I
Low-magnification TEM images of illite packets show chaotic orientation, open pore spaces, high porosity and differences in contrast that alternate from light to dark, where the lattice fringes of NH4-I-S are interleaved with NH4,Na,K-I packets (Fig. 9a). The low-magnification TEM image of a selected area with light contrast shows well-oriented NH4-I-S packets with elongated voids along the boundary between packets (Fig. 9b). The lack of contrast between NH4-I-S packets reflects the parallel to subparallel relative orientation of layers with a mean thickness of packets of ~40–45 Å. In addition, a few K-I layers (Fig. 9b, labelled with small arrowheads) show a difference in contrast from NH4-I-S. The SAED pattern of the NH4-I-S shows 00l diffraction spots corresponding to a 1M d polytype (Fig. 9b, inset).
(a) Low-magnification TEM image of NH4-I-S and NH4,Na,K-I packets (sample HB-12) showing chaotic orientation and open pore spaces. Textural relationship between NH4-I-S and NH4,Na,K-I packets is highlighted by light and dark contrast. (b) Low-magnification image of NH4-I-S packets (sample HB-12) showing parallel to subparallel orientation of packets and elongated voids caused by NH4+ volatilization due to ion beam damage. A few K-I layers interstratified with NH4-I-S are labelled with small arrowheads. The SAED pattern shows a 1M d polytype.

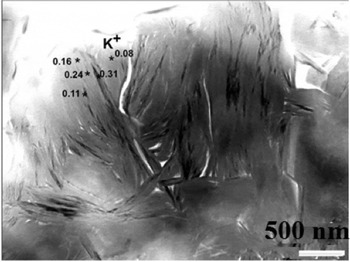
The contrast differences between NH4-I-S and NH4,K-I packets reflect their varying compositions. The packets with light contrast attributed to NH4-I-S contain a very small amount of K+ and presumably larger amounts of NH4+. The amounts of K+ measured in various packets of sample HB-12 with dark and light contrast are shown in Fig. 10.
Differences of contrast between packets of sample HB-12 and the variation in the K+ content measured in several locations.

Analytic electron microscopy
The chemical compositions of K-I and NH4,K-I (specimen HB-9), NH4,Na,K-I (specimen HB-9a*), NH4,K,Na-I (specimen HB-9a) and NH4-I-S mixed layers (samples HB-18 and HB-12) show large compositional variation (Tables 1, 2) in alkali elements.
Crystal chemistry of NH4-illite (sample HB-18) and NH4,Na,K-illite (sample HB-12) crystals analysed by analytic electron microscopy.

The mean value of NH4+ fixed in illite for the <2 µm fractions of NH4-I-S in samples HB-18 and HB-12 is 0.60 apfu (Bobos, Reference Bobos2012) and 0.52 apfu (see Supplementary Material), respectively. In addition, the NH4+ estimated for the NH4,K-I (sample HB-9) is ~0.43 apfu (Clauer et al., Reference Clauer, Liewig and Bobos2010). The Na+ and K+ contents determined by flame photometry in the <2 µm clay fraction of NH4-I-S (samples HB-18 and HB-12) and the K-I/NH4,K-I mixture (Clauer et al., Reference Clauer, Liewig and Bobos2010; Bobos, Reference Bobos2012) are comparable with the AEM data obtained in this study.
A synthesis of the results of the main structural (XRD plus SAED), morphological (SEM), textural (TEM) and chemical (mean values of Si, AlIV, FM (Fe + Mg), K+ and Na+ determined by AEM) characteristics of illite species described in this work is shown in Table 3.
The main structural (XRD + SAED), morphological (SEM), textural (TEM) and chemical (mean values of Si, AlIV, FM (Fe + Mg), K+ and Na+ measured by AEM) characteristics of the samples analysed.

NA = not analysed.
Specimen HB-9: K-I and NH4,K-I
Two populations of K-I (K+ = 0.63–0.78 apfu) and NH4,K-I (K+ = 0.24–0.36 apfu) with variable compositions in alkali elements were identified in a single ion-milled sample (Fig. 6a,b). If we consider a total interlayer charge of 0.75/O10(OH)2 for a theoretical end-member NH4-I (Drits et al., Reference Drits, Lindgreen and Salyn1997a), the NH4+ may range in NH4,K-I packets from 0.39 to 0.51 apfu with a mean value of 0.45 apfu. This mean value was assumed after the recalculation of the structural formula including the NH4+ content estimated for the free interlayer space. Si ranges from 3.19 to 3.55 apfu with a mean value of 3.37 apfu in the NH4,K-I packets, whereas the Altot ranges from 2.30 to 2.65 apfu (mean value: 2.48 apfu). Small amounts of Fe (~0.03 apfu) and Mg (~0.10 apfu) were identified in the NH4,K-I packets.
Specimens HB-9a* and HB-9a: NH4,Na,K-I and NH4,K,Na-I
A greater Na+ content than K+ was measured in illite packets of specimen HB-9a* (Table 1). Si ranges from 3.12 to 3.82 apfu with a mean value of 3.47 apfu and the Altot from 2.20 to 2.65 apfu with a mean value of 2.43 apfu. A low Mg2+ content of 0.03–0.17 apfu was determined and Fe ranges between 0 and 0.17 apfu (mean value: 0.09 apfu), whereas the FM varies from 0.05 to 0.26 apfu (mean value: 0.16 apfu). The mean value of K+ is 0.08 apfu, whereas the mean Na+ value is 0.25 apfu. The sum of K plus Na ranges from 0.20 to 0.53 apfu with a mean value of 0.35 apfu. The estimated NH4+ content may range from 0.22 to 0.56 atoms/O10(OH)2 for NH4,Na,K-I, with a mean value of 0.39 apfu. The existence of minor Ca2+ (0.02–0.07 apfu) is consistent with the presence of few smectite layers.
The NH4,K,Na-I population containing more K+ (mean value: 0.28 apfu) than Na+ (Na+ ranges from 0.05 to 0.16 apfu with a mean value of 0.11 apfu) was identified in specimen HB-9a (Table 1). Large amounts of Si (3.60 apfu) were detected, with the AlIV/Si ratio (0.11) being smaller than that of the NH4,Na,K-I sample. The mean value of Altot is 2.19 apfu, Fe is low (mean value: 0.02 apfu), Mg2+ ranges from 0.10 to 0.15 apfu and FM ranges from 0.12 to 0.18 apfu with a mean value of 0.15 apfu. This variation in alkalis and FM suggests a chemical disequilibrium.
Sample HB-18: NH4-I, 5%S
A slightly greater amount of Si (mean value: 3.41 apfu) than the amount reported previously (3.35 apfu) was identified for the <2 µm clay fractions (Table 3). The mean value of Altot is 2.37 apfu, the AlIV/Si ratio is 0.17 and K+ is 0.15 apfu. The remaining site in the interlayer is compensated by NH4+ only. If the structural formula is recalculated by assuming the NH4+ cations fixed in the interlayer sites, the crystal chemistry obtained by AEM seems to be the same as the chemical composition previously reported for the <2 µm clay fractions (Bobos, Reference Bobos2012).
Sample HB-12: NH4,Na,K-I and NH4-I-S, 12%S
The mean value of Si is 3.55 apfu, the AlIV/Si ratio is 0.12 and the Altot ranges from 1.97 to 2.46 apfu (mean value: 2.20 apfu). The Mg2+ content is 0.18 apfu and there is a small amount of Fe (~0.02 apfu), whereas the FM ranges from 0.17 to 0.28 apfu (mean value: ~0.19 apfu). A greater amount of Na+ (~0.14 apfu) than K+ (~0.07 apfu) was detected in these packets. The Na plus K ranges from 0.15 to 0.36 apfu with a mean value of 0.22 apfu, and the Na/K ratio ranges from 0.25 to 5.53 (mean value: ~1.75). The interlayer cation deficiency suggests the existence of variable amounts of interlayer vacancies filled in part by NH4+. The NH4+ content is estimated to range from 0.41 to 0.60 apfu, with a mean value of 0.53 apfu.
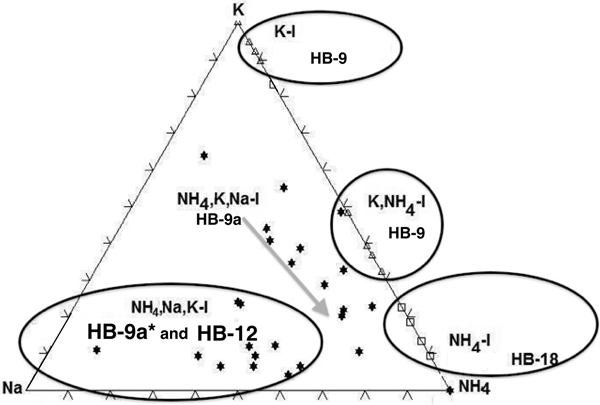
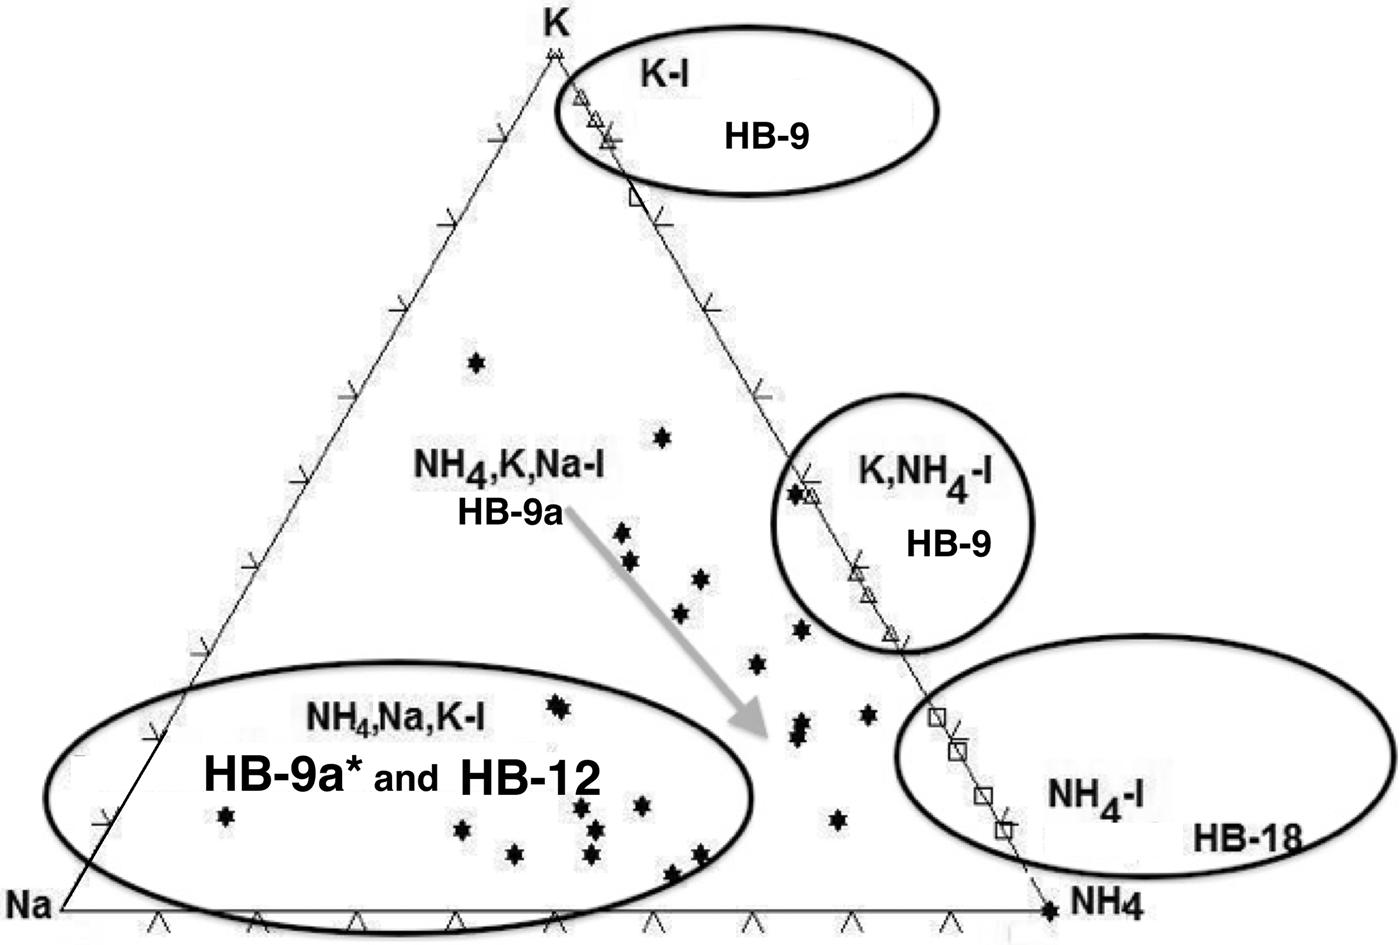
The amounts of fixed interlayer cations of the samples (HB-9, HB-12 and HB-18) were plotted in the ternary diagram of Na+–K+–NH4+ (Fig. 11). Five distinct fields were identified corresponding to K-I, K,NH4-I, NH4,K,Na-I, NH4,Na,K-I and NH4-I-S populations identified in the analysed samples.
The ternary diagram of K–Na–NH4 showing the fields of K-I, NH4,K-I, NH4,K,Na-I, NH4,Na,K-I and NH4-I (5%S).
Discussion
Structural features
The XRD pattern of sample HB-9 confirms the presence in the <2 µm clay fractions of two distinct mineral phases: NH4,K-I and K-I. The peaks at 2.50 Å (004 diffraction plane) and at 2.00 Å (005 diffraction plane) (Fig. 2a) correspond to K-I, whereas the 2.57 and 2.03 Å peaks correspond to NH4,K-I or NH4,Na,K-I packets identified by TEM-AEM, respectively. Theoretically, the interval ranging between 44 and 46°2θ would show the peak of K-I (100%) at 2 Å and that of 100% NH4-I at 2.06 Å. The XRD pattern did not suggest the presence of a third possible interlayer cation, which in general is difficult to detect by powder XRD (Drits, Reference Drits2003). Apparently, most of the Na+ is included as a minor cation in the crystal structures of the other two phyllosilicates, and any real paragonitic domains, if they are present, are not sufficiently abundant to be detectable in the XRD traces.
The NH4-I (5%S) contains a large amount of NH4+ cations fixed in the interlayer, as is also indicated by the 005 peak position at 2.04 Å. The sample HB-12 contains a mixture formed by NH4-I-S (12%S) and NH4,Na,K-I (Na+ > K+) identified in the TEM-AEM data (Table 2). Nevertheless, the XRD trace shows only a typical pattern of NH4-I-S mixed layers (R3 with <15%S), in which the 005 peak at 2.03 Å suggests the presence of NH4-I-S (NH4+ = 0.5 apfu) and NH4,K-I, whereas the existence of the third component rich in Na+ was not detectable as an independent mineral.
The NH4-I-S samples may be considered equivalent to those described previously by Drits et al. (Reference Drits, Sakharov, Salyn and Lindgreen2005) as group II, in which K+ and NH4+ are distributed homogeneously in each mica-like interlayer, and the structural varieties may have different contents of NH4+ and K+. This was also shown for the NH4-I-S series described by Bobos (Reference Bobos2012). By contrast, the NH4,K-I mixed layer might correspond to group I of Drits et al. (Reference Drits, Sakharov, Salyn and Lindgreen2005), in which 9.98 Å K-bearing and 10.33 Å NH4-bearing layers contain either K+ or NH4+. Interstratification of the layer type may be random or have some tendency for ordering. Nevertheless, the presence of Na+ makes the samples different from those reported in the literature.
Nanotextural characteristics
The NH4-I-S samples formed at a grade compatible with the persistence of small amounts of smectitic layers represent the first description at a lattice scale studied using TEM-AEM. The identification of samples containing both K-I and NH4,K-I phases is also new in terms of the presence of NH4,K-I packets in geological environments not linked to organic-rich sedimentary or low-grade metamorphic rocks. Finally, the presence of Na+ as a third major interlayer cation in the NH4,K-I is also reported for the first time in the nanotextural study. The Na+ was only reported in the NH4,Na,K-I packets by AEM, where Na–K or K–Na bulk composition may form domains in the interlayer sites (Livi et al., Reference Livi, Christidis, Árkai and Veblen2008). The presence of Na-illite or brammallite (Bannister, Reference Bannister1942) was not detected in the XRD patterns.
Specimen HB-9 (K-I and NH4,K-I) shows textural relationships (Fig. 6a) similar to the TEM images of Nieto (Reference Nieto2002), where NH4- and K-mica were identified as individual packets intergrown in very-low-grade metapelites. An unusual diffuse contrast feature is commonly observed along some elongated areas of NH4,K-I packets with layers exhibiting gradual change in contrast across their length in the same packet. Otherwise, the alternating dark and light contrast of lattice fringes observed in Fig. 6a is typical of I-S minerals (Guthrie & Veblen, Reference Guthrie and Veblen1990; Veblen et al., Reference Veblen, Guthrie, Livi and Reynolds1990; Bauluz, Reference Bauluz, Nieto and Livi2013). In addition, the K-I packets are well distinguished from the NH4,K-I packets, where a diffuse contrast across the layers is observed (Fig. 6b). Furthermore, the SAED pattern of the NH4,K-I shows the 1M d polytype (Fig. 6a) or typical reflections for a 1M polytype (Fig. 6b).
The NH4,Na,K-I packets (specimen HB-9a*) display lens-shaped voids or lenticular-layer separation between boundaries (Fig. 6c), showing a different textural relationship from the NH4,K-I packets described previously. The areas associated with the high-strain fields may be attributed to the formation of fissures, lenses or lenticular layers owing to the different diffusion rates for K+ and Na+ (Ahn et al., Reference Ahn, Peacor and Essene1986). Lenses or lenticular-layer separation (which vary in size from a few tens to hundreds of ångstroms) may be produced by the heterogeneity induced by diffusion rates of cations, where higher mobility of Na+ is inferred compared to K+ in interlayer sites (Ahn et al., Reference Ahn, Peacor and Essene1986). The instability of NH4,Na,K-I packets under electron beam relative to NH4,K-I may be also related to Na+ and H2O, besides NH4+. The SAED pattern shows a single one-layer disordered polytype with one set of 00l reflections corresponding to ~10 Å periodicity (Fig. 6d).
Crystallization of the NH4-I (sample HB-18) occurred in a permeable system (breccia structure) with a high-fluid water circulation and represents the end member from a NH4-I-S series identified in the hydrothermal system of Harghita Bãi. Low-magnification TEM images of tobelitic rocks show a typical texture of open-space pores, suggesting direct crystallization of NH4-I from a pore fluid, where NH4-I-S packets occupy void spaces previously filled by fluids. In hydrothermal systems with a high water/rock ratio, dissolution occurs on a massive scale, with transport of dissolved components to distant sites where direct crystallization from solution may take place (Yau et al., Reference Yau, Peacor, Beans, Essene and McDowell1988).
The NH4-I packets show thicknesses ranging from 50 to 70 Å with an average of ~60 Å. This value is in agreement with the values of 65–68 Å for the <2 µm clay fractions (sample HB-18) measured by Bobos & Eberl (Reference Bobos and Eberl2013). The NH4-I (sample HB-18) consists of packets of relatively undeformed layers with fewer defects and smaller thicknesses, in which the packets occur either as separate particles or as stacks of particles with expandable interfaces (i.e. smectite interlayers). Various illitic packets are probably not always terminated by a smectitic interlayer due to the small proportion of smectite interlayers (5%) as measured by XRD. This scenario would produce packets formed of a large number of illitic layers. Hence, the domains separated by two smectitic layers in turn need to be internally separated into more than one illite crystalline domain showing differences of orientation.
The SAED pattern of NH4-I in sample HB-18 (Fig. 8a) shows slightly streaked rows of reflections owing to the small crystallite size and volatilization of NH4+. In addition, the 00l streaks showing the first three spots more intense in magnitude observed in SAED pattern (Fig. 8b) should be a characteristic of NH4-I minerals (Nieto, Reference Nieto2002). Various polytype sequences of one- and two-layer stacking orders identified in this sample may also generate a periodic contrast between adjacent layers shown in TEM images (Jiang et al., Reference Jiang, Peacor, Merriman and Roberts1990b).
Overall, 1M d, 1M and 2M 1 polytypes were identified in the studied samples for NH4,K-I, NH4,Na,K-I and NH4-I-S, with each illite packet showing distinct textural relationships, chemical characteristics or sizes. The identification of the 1M d polytype is the result of a disordered arrangement of the interlayer-stacking angle in a series of successive layers as a consequence of interlayer stepwise changes (Chen & Wang, Reference Chen and Wang2007; Nieto et al., Reference Nieto, Mellini and Abad2010). Accordingly, the two polytypes, 1M and 2M 1, coexist within the same domain as randomly faulted sequences, whereas the 1M d polytype results from the fine intergrowth of the various polytypes. Changes in stacking sequences are not accompanied by changes in composition, and polytypism varies not only between the grains, but also within individual grains (Baxter-Grubb et al., Reference Baxter-Grubb, Peacor and Jiang1991).
Synthetic tobelite samples analysed by the Rietveld method contain 1M, 2M 1 and 2M 2 polytypes (Harlov et al., Reference Harlov, Andrut and Poter2001) or 1M, 2M 1, 2M 2, 3T and 2Or polytypes (Pöter et al., Reference Pöter, Gottschalk and Heinrich2007; Watenphul et al., Reference Watenphul, Wunder and Heinrich2009). Recently, Capitani et al. (Reference Capitani, Schingaro, Lacalamita, Mesto and Scordari2016) identified the 2M 2 polytype (alternating ±60° rotations of the tetrahedral–octahedral–tetrahedral layers) by SAED in a tobelite sample collected from sedimentary rocks of the Armorican sandstones, where numerous stacking faults parallel to the (001) plane were observed.
However, it is not clear whether the various polytypes identified by XRD studies exist as single crystals or are intergrown domains within one single crystal (Harlov et al., Reference Harlov, Andrut and Poter2001). In addition, experimental data reported by Drits & Zvyagina (Reference Drits and Zvyagina2009) confirm only two main polytypes (i.e. 1M and 2M 1) in K-I, which seems not to be the case for NH4+-I.
Chemistry
The average compositions determined by AEM for the various specimens are in agreement with the chemical compositions of the <2 µm fractions (Bobos, Reference Bobos2012). Chemical data (Tables 1, 2) show that those compositions have, on average, very scattered values for all elements. The compositions of NH4,K-I, NH4,Na,K-I or NH4,K,Na-I grains span a wide range. Various specimens of the same sample HB-9 (i.e. HB-9, HB-9a* and HB-9a) studied by TEM show systematic chemical differences (Table 3), which are not related to various crystallite sizes, various textural positions or various polytypes.
Initially, I-S (R0, R1) tends to have a larger FM content and a smaller AlIV/Si ratio at the onset of the smectite illitization reaction, but near the final stages, crystals have a larger AlIV/Si ratio and a smaller FM content in a prograde sequence regardless of their formation environment (Boles & Franks, Reference Boles and Franks1979). This is also confirmed in the NH4-I-S series (Bobos, Reference Bobos2012), where the AlIV/Si ratio increased from 0.095 to 0.210 and FM decreased from 0.31 to 0.16 apfu.
The NH4,Na,K-I (Na > K or K > Na) packets identified suggest different conditions of crystallization from those of NH4-I-S (samples HB-18 and HB-12). The coexistence of the dioctahedral illite-like phases (K-I, NH4,K-I, NH4,Na,K-I with Na > K or K > Na) in sample HB-9 is a clear indication of non-equilibrium conditions (Árkai et al., Reference Árkai, Livi, Frey, Brukner-Wein and Sajgo2004). The fixed interlayer cation distribution in the ternary diagram of K–Na–NH4 confirms the various chemical trends and mineralogical reactions in the crystallization of NH4-I minerals (Fig. 11).
Small domains of paragonite, muscovite and tobelite layers were described by Árkai et al. (Reference Árkai, Livi, Frey, Brukner-Wein and Sajgo2004). The NH4+ has an ionic radius that is greater than those of K+ and Na+, and the differences in size render the coexistence of various cations in the same interlayer unstable due to structural incompatibilities produced by the different geometries necessary for each cation. The overall model of interlayer cation distribution is compatible with the existence of solvus relationships due to the significant differences in size among the three cations, where the size of the solvus decreases with increasing temperature.
A new model characterized by an intermediate step of homogeneous composition to paragonite formation called the disordered compositionally intermediate was proposed by Livi et al. (Reference Livi, Christidis, Árkai and Veblen2008), where the paragonite formation would involve some exsolution and/or recrystallization at high temperature. This model was based on the lattice-fringe image of mixed paragonite/muscovite crystals exhibiting domain structures (Livi et al., Reference Livi, Veblen, Ferry and Frey1997; see also: Shau et al., Reference Shau, Feather, Essene and Peacor1991; Jiang & Peacor, Reference Jiang and Peacor1993; Li et al., Reference Li, Peacor, Merriman and Roberts1994; Giorgetti et al., Reference Giorgetti, Tropper, Essene and Peacor2000; Árkai et al., Reference Árkai, Livi, Frey, Brukner-Wein and Sajgo2004).
Conclusion
Illite clays from the Harghita Bãi hydrothermal area contain a large proportion of organic N as NH4+ and serve as tracers of the mobility of organic–sedimentary components from the upper continental crust. Nitrogen from various organic sediments from the volcano–basement interaction was transferred into the volcanic continental arc, reflecting a complete palaeo-biogeochemical cycle. The NH4+ fixation in illitic clays is useful in estimating the N input fluxes based on knowledge of the rates of NH4+ retained in illitic clays, where the fraction of N fixed in illitic clays is likely to be greater than in other hydrothermal areas where NH4+ was detected.
The samples studied show various textural relationships and structural and chemical differences, suggesting various fluid compositions and multiple events or time-dependent hydrothermal events. Segregation of immiscible NH4+, K+ and Na+ cations is interpreted as probably being due to ‘nanodomains’ in the illite packets. In fact, the presence of ‘nanodomains’ suggests that NH4+ and K+ or even Na+ cations might randomly coexist in the illite interlayer structure, where a 1M d polytype characterizes the NH4,K,Na-I and NH4,K-I packets.
The TEM observations of NH4-I-S show stacks of particles that contain NH4-I, with collapsed layers interpreted as smectite interlayers, where a prograde sequence from 1M d to 1M and 2M 1 polytypes may be assumed. A large amount of NH4+ was fixed in a new illite structure, where dissolution–crystallization is a dominant mechanism for the NH4-I-S clays that operated at a variety of scales in a saturated water system.
Supplementary material
To view supplementary material for this article, please visit https://doi.org/10.1180/clm.2019.4
Acknowledgements
The author is indebted to Prof. Fernando Nieto (University of Granada, Spain), who made possible this research in CIC – University of Granada, and acknowledges him for help with interpretation of the TEM-AEM data, for many extensive suggestions and for critical reading of the manuscript. Thanks are due to Dr M. Abad-Ortega for her technical help during the electron microscopy process and to Isabel Nieto for sample preparation. The author thanks Prof L.B. Williams (ASU-Tempe, USA), who kindly read and polished the English of the text.
The draft benefitted from the excellent constructive review of an anonymous reviewer, which greatly improved an earlier version of the manuscript. In addition, the reviews of Prof B. Segvic (Texas Tech University, Lubbock, USA) and Prof S. Potel (Institute Polytechnique UniLaSalle, Beauvais, France) are greatly appreciated. The author is very grateful to Prof G. Christidis (editor-in-chief) for critical reviews, suggestions and careful editorial input.