We use the evolutionary world-systems perspective (Chase-Dunn and Hall Reference Chase-Dunn and Hall1997; Chase-Dunn and Lerro Reference Chase-Dunn and Lerro2014) to compare relatively small regional world systemsFootnote 1 with larger continental and global systems in order to study sociocultural evolution. The concepts of the world-systems perspective as developed by Immanuel Wallerstein and others have been broadened to be useful for the analysis of precapitalist economic systems, including stateless regional systems. Thus we must be able to abstract from scale in order to examine changes in the structural patterns of small, medium, and large whole human interaction networks. But in this article we focus on medium-term change in the scale of settlements.Footnote 2
In the long run human settlements have tended to get larger, but our research focuses on medium-term sequences of growth and decline in order to identify those upward sweeps (upsweeps) in which their scale significantly increased. Accurate identification of these events will facilitate our understanding of sociocultural evolution because these are the events that were an important part of the long-term trend toward larger and more complex human social institutions.Footnote 3
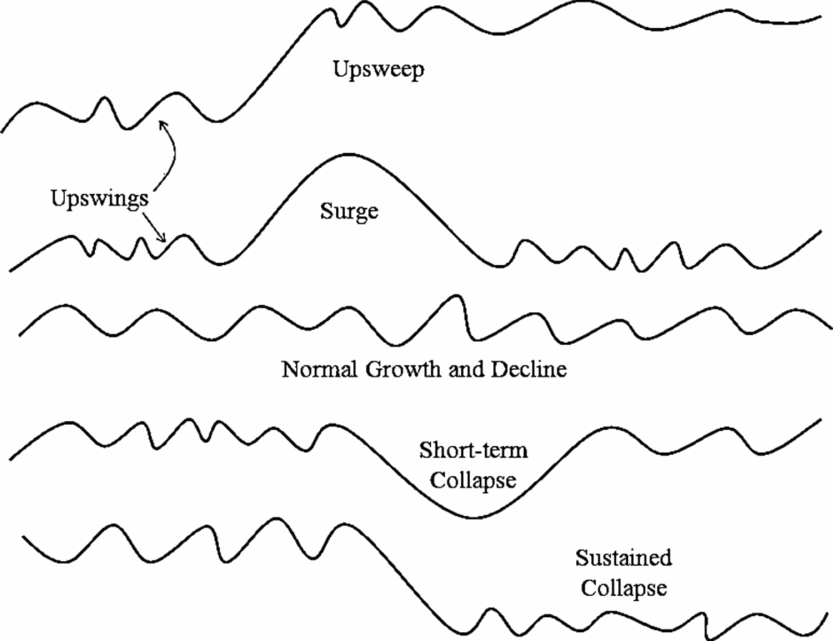
World systems are interacting sets of politiesFootnote 4 and settlements. And many, but not all, world systems are organized as core/periphery hierarchies in which some polities exploit and dominate the populations of other polities. Semiperipherality is an intermediate position within such a core/periphery hierarchy. When we study whole systems we see that they all oscillate in what we call a normal cycle of growth and decline (see figure 1). The largest settlement in each region reaches a peak size, declines, and then this or another settlement returns to the peak size again. These cycles are usually not observed by looking at single settlements in isolation, but rather by looking at the largest settlement within a region of interaction.Footnote 5
Types of medium-term scale change in the largest settlement in an interacting set of polities

In figure 1 the normal cycle of growth and decline is half way down the figure and is labeled “normal growth and decline.” At the top of figure 1 is a depiction of an upsweep in which the size of the largest settlement increases significantly. When an upward movement is sustained and a higher level of scale becomes the new normal we call this an upward sweep or an upsweep. We define an upsweep as a peak that is more than one-third higher than the average of the three immediately earlier peaks.Footnote 6 We distinguish between an upswing, which is any upturn in a growth/decline sequence, and an upsweep, which goes to a level that is more than one-third higher than the average of three prior peaks. When an upsweep is temporary and returns to the old lower norm we call it an upsurge (see the second line from the top in figure 1). We also distinguish between four hypothetical types of decline: a “normal” downswing that is part of the normal growth and decline sequence, a downsweep in which the decline goes significantly below what had been established as the normal trough, a sustained collapse in which the new lower scale becomes the norm for at least two further cycles, and a downsurge in which a large decline is the result of the collapse of an upsurge.
George Modelski's (Reference Modelski2003) study of the growth of cities over the past 5,000 years points to a phenomenon also noticed and theorized by Roland Fletcher (Reference Fletcher1995)—cities grow and decline in size, but occasionally a single new city will attain a size that is much larger than any earlier city, and then some other cities catch up with that new larger size, but do not exceed it much. It is as if cities reach a size ceiling that it is not possible to exceed until new conditions are met that allow for that ceiling to be breached.
Jared Diamond's (Reference Diamond2005) study of collapses specifies the factors that are thought to cause collapses (see also Tainter Reference Tainter1988). But Diamond does not employ quantitative measures of collapse, and he often focuses on a single polity that collapsed while ignoring neighboring polities that did not. If world systems had been his unit of analysis instead of single polities many of the cases he studied may have been found to have been instances of what we are calling normal rise and fall cycles rather than instances of systemwide collapse. We contend that true urban collapse should be defined as an instance in which all the large settlements in a region go down to at least one-third lower than the average of the three previous troughs and stay down for at least two cyclical periods. The research reported here uses this definition to count the instances in which settlements in regional systems collapsed.
This article presents an inventory of all the instances of the types of scale change of the population sizes of settlementsFootnote 7 for all the regional interpolity networks for which we currently have enough quantitative estimates of the sizes of the largest settlements. We identify instances of each type of change, and eventually will use these as cases for testing hypotheses about the causes of upsweeps and collapses. We also use our counts of upswings, upsweeps, downswings, downsweeps, and collapses to compare regions to see if there are similarities or differences across regions in terms of the numbers of cycles, upsweeps, and collapses over time.
Explanations of Rise-Decline Cycles, Upsweeps, and Collapses
There are many theories about why systems of interacting settlements experience cycles of rise and fall and upsweeps. The most general theories are functionalist evolutionary approaches that explain the long-term emergence of complexity and hierarchy by means of learning processes that produce institutions as responses to selection pressures of various kinds. Chase-Dunn and Inoue (Reference Chase-Dunn and Inoue2011) present a broad overview of theories of rise and fall, including the rise and fall of modern hegemons, and a synthetic model of the dynamics of polity growth that includes population pressures, circumscription, warfare, class struggles, and semiperipheral development.Footnote 8 We hypothesize that upsweeps of settlement size may have been indirectly or directly caused by the phenomenon of semiperipheral development in which polities that are semiperipheral are the ones that solve the problems that make it possible to establish settlements on a larger scale. Most of these are likely to be the consequence of the actions of semiperipheral marcher states in which a recently founded polity out on the edge of a region of older core states conquers the other states and forms a corewide empire, which then builds a large capital city. But there may have also been instances in which semiperipheral capitalist city-states or semiperipheral capitalist nation-states produce urban upsweeps (Chase-Dunn Reference Chase-Dunn1988).
In order to test the hypothesis of semiperipheral development it is necessary to identify instances of settlement upsweeps. The empirical identification of scale changes of settlement sizes in regional systems will also allow us to identify downsweeps and instances of systemwide collapse for the purpose of evaluating Jared Diamond's (Reference Diamond2005) hypothesized causes of collapse. And we will also be able to examine the relationship between urban upsweeps and the upsweeps in the territorial sizes of polities that we have studied in the same world regional Political/Military Networks (PMNs) over the same time periods (see Inoue et al. Reference Inoue, Álvarez, Lawrence, Roberts, Anderson and Chase-Dunn2012).
Estimating the Population Sizes of Settlements
Accurate estimation of the population sizes of both contemporary and ancient settlements is a complicated problem. Daniel Pasciuti (Pasciuti Reference Pasciuti2003; Pasciuti and Chase-Dunn Reference Pasciuti and Chase-Dunn2003) has proposed a measurement error model for estimating the sizes of settlements based on the literature in archaeology, demography, and urban geography.Footnote 9 We define settlements as a spatially contiguous built-up area. This is the best definition for comparing the sizes of settlements across different polities and cultures because it ignores the complicated issue of governance boundaries (e.g., municipal districts). But it still has some problems. Most cultures have nucleated settlements in which residential areas surround a monumental, governmental, or commercial center. In such cases it is fairly easy to spatially bound a contiguous built up area based on the declining spatial density of human constructions. But other cultures space residences out rather than concentrating them near a central place (e.g., many of the settlements in the prehistoric American Southwest such as Chaco Canyon). In such cases it is necessary to choose a standard radius from the center in order to make comparisons of population sizes over time or across cultures.
Ideally we would like to have a minimum temporal resolution of about every 25 years because we are studying middle-run growth/decline phases of polities and settlements. Archaeological evidence of the areal sizes of settlements can be used to estimate settlement sizes, but the limitation here is temporal resolution. Studies that rely on radiocarbon dating are not able to achieve a level of temporal resolution that can make the settlement growth/decline phases that we wish to study visible. They typically have an error margin of about 200 years. When temporal resolution is poorer than every 100 years we could be missing some of the cycles of growth and decline. In some regions, such as the Southwest of the United States, much finer (yearly) temporal resolution of settlement sizes is possible based on the dating of settlement construction with dendrochronology (tree rings).Footnote 10 Thus our examination of upward sweeps of settlement size can, in principle, be extended to regions in which there are no written records.
We are studying only the largest cities in each region but it is still a great deal of cities, so we must primarily rely on data sources that offer estimates of the sizes of many cities over long periods of time. The three main data sources we use are:
-
1. Tertius Chandler (Reference Chandler1987) Four Thousand Years of Urban Growth. Lewiston, NY: The Edwin Mellen Press.
-
2. George Modelski (Reference Modelski2003) World Cities: –3000 to 2000. Washington, DC: Faros 2000.
-
3. Ian Morris (Reference Morris2013) The Measure of Civilization. Princeton, NJ: Princeton University Press.
Tertius Chandler's (Reference Chandler1987) compendium is still the most comprehensive study of large cities, but substantial improvements were made in George Modelski's (Reference Modelski2003) compendium. Ian Morris also provides estimates of the largest cities in his book on measuring the development of Eastern and Western civilizations (Morris Reference Morris2013).Footnote 11
The designation of scale changes requires interval-level measurement, but a certain degree of measurement error is tolerable because we are mainly looking for large changes. After 1500 BCE there is great agreement, for the most part, about the sizes of the largest cities, so the problems are mainly with Bronze Age cities. Our approach is to use these three sources of data to choose the best estimate of the size of the largest city in each world region. When there were conflicts we gave priority to Morris because his estimates used Modelski and Chandler as well as other sources for particular cities. When Morris did not provide an estimate we defaulted to Modelski, and when Modelski was silent we used Chandler.
Units of Analysis: World Regional PMNs and the Central PMN
The main unit of analysis in this research is the world system, understood as a set of interaction networks containing multiple polities. Thus world systems are politically multicentric, though they differ in the extent to which power is concentrated among a set of core polities or in a hegemonic core state. We use the criterion of political-military interaction—the so-called PMN—to bound regional world systems.Footnote 12 This is an interaction network of polities that are making war and allying with one another. This is what international relations scholars call an “international system.” Four world-regional PMNs (Mesopotamia, Egypt, South Asia, and East Asia) and the expanding Central PMN are studied in this paper.Footnote 13 If there were comparable quantitative estimates of the largest settlements with sufficient time resolution, other regions such as the Americas could be added, but so far these have not been located.Footnote 14 The spatial boundaries of each of the world regional PMNs have been ascertained based on the rule of two indirect interactions from the center of the region's heartland of settlements and polities. The Central PMN is bounded conceptually and spatially following David Wilkinson (Reference Wilkinson1987). The Central System eventually comes to include Europe, Central Asia, sub-Saharan Africa, Oceania, as well as the Americas and the four world regional PMNs we are studying (see also Beaujard Reference Beaujard2010).
The Central PMN was born when the Mesopotamian and Egyptian state systems merged beginning in 1505 BCE.Footnote 15 That network continued to expand until it encompassed the whole globe in the nineteenth century CE. Each region was originally a separate PMN, and all these local systems were eventually incorporated into the Central PMN.
The question we ask is: How big is the largest settlement in each interpolity interaction network? So we are not really studying individual settlements, but are rather studying the largest of these in each PMN, which is understood to be a temporally variable characteristic of the whole network of militarily interacting polities. Nor are we studying changes in the settlement size distributions (the differences in size among the settlements at each time point) (but see White, Kejzar, and Tambayong Reference White, Kejzar, Tambayong, Modelski, Devezas and Thompson2006).
We focus on the largest settlements in each regional PMN in order to produce the inventory of sweeps. Each of the world regional PMNs is understood in world-systemic terms as including all populations that were militarily interacting with the heartland of large settlements and states. So, for example, Mesopotamia includes the Susiana Plain (in what is now Iran) and the nomadic peoples in surrounding mountains and deserts who were interacting with the Mesopotamian cities and states. East Asia includes what became China, Japan, Korea, and all the sedentary and nomadic populations that interacted with these urbanized areas. Those Central and North Asian polities that conquered the East Asian heartland of cities were obviously important players in the East Asian PMN.
Counting Cycles and Upsweeps
What follows is a set of five graphs that show our plots of the urban upswings and downswings in four regional PMNs and in the expanding Central PMN. We not only want to identify instances in which upsweeps and collapses occurred, but we want to count how many occur over time so that we can compare frequencies across regions. Our counts employ the following definitions and rules.
A cycle is a sequential upswing and downswing in the size of the largest settlement. A sequence of two data points at the same level (a “flat”) is treated as a continuation of the upward or downward trend that preceded it. The determination of whether or not an upswing or downswing should be counted as an upsweep or a downsweep can be ascertained in different ways depending on how it is compared with earlier peaks and troughs. For our counts we use the average of the previous three peaks when that many data points are available. But we have also done the counts using the highest of the previous three peaks, and those results are included in the AppendixFootnote 16 to this article. It should also be noted that, because we are looking at the largest settlement in each PMN, an upsweep may be carried out by a combination of settlements. If a certain city starts to increase its size but then is passed by another city both of these may be thought of as having contributed to a composite upsweep.
We also want to evaluate the hypothesis that the rate of cycles may have increased over time, but in order to do that we need to keep in mind that the accuracy of our data also gets better as we approach the present. An apparent increase in the frequency of cycles or upsweeps might be due to decreasing error over time rather than real change in the rates.
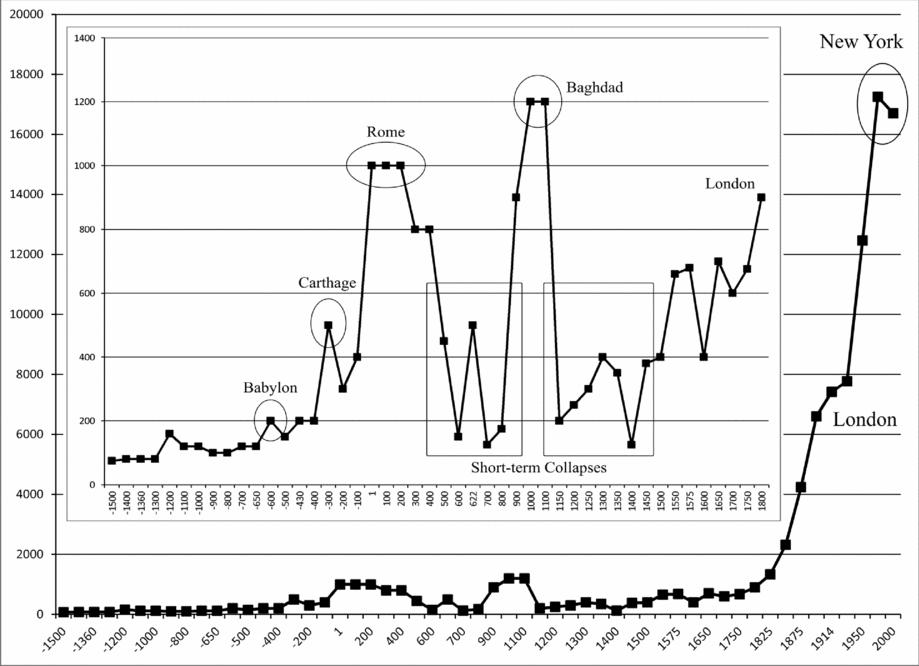
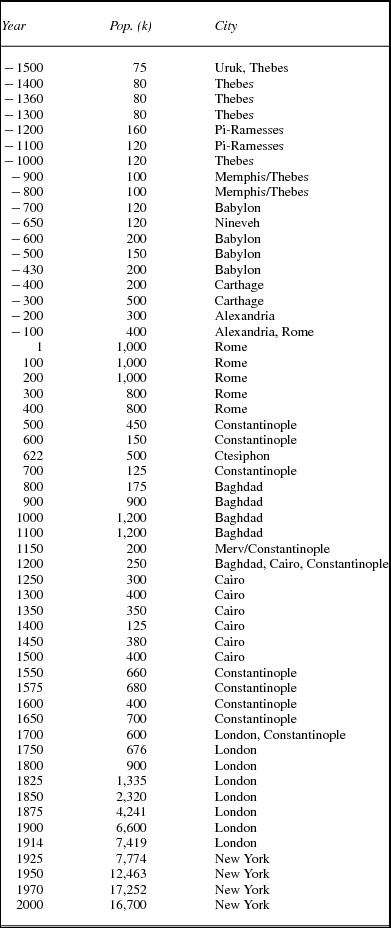
We made some effort to improve the estimate of the size of Baghdad in 1000 CE. Morris (Reference Morris2013: 150) did not provide an estimate of Baghdad's size for that year, and Modelski's compendium contains two different estimates (1,200,000 and 1,500,000). We looked for more recent studies that might be able to guide us but could not find any. In the end we chose Modelski's lower estimate (1,200,000; see figure 4) but we also note that Baghdad would be counted as an upsweep no matter whether we use the smaller or the larger estimate.
Urban Sweeps in the Mesopotamian PMN
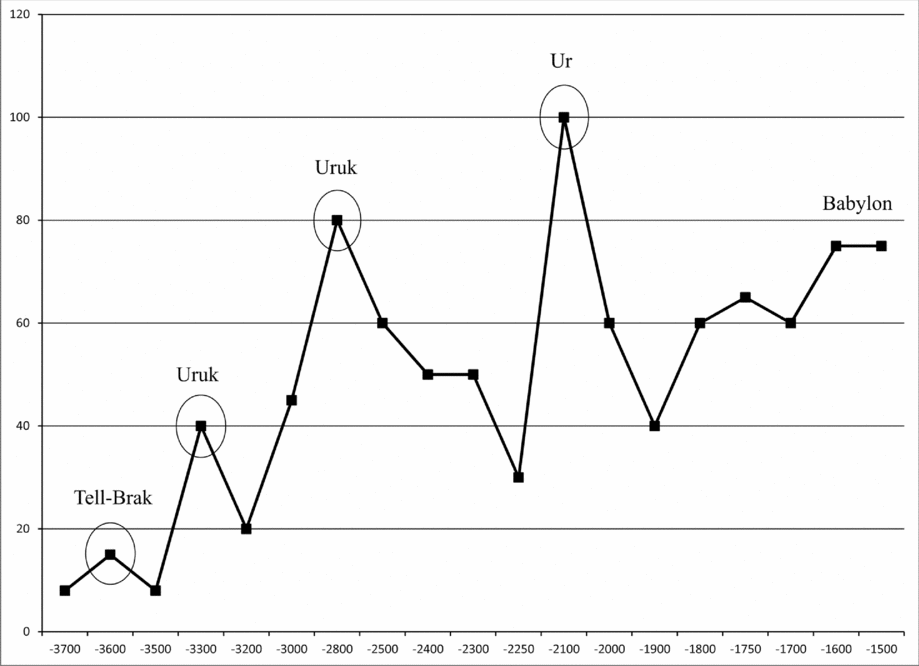
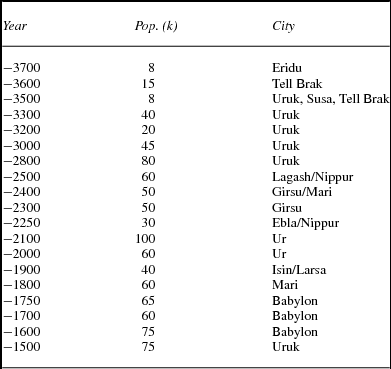
The Mesopotamian region was the heartland of cities—the first place on Earth where people solved the problems of supply and social order that occur when large numbers of people try to live in close proximity with one another. Figure 2 and table 1 show the largest known cities in Mesopotamia from 3700 to 1500 BCE (when the Mesopotamian and Egyptian PMNs merged to become the Central PMN). The vertical axis in figure 2 shows the population sizes of largest cities in thousands, and the horizontal axis shows the years BCE. Earlier estimates of settlement sizes in the Mesopotamian PMN are available, but we start our count in 3700 BCE because it is then that the estimates become more closely spaced in time (though there is still a 300-year gap between 2800 and 2500 BCE). After 2500 BCE we have estimates every century. From the legend of Sargon, the king whose conquests created the huge Akkadian Empire, we know that a new capital city named Agade (Akkad) was built somewhere near Kish. But the exact location of Agade has not been positively identified among the tell mounds of Iraq and so there is no empirical way to estimate its size.Footnote 17 This important missing case means that we should be reticent to draw firm conclusions regarding the timing and shape of city growth in the Mesopotamian region.
Largest cities in Mesopotamia, 3700 BCE–1450 BCE (population in thousands)

Estimated largest city sizes in Mesopotamia, 3700 BCE to 1500 BCE

The first upsweep in figure 2 was a composite upsweep involving the growth of Tell Brak, Ur, Eridu, and Uruk that peaked in 3600 BCE when Tell Brak attained a population size of 15,000. The second upsweep was the story of Uruk, often called the Earth's first city. Uruk peaked twice, with 40,000 in 3300 BCE and 80,000 in 2800 BCE. The third upsweep was that of Ur, which peaked in 2100 BCE with 100,000 residents. So there were four urban upsweeps and seven upswings during this period in the Mesopotamian region. We count no downsweeps in which a trough (low point) was one-third lower than the average of the three previous troughs. All the troughs in figure 2 are higher than previous troughs. There were seven downswings.Footnote 18
Regarding the hypothesis of semiperipheral development, some archaeologists think that towns and irrigated agriculture emerged on the Susiana Plain in what is now Iran adjacent to the floodplain of the Tigris and the Euphrates before towns and irrigation emerged (on a larger scale) on the floodplain (e.g., Nissen Reference Nissen1988). Others see a contemporaneous emergence of settlements and irrigation in the two adjacent regions (e.g., Adams Reference Adams1981). If Susiana preceded Mesopotamia then the polities and settlements in Mesopotamia might have been semiperipheral to a Susian core region. But if they developed simultaneously this is unlikely. Southern Mesopotamia may have developed large cities before Northern Mesopotamia, so the north could have been semiperipheral to the south, but the evidence regarding this is also mixed and complicated because the dating of settlement sites is uncertain (Adams Reference Adams1981). Dilmun, a trading port in the Arabian/Persian Gulf, was perhaps the first semiperipheral capitalist city-state specializing in the seaborne trade between Mesopotamia and the Indus River civilization.
Regarding the relationship between upsweeps in the territorial sizes of polities and urban upsweeps in Mesopotamia, we do not know how large the Uruk polity was because the territorial expansion took place before the invention of writing, and later documentary evidence is unclear about the extent of the Uruk polity.Footnote 19 Settlement sizes can be estimated from archaeological evidence alone, but not polity sizes. The growth of the city of Uruk may have preceded the Uruk imperial expansion because it was organized as a theocracy with a temple economy, but we do not know for sure. In this case it may have been the city that produced the empire rather than the other way around. The Akkadian Empire was the first polity upsweep for which we have a good idea how large the empire was, and it was very large (Liverani Reference Liverani2014). Unfortunately, as mentioned in the preceding text, archaeologists are still unsure as to which of the many tells on the Mesopotamian floodplain was the capital of the Akkadian Empire, Agade. So we do not know whether Agade was large enough to have been an urban upsweep or not. There is a controversy over whether the Akkadian Empire should be considered a semiperipheral marcher state or not. Yoffee (Reference Yoffee, Yoffee and Cowgill1991) contends that the empire was created by an ethnic rebellion against the Sumerian ruling class by a group of Akkadian speakers who had long lived in the Mesopotamian cities. Diakonoff (Reference Diakonoff, Diakonoff and Sergheyev1973) mentions factors more favorable to the interpretation of the Akkadian expansion as having been a semiperipheral marcher state. The Akkadians were immigrants and they used military technologies such as a composite bow that had been imported into Mesopotamia from a peripheral region.
Whether or not the Akkadian Empire was a semiperipheral marcher state, the Third Dynasty of Ur was definitely a retaking of state power by the old Sumerian ruling class, and it was this restoration of Sumerian power that produced the urban upsweep of Ur. The territorial size of the Third Dynasty of Ur was quite small compared with the gigantic Akkadian Empire, but it was a bit bigger than polities had been in Mesopotamia before the rise of the Akkadians. Thus the urban upsweep of Ur was not due to a semiperipheral marcher state.
Urban Sweeps in the Egyptian PMN
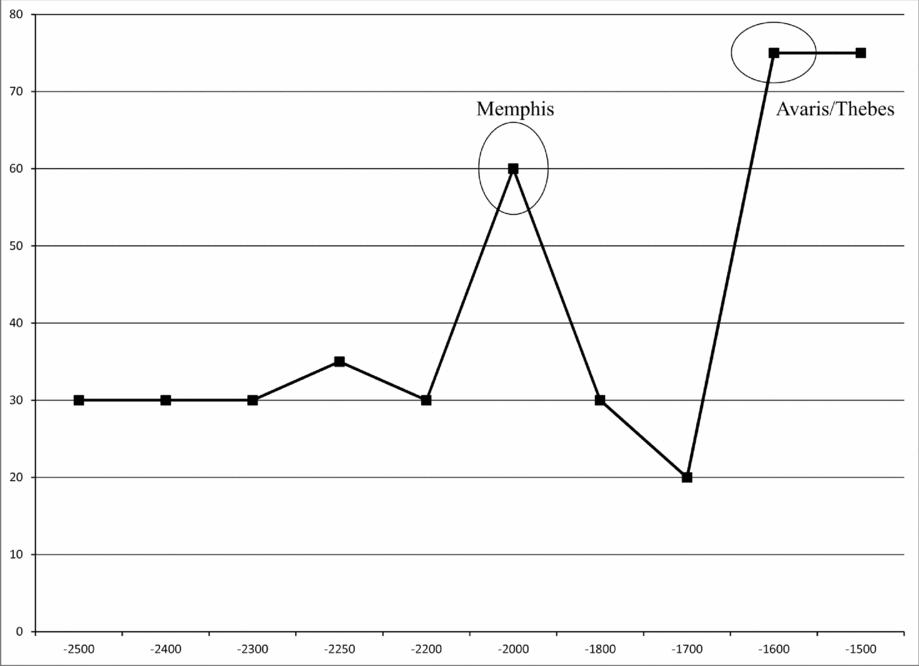
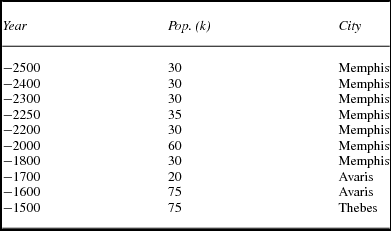
Figure 3 and table 2 show the sizes of the largest cities in Egypt from 2500 BCE to 1500 BCE. Here we see the rise of Memphis, then the rise of Avaris, the Hyksos capital, and then of Thebes. The Memphis upsweep occurred over a succession of dynasties, peaking at 2000 BCE during the eleventh dynasty.
Egyptian largest cities 2500 BCE–1500 BCE

Largest cities in Egypt 7000 BCE to 1500 BCE

So the count for Egypt is two urban upsweeps and three upswings. After the Memphis upsweep, Memphis declined in size and Avaris, though the largest Egyptian city in 1700 BCE, was significantly smaller than cities in Egypt had been for a thousand years. This was an urban downsweep, but still not a sustained collapse because the largest city (Avaris) rapidly grew to produce the second urban upsweep. The Hyksos were immigrants who rebelled against the Egyptians and took state power. This was an instance of semiperipheral development because the ethnically distinct Hyksos were relatively recent immigrants from a noncore region.Footnote 20 Thebes was restored as the capital and largest city after a nativist rebellion that dethroned the Hyksos and established the seventeenth Egyptian dynasty.
Figure 4 and table 3 show the sizes of the largest cities in the Central PMN from 1500 BCE (the period following the consolidation of the Egyptian and Mesopotamian PMNs into one PMN; see note 15) to 2000 CE. The period up to 1800 CE is inserted into figure 4 with a smaller vertical scale to make the earlier upsweeps more visible. There were five urban size upsweeps and 12 upswings over this 3,500-year period.
Central system largest cities, 1500 BCE–2000 CE

Largest cities in the Central System 1500 BCE to 2000 CE

There were three urban downsweeps in the Central PMN over this period of 3,500 years. A downsweep is counted when a trough (low point) is one-third lower than the average of the three previous troughs. The first two were during the centuries between the upsweeps of Rome and Baghdad. This urban short-term collapse was interrupted by the growth of Ctesiphon, the capital of the Persian Sassanid Empire, which was located on the Tigris River 30 kilometers from modern Baghdad, but Ctesiphon only attained half the size that Rome had been. The third downsweep occurred after Baghdad had been sacked by the Mongols. This was part of another urban collapse between the Baghdad upsweep and the long composite upsweep that was the product of the Ottoman Empire and rise of the West. The collapses between Rome and Baghdad and between Baghdad and London are the only two instances of urban systemwide collapse identified by our study. We call them short term because, though the troughs were significantly lower than earlier troughs had been, these collapses did not meet the criterion of staying down for at least three cycles that we have designated for a sustained collapse.
All of the urban upsweeps in the Central PMN were the outcomes of the processes of semiperipheral development. The Neo-Babylonian Empire, which expanded Babylon to 200,000 in 600 BCE, was the outcome of the defeat of the ruling Assyrians by the Chaldeans, a people originally from Southern Mesopotamia near the Persian Gulf. The rise of Carthage was due to the successful trading enterprises of the Phoenician founders of Carthage. This was an interesting and somewhat unusual example of what Chase-Dunn and Hall (Reference Chase-Dunn and Hall1997) have termed a “semiperipheral capitalist city-state.” Carthage was unusual in two ways. It became the largest city in the Central PMN in terms of population size, whereas earlier and later semiperipheral capitalist city-states were more usually smaller cities specializing in the carrying trade between the larger capitals of territorial empires. Carthage began as a typical Phoenician city-state specializing in trade rather than conquest, but it shifted toward the territorial strategy and this may be why the city became so large (Ameling Reference Ameling and Hoyos2011).
The eventual rise of London and New York were the outcomes of the rise to hegemony of modern capitalist nation-states. The urban upsweep of Rome was a semiperipheral marcher state because the Romans were originally Latin hill farmers living on the outskirts of Etruscan and Greek cities on the Italian Peninsula. Baghdad was the outcome of a process of semiperipheral marcher conquest based on late state formation and the rise of a new world religion among the Bedouins and city Arabs of the Arabian Peninsula.
Regarding polity upsweeps, the Neo-Assyrian Empire was a huge upsweep in the territorial size of an empire (Inoue et al. Reference Inoue, Álvarez, Lawrence, Roberts, Anderson and Chase-Dunn2012), but Nineveh, its capital, though it was very large (Radner Reference Radner, Gehler and Rollinger2014), did not constitute an urban upsweep because it was not larger than Babylon and Egyptian cities had already been (see table 3). The subsequent Neo-Babylonian Empire was relatively small in territorial size, but produced an urban upsweep in the great population size of Babylon. Though Carthage did develop a territorial empire, it was not large compared with earlier empires but its combination of trade and conquest produced an urban population size upsweep.
Alexandria was part of the composite upsweep brought to its height by Rome. The rise of Rome produced both an empire upsweep and an urban upsweep, as did the rise of Islam, though the peak size of the Abbasid territory preceded the peak in the size of Baghdad, which occurred after the rise of the Fatimid's had reduced the size of the Abbasid territory. Islamic Baghdad grew up in the old heartland of cities on the Mesopotamian floodplain, but it was far larger than any city in that area had ever been before. The Ottoman and British Empires produced the first part of the last great composite urban upsweep, but New York was produced by a continental hegemon (the United States) that had substituted neocolonial forms of empire for formal colonialism (Go Reference Go2011). By 2000 New York was shrinking a bit and other large cities were catching up (Tokyo, Shanghai, Mexico City, Sao Paolo, etc.) flattening the contemporary global city size distribution (Chase-Dunn and Willard Reference Chase-Dunn and Willard1994).
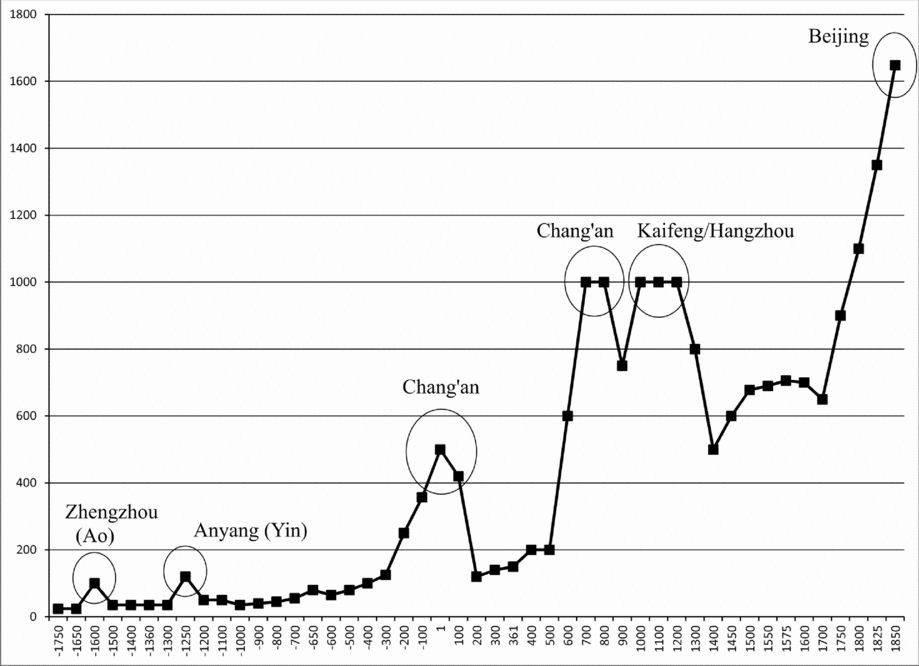
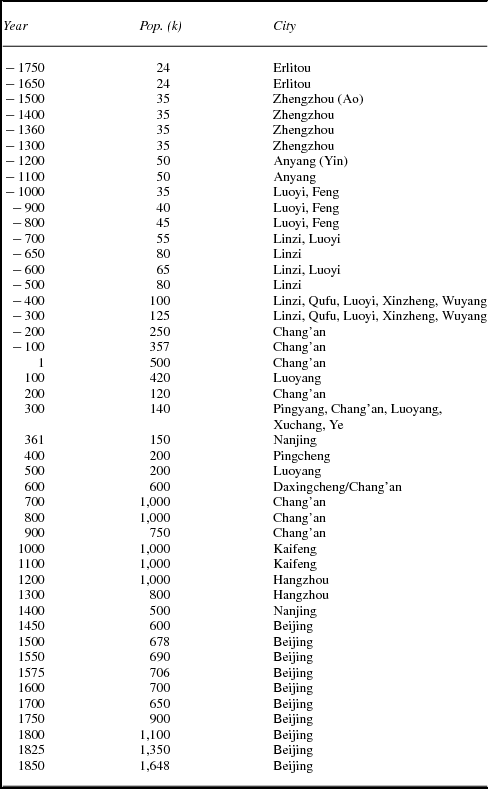
Figure 5 and table 4 show the largest East Asian cities from 1750 BCE to 1850 CE.Footnote 21 The first upsweep is associated with the location of Zhengzhou on the southern bank of the Yellow River in what is now Henan Province. Zhengzhou is the site of Ao, an early capital of the Shang dynasty. Anyang, on the Huan River, was the site of Yin, a later Shang capital.
Largest cities in East Asia, 1750 BCE–1850 CE

Largest cities in East Asia 4000 BCE to 1850 CE

The Shang dynasty was probably a semiperipheral marcher state that became a core state by conquering earlier large polities, including the semimythical Xia dynasty. The old center of Erlitou was replaced by the capital at Zhengzhou (Ao) around 1600 BCE. Later, the Shang dynasty was taken over by Western Zhou dynasty in 1045 BCE, probably another semiperipheral marcher state (Shaughnessy Reference Shaughnessy, Loewe and Shaughnessy1999; but see Von Falkenhausen Reference Von Falkenhausen2006) and the capital was moved to Haojing. The urban upsweeps of the two Shang capital cities of Zhengzhou and Anyang were thus apparently a consequence of Shang semiperipheral state formation.
Chang'an was the Han capital located quite near modern Xian. The Western Han Dynasty produced an empire upsweep as well as an urban upsweep, but the Han Dynasty was not a semiperipheral marcher state. The Han, Tang, and Song dynasties were all started by generals who rebelled against the rulers of core states and took over by coups during dynastic breakdown situations. They were not the leaders of newly established semiperipheral states on the edges of the old core region. The second upsweep of Chang'an occurred during the Tang Dynasty (618–907), which also produced an upsweep in the territorial size of the empire (Inoue et al. Reference Inoue, Álvarez, Lawrence, Roberts, Anderson and Chase-Dunn2012).
Chang'an was, along with Constantinople and Baghdad, one of the largest cities in the world at this time. Kaifeng became the capital of the Song dynasty and Hangzhou became as large as the capital during the eleventh century. The Song Dynasty did not produce a polity size upsweep, and it was not a semiperipheral marcher state. Thus we find six urban upsweeps and nine upswings in East Asia. We count no downsweeps in East Asia. None of the troughs were lower than earlier troughs. But after the decline of Yin (Anyang), the last Shang capital, city sizes were slow to recover (see figure 5). There were no collapses in East Asia because the troughs were not lower than earlier troughs had been.Footnote 22
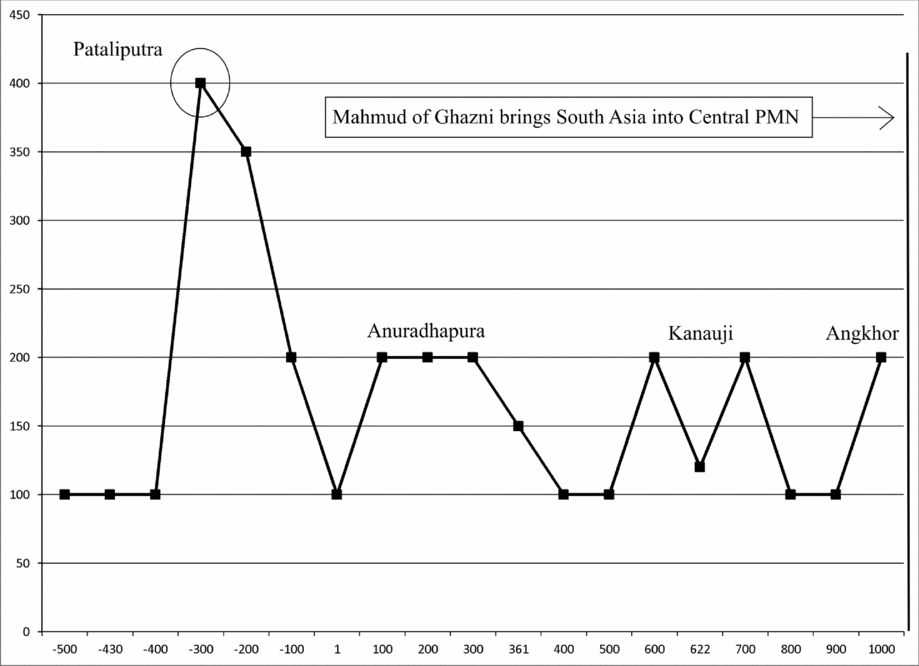
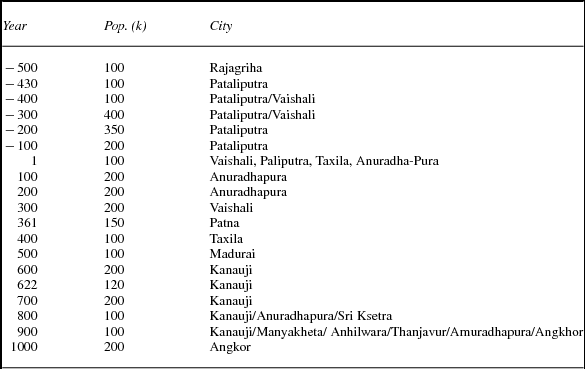
Figure 6 and table 5 show the sizes of the largest cities in South Asia from 500 BCE to 1000 CE.Footnote 23 Surely the first South Asian urban upsweep occurred with the rise of the Indus valley civilization cities of Harappa and Mohenjo-Daro during the Bronze Age. We know how large these Bronze Age cities were at their peak, but we do not have temporally regular estimates of settlement sizes until large cities had emerged in the valley of Ganges. We begin our count of upsweeps as soon as we have size estimates every 100 years, in 500 BCE.
South Asian largest cities, 500 BCE–1000 CE

Largest cities in South Asia 500 BCE to 1000 CE

The first and only South Asian urban upsweep in the period we are studying was that of Pataliputra (modern Patna) at the confluence of the Ganges and Gandhaka rivers. This was the capital of the great Mauryan Empire founded by Chandragupta Maurya. The city of Vaishali is believed to have been as large as Pataliputra at its peak size in 300 BCE. After the decline of the Mauryan cities there was a long period of smaller cities that corresponds with the political decentralization of South Asia after the fall of the Mauryan Empire. Eventually Angkhor arose in the region that is now Cambodia, part of the greater South Asian PMN. In figure 6 we see one urban upsweep and five upswings. There were no downsweeps and four downswings. The steep descent after the Pataliputra upsweep was what we have termed a downsurge. It did not go below what had been the typical size of cities in South Asia before the growth of Pataliputra, so it was not a collapse.
Chandragupta's ascent to power seems to have followed the trajectory of a semiperipheral marcher state. His people ruled independently on the marches of a more powerful kingdom (Kosala) before being uprooted by the expanding Nanda kingdom. From there, it took only one generation for the Mauryan line to collect power, first conquering marginal territories and then overthrowing the Sudra-born Nanda rulers and replacing them with Ksatriya Mauryas (Ahmed et al. Reference Ahmed, Álvarez, Anderson, Basmajian, Blum, Inoue, Jaworski, Khan, Lawrence, Owen, Roberts, Suppatkul and Chase-Dunn2013).
Discussion of Overall Findings
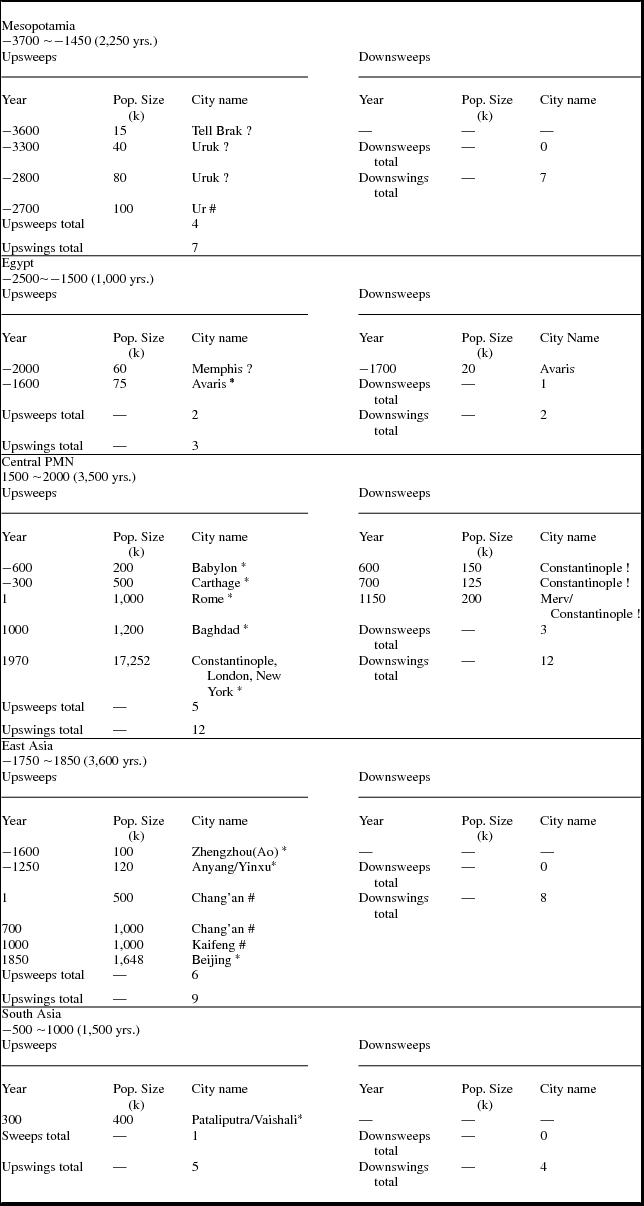
Table 6 shows the upsweeps for each of our five regional PMNs and indicates with an asterisk (*) those urban upsweeps that were associated with semiperipheral development, if we are relatively sure about this. Eight of the 18 urban upsweeps were probably the consequence of semiperipheral marcher state conquests. Carthage was a semiperipheral capitalist city-state that morphed into an empire. And one (Constantinople–London–New York) was a combination of a semiperipheral marcher state and two semiperipheral national states that rose to hegemony. So that is a total of 10 out of 18 that can be attributed to semiperipheral development. Four of the urban upsweep cases were definitely not due to semiperipheral development is indicated in table 6 by a hashtag (#). They were cities built by old core polities that were revitalized by nativist reconquests or military coups. Four of the urban upsweep cases may or may not have been due to semiperipheral development. We are still not sure about these, all of which occurred in Bronze Age Mesopotamia and Egypt when evidence is murky. These are marked with a question mark (?) in table 6. Short-term collapses are marked with an exclamation point (!)
Settlement sweeps in five world PMNs

Note: Formerly semiperipheral polity = *; polity long in the core = #; not sure = ?; short-term collapse = !.
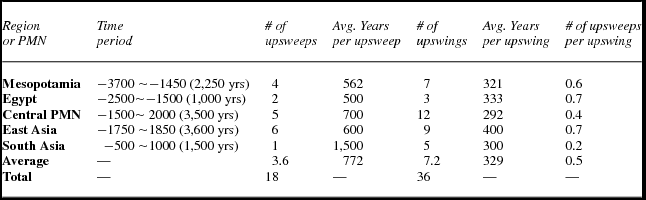
Table 7 combines the results of our counts of urban upsweeps and upswings in five regional PMNs in a way that allows them to be compared with one another. We have a total of 18 upsweeps and 36 upswings adding up all the results from the five regions under study.
City size upsweeps (population sizes of largest cities)

The lengths of the time periods vary in table 7 from 1,000 years for Egypt to 3,600 years for the East Asian System. So in order to compare regions we calculate the number of upsweeps and upswings per year. Regarding upsweeps per year we see that the regions vary from a low of 500 years for Egypt (two upsweeps over 1,000 years) and high of 1,500 years for South Asia (one upsweep over the whole 1,500-year period). The upsweep rate (years per upsweep) for the Central PMN is 700, while for East Asia it is 600. Mesopotamia has 562 years per upsweep. South Asia is the outlier with only one upsweep over the whole period. We found the same result for South Asia in our study of upsweeps in the territorial sizes of empires (Inoue et al. Reference Inoue, Álvarez, Lawrence, Roberts, Anderson and Chase-Dunn2012). The long interregnum between the Mauryan and Mogul Empires makes the evolutionary history of South Asia rather different from the other regions (Chase-Dunn, Manning, and Hall Reference Chase-Dunn, Manning and Hall2000).
The comparison between East Asia and the Central System is of great interest, though most of the literature discussing the rise of the West in comparison with the East focuses on Europe and China. We are comparing the Central System, which for most of the period had big cities in the old West Asian–North African core, with East Asia as a region of contending states in which China long played the central role. This overlaps with, but does not exactly replicate, the more usual comparison between Europe and China.Footnote 24
The length of time we examine for these two PMNs is similar (3,500 years for the Central PMN vs. 3,600 years for East Asia). The number of upsweeps is also similar (Central = 5; East Asia = 6). But there is a bigger difference when we look at the number of upswings (Central = 12; East Asia = 9) and the ratio of upsweeps to upswings (Central = .4; East Asia = .7). It seems reasonable to suppose that more frequent cycles and more upsweeps per cycle correspond with less systemic stability. If this is true, the general notion that East Asia was a more stable system because China was a very large and relatively stable actor, whereas the Central System had a more competitive and less stable political/military structure, finds support from our findings regarding East/West differences in urban upswings and downswings (cycles). These cycles were more frequent and were shorter on the average in the Central System than they were in East Asia. We should note, however, that in our study of cycles, upsweeps and downsweeps in the territorial sizes of largest empires in the Central and East Asian systems (Inoue et al. Reference Inoue, Álvarez, Lawrence, Roberts, Anderson and Chase-Dunn2012) found just the opposite—that there was somewhat greater stability of empires in the Central System than in the Eastern. Despite all the analyses that consider the important differences between the East and the West, our study shows that these systems were more similar than different with regard to the dynamics of both urban and empire growth/decline cycles and upward sweeps.Footnote 25
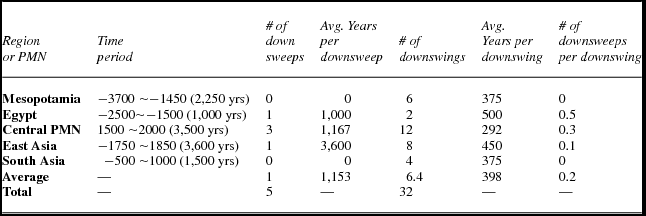
Table 8 compares numbers and rates of downswings and downsweeps across our regional cases. Recall that a downsweep is a low point (trough) that is at least one-third lower than the average of the three previous troughs. One striking result in table 8 is that there were only five downsweeps in all of our five regions, while we saw in table 7 that there were 18 upsweeps. So urban downsweeps are few relative to the number of upsweeps. Also we found only two short-term systemwide collapses, and both of these were in the Central System (following the upsurges of Rome and Baghdad). The Central System also had more downsweeps and more downswings than the other regions.
City size downsweeps (population sizes of cities in troughs)

Table A2 in the AppendixFootnote 26 divides the total period for each PMN into five equally sized subperiods (phases 1–5) and counts the number of cycles, upsweeps, and downsweeps for each subperiod to see if there is an acceleration of cycles or sweeps over the period of study. This analysis shows no consistent trends regarding the frequency of sweeps or cycles.
Conclusions
This article reports the results of an inventory of cycles, upsweeps, and collapses of settlements in five separate world regions that had independent systems of fighting and allying states. Because the accurate designation of cycles and sweeps requires interval scale measures, we have confined our study to those regions and time periods for which regular quantitative estimates of largest settlement sizes are available. We found a total of 18 upsweeps, five downsweeps, and only two instances of short-term systemwide settlement collapse (the slumps in city sizes between Rome and Baghdad and between Baghdad and London). A number of scholars have taken exception with Jared Diamond's characterization of collapse in the places he studied (e.g., McAnany and Yoffee Reference McAnany and Yoffee2010). Our quantitative study shows that there have been only two lengthy systemwide collapses in which large cities did not recover for centuries. We also investigated whether or not the rate of cycles has increased over the long run and we found that cycles of city growth and decline have not accelerated. We found a greater rate of urban cycles and more sweeps in the Western (Central) System than in the East Asian System, which indicates that the urban system of the West was somewhat less stable than that of the East. And both of the instances of short-term urban collapse occurred in the Central System, not in the East. We also found that 10 of the 18 urban upsweeps were produced by semiperipheral development and eight directly followed, and were caused by, upsweeps in the territorial sizes of polities. The finding that semiperipheral development was an important aspect of more than half of the urban upsweeps is strong support for the claim that it is necessary to study whole world systems in order to explain sociocultural evolution. It also implies that core-centric explanations such as the network node theory of innovation cannot completely explain the pattern of uneven development and the geographical migration of sociocultural complexity from its early locations to other formerly peripheral regions. Semiperipheral development is an important phenomenon that can only be comprehended when whole world systems are the focus of study.