Introduction
Greater profit to site-specific production practices (e.g. crop selection, rates of fertilizer, seed and pesticides) could be achieved with adequate agronomic interpretations of yield, landscape topography, and their interactions with soil properties. In this context, management zone delineation relies on determining a spatially sound agronomic interpretation of the biophysical factors affecting crop yield response. Similarities in soil and landscape/topography properties, or yield response, are the most popular criteria use to delineate management zones. Yield is most often used to define management zones, because yield is assumed to give a relatively stable spatial response. However, the dependence of yield on seasonal weather, evidenced as temporal variability, can complicate this approach. Areas of similar yield potential might be found in the same geographic location, over a series of years, though this is not always observed.
Temporal variability in crop yield is manifest in the oft-substantial interaction between management zones and stochastic factors (e.g. weather) and may affect the usefulness of management zones due to increased uncertainty risk to production systems. There are not many examples regarding the temporal stability of forage yield in the literature, but climate explains 32 to 83% of yield variation in corn and soybean cropping systems (Yamoah et al., Reference Yamoah, Varvel, Francis and Waltman1998), affecting yield’s year-to-year spatial structure (Jaynes and Colvin, Reference Jaynes and Colvin1997). Lamb et al. (Reference Lamb, Dowdy, Anderson and Rehm1997) reported that corn grain yield was not spatially consistent across time; areas of better grain yield were not the same, year to year, nor were poor production areas. The lack of temporal spatially related crop yield stability suggests that a field’s spatial variability, as represented by management zones, may not be well managed until temporal variation is understood. As a consequence, over-interpretation of one-year yield maps, using these maps to develop management strategies for next year’s crop (or the next season if the same crop is grown) is likely. If yield stability is not observed, site-specific management recommendations based on yield maps is in jeopardy.
Small beef cow/calf farms are the most common agricultural enterprise in the highlands of West Virginia. Grassland productivity, for given mixtures of pasture species, in this production system is influenced by a combination of management factors (Baker and Nestor, Reference Baker and Nestor1979), and heavily affected by management’s interaction with biophysical production variables. The interaction between landscape and crop yield is affected and modified by management decisions and by weather, causing yield to display temporal variability (Pena-Yewtukhiw and Grove, Reference Pena-Yewtukhiw and Grove2009). As a consequence, short term variation in production and sward composition can be attributed to management and biophysical characteristics such as landscape, soil and seasonal weather, whereas long-term changes could be a product of interactions between management, environment/climate and time (Patton et al., Reference Patton, Dong, Nyren and Nyren2007).
In the context of West Virginia’s rather complex landscapes, little is known about variation in relationships between forage/pasture/grassland performance and land/soil resources (Boyer et al., Reference Boyer, Wright, Feldhake and Bligh1996), either at the scale of the individual field or that of the farm. Although a production management system may be uniformly applied to an area, the characterization of soil physical properties in the landscape is the first step to studying the spatial sensitivity of the landscape response to management practices (Thompson et al., Reference Thompson, Pena-Yewtukhiw and Grove2006; Pena-Yewtukhiw and Grove, Reference Pena-Yewtukhiw and Grove2004). Soil physical properties such as bulk density and moisture content are related to the performance of a production system and influence enterprise sustainability. The study and spatial characterization of the actual state of the soil/landscape ecosystem, of the effect of management applied to the land, and of landscape sensitivity to degradative processes, will help prevent or allow management of adverse impacts (Pena-Yewtukhiw et al., Reference Pena-Yewtukhiw, Grove and Thompson2003). This knowledge would guide the design of best management techniques.
The susceptibility of an area to degradation depends on soil characteristics, weather, and management. Physical degradation consequences include loss of productivity, increased erosion and greenhouse gas production, and increased probability of pollution (Dexter, Reference Dexter2004; Douglas, Reference Douglas1994; Hamza and Anderson, Reference Hamza and Anderson2005).For example, soil compaction increases soil strength, which affects processes such as soil water and temperature regimes (Gifford and Hawkins, Reference Gifford and Hawkins1978; Drewry et al., Reference Drewry, Littlejohn, Paton, Singleton, Monaghan and Smith2004). As a result, compaction will directly impact the productivity and sustainability of grazing and hay management of grasslands. Compaction severity depends upon climate, land use, soil type, and soil moisture characteristics, and may be caused by intensive grazing or overgrazing over-moist soils. The objective of this study was to evaluate differences in seasonal forage yield and soil properties (bulk density, penetration resistance, organic matter) in three landscape (topography/elevation) defined management zones under two different grazing systems, in the Appalachian region of West Virginia.
Materials and methods
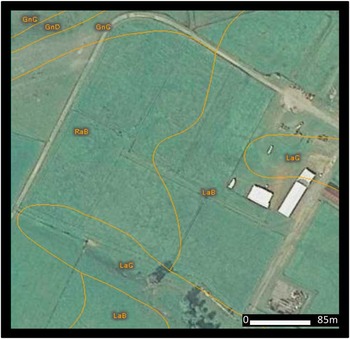
The study was conducted during a three-year (2007–2009) winter grazing experiment at the West Virginia University Reedsville Experiment Farm located in Preston County (79°47 W and 39°30 N).The experimental area consisted of six 0.8 ha paddocks (Fig. 1). The experimental area was planted to orchardgrass (Dactilis glomerata L.). Hay was cut twice per year, in May and July, and forage was stockpiled after the second cutting. Nitrogen fertilizer was applied three times per year, before each cutting and stockpiling, at a rate of 84 kg N/ha.
Experimental area divided into six paddocks.

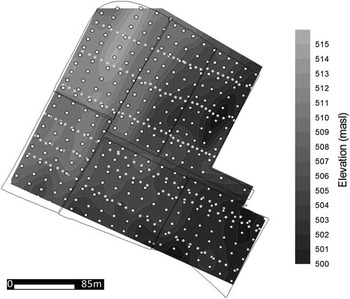
Winter grazing started at the end of November, when the animals for both treatments were admitted to the paddocks at a stocking rate of 3.75 steers/ha or 3 steers /paddock. Two grazing treatments were studied in the area: a) Treatment 1 or grazed treatment, in which animals were removed from three of the six paddocks in January; and b) Treatment 2 or grazed and fed treatment in which animals were given supplemental hay, and were removed from the paddocks in April. Three distinctive soil series, representing each elevation management zone, were described in the area: Rayne silt loam, 3 to 8 percent slopes (RaB) at the summit; Latham silt loam, 3 to 8 percent slopes (LaB) at the lower backslope; and Gilpin silt loam, 8 to 15 percent slopes (GnC) at the upper backslope. The area was divided into three management zones, as determined by elevation differences. The lower elevation corresponded to the lower backslope (500–505 masl), the medium elevation to the middle backslope (504–510 masl), and the higher elevation to the summit (510–515 masl). The lowest elevation was located to the east of the experimental area (Fig. 2). Both treatments were represented in each management zone
Study area elevation map and sampling locations.

Soil strength was determined twice each year, to a depth of 50 cm, at three hundred locations (16 m by 10 m grid), two days before scheduled biomass measurements, using a Rimik penetrologger. At each of the sampling points, herbage height was measured as a proxy variable for biomass using the falling plate meter (Rayburn and Rayburn, Reference Rayburn and Rayburn1998). The plate meter was calibrated using 60 randomly selected sampling points. Total hay production was determined with the hay harvest in May and July of each year. In 2007, soil bulk density (Uhland sampler), soil organic matter content (dry combustion), pH (water), and bioavailable Ca, K, and P (Mehlich III extraction) were measured at 180 additional sampling points distributed across the paddocks and elevation zones in the experimental area (45 m by 6 m grid). Soil volumetric moisture content was measured using a POGO soil moisture sensor (Stevens, 2005). The moisture measurements were performed at the three hundred points sampled for penetration resistance and biomass. The first soil moisture sampling event (30 June) occurred 24 hr after a soaking rain brought the area to field capacity. The second sampling (16 July) occurred at the end of a continuous dry period of two weeks length. Statistical analysis of our data was performed using SAS software (SAS Institute, 2005). Data were analyzed using ANOVA (Proc GLM) when comparing soil properties among elevation zones, grazing treatments and their interaction; Spearman rank correlation was performed between certain temporally measured variables (between penetration resistance events, and between volumetric moisture content sampling events). Variography and kriging were used to prepare visual representations (maps) of the measured variables (Pebesma and Wesseling, Reference Pebesma and Wesseling1998).
Results and discussion
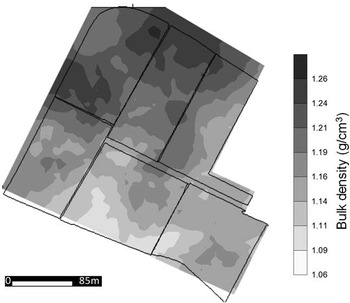
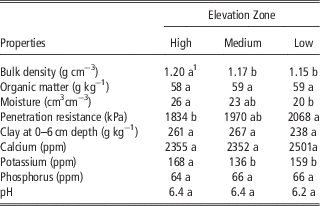
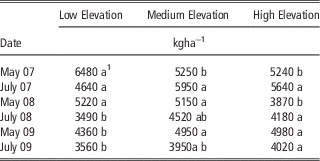
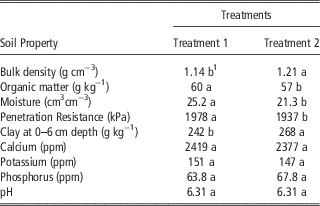
Mean soil bulk density, organic matter, moisture, penetration resistance, and clay content (0–6 cm), by elevation zone, are shown in Table 1. Bulk density increased as elevation rose (Table1, Fig. 3). Organic matter, pH, and bioavailable Ca and P were not different among elevation defined management zones (Table 1). Soil volumetric moisture contents were greater at higher elevations. This soil moisture behavior likely explains the greater biomass generally found in the mid and higher landscape positions (Table 2).
Bulk density distribution over the study area (July 2007).

Comparison of soil properties (July 2007) among elevation defined management zones.

1 Values within a row followed by different letters are significantly different at the 90% level of confidence (α=0.10).
Hay dry matter yield, by cutting, for each elevation zone (2007–2009).

1 Values within a row followed by different letters are significantly different at the 90% level of confidence (α=0.10).
Soil penetration resistance rarely exceeded 2500 kPa, thus rarely inhibiting biomass production. Soil penetration resistance increased with soil depth, which is consistent with the increase in clay content in these soil profiles. Independent of the time of the year when soil penetration resistance was measured, resistance generally decreased as elevation increased, exhibiting greatest variability at the soil surface (0–16 cm). Among the soil chemical properties, only bioavailable potassium was significantly affected by elevation defined management zone (Table 1).
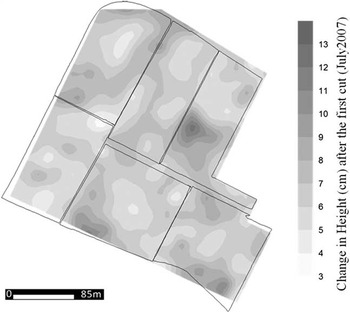
A strong relationship between soil moisture and soil penetration resistance was observed for lower elevation zones (higher moisture content resulted in lower penetration resistance), but not for more elevated positions. Soil penetration resistance for the 0 to 2 cm depth increment was slightly related to biomass production at high and medium, but not low, elevation. Variation in paddock penetration resistance and other soil properties caused some of the herbage biomass production variation that is manifest in the site-specific soil-herbage biomass relationship illustrated in Figure 4. Figure 4 shows the high variability in herbage re-growth (expressed in height) thirty days after the second hay cut in 2007.
Change in herbage height 30 days after the second hay cutting in 2007.

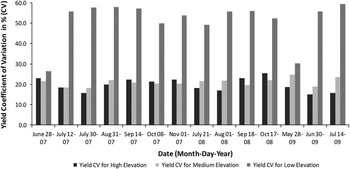
During the study period (2007–2009), herbage biomass production at lower landscape positions was more susceptible to extreme weather conditions (excess rain or drought) than higher and middle elevation areas; the herbage biomass coefficient of variation for the lower position was the highest among all the landscape positions, being almost twice as high as that for the other two zones (Fig. 5). The great variation in soil moisture observed in the lower areas of our study site, being highest after a rainy period and lowest during a droughty period, may be related to the great variability in herbage height/biomass production observed in this zone. A lower value for the Spearman rank correlation coefficient (not shown) between herbage heights measured at different dates for the lower elevation zones was observed and supports this conclusion.
Coefficient of variation (%) for herbage biomass, by elevation zone.

Temporal stability in the herbage biomass production measured in the two cuttings of forage for hay each year (Table 2), assessed through Spearman rank correlation, was not strongly related to elevation (not shown).This means that biomass production was temporally variable. High and medium elevation zones behaved temporally more alike as compared to the lower elevation zone. Spearman rank correlation between biomass production in the high and medium elevation zones was 0.76, while these same correlations for biomass production between high and low, and between medium and low elevation zones, were 0.45 and 0.60 respectively.
Bulk density (Table 3) was significantly higher for the Treatment 2, but organic matter and penetration resistance (0–6 cm) were consistently lower than in Treatment 1. Neither bulk density or penetration resistance reached values considered limiting to herbage production. Bulk density, organic matter content, and moisture showed no interaction between elevation defined management zone and grazing treatment.
Comparison of surface soil properties (July 2007) for the grazing treatments.

1 Values within a row followed by different letters are significantly different at the 90% level of confidence (α=0.10).
Soil penetration resistance in both winter grazing treatments increased near-surface (0–10 cm), but was not significantly different at deeper depths. Our measurements exhibited a statistically significant (α=0.10) increase in penetration resistance between November and March/April, indicating an impact of winter grazing on soil compaction (data not shown). The effect of ‘grazing compaction’ was not evident at deeper depths.
Analysis of variance (ANOVA) performed on the soil chemical variables indicated that although pH, and bioavailable phosphorus and potassium, were not significantly affected by the main effects of grazing treatment or elevation defined management zone, there was a statistically significant interaction between grazing treatment and management zone, (for phosphorus p=0.036, for potassium p=0.049, and for pH p=0.0011). Bioavailable calcium was not significantly affected by treatment, elevation management zone or their interactions.
In half of hay cutting events, the Treatment 2 exhibited significantly higher biomass than Treatment 1 (not shown). In the other half of the cutting events, although higher biomass was measured in Treatment 2, no significant differences were observed (not shown). For biomass cuttings, interactions between grazing treatment and elevation management zones also varied during the study period. Cuttings occurring in July 2008 and May 2009 exhibited an interaction between management zone and grazing treatment.
Using the information provided from our spatial (landscape/elevation) and temporal analyses, and for the two treatments studied, we would recommend a better grazing management system. We would recommend increasing the number of animals or the length of grazing time in the less sensitive weather/management landscape areas that were consistently producing more herbage biomass during the year and/or where lower penetration resistance was observed.
Conclusions
Temporal stability in herbage height was found to be related to elevation. Medium elevation exhibited the highest stability measured with Spearman rank correlation index, followed by the higher and the lower landscape positions. Based on our observations, the lower elevation management zone was more susceptible to weather and management practices, resulting in higher variability in herbage production.
The interaction between grazing treatment and management zone on penetration resistance and other soil properties caused some of the herbage biomass production variation that is manifest in the site-specific soil-herbage biomass relationship. Although under our study’s conditions soil penetration resistance was not likely a limiting factor to herbage production, changes in this property due to winter grazing were observed. Sustainable livestock production in West Virginia can be achieved by maintaining pasture productivity, which depends on maintaining soil quality. We conclude that the site-specific response of soil properties and forage biomass production to grazing management, combined with knowledge of soil properties and the weather, indicates that we should have different animal density-grazing time periods at each landscape/elevation position. The differences in the temporal stability of the biomass response are site-specific, and in our study area this indicates that we should decrease the number of animals in the lower landscape position and increase animal numbers in the upper landscape position.
Knowing forage response to different grazing systems, by management zones, will speed development of more sustainable site-specific grassland production systems.