Introduction
Quinoa (Chenopodium quinoa Willd.) is a grain crop popular for its nutritional value and health benefits (Hinojosa et al., Reference Hinojosa, Gonzalez, Felipe, Masias, Fuentes and Murphy2018). The Food and Agriculture Organization of the United Nations (FAO) has recognized quinoa as an alternative crop for food and nutritional security in the context of climate change. Its popularity is increasing globally due to its balanced composition of high-quality protein, essential minerals and vitamins – key components of an ideal diet for maintaining a healthy life (Bazile and Baudron, Reference Bazile, Baudron, Bazile, Bertero and Nieto2015; Jacobsen, Reference Jacobsen2017) – as well as its adaptability to a wide range of ecological conditions (Hanif and Afzal, Reference Hanif and Afzal2024). Quinoa is a short-duration, low water-requiring crop (Steduto et al., Reference Steduto, Hsiao, Fereres and Raes2012; Taaime et al., Reference Taaime, Rafik, El Mejahed, Oukarroum, Choukr-Allah, Bouabid and El Gharous2023) that thrives in diverse agro-ecological environments (Alvar-Beltran et al., 2019; Asher et al., Reference Asher, Dagan, Galili and Rubinovich2022). It is well adapted to marginal soils and exhibits tolerance to salinity (Iqbal et al., Reference Iqbal, Basra, Afzal, Wahid, Saddiq, Hafeez and Jacobsen2019; Parvez et al., 2020; Ruiz et al., Reference Ruiz, Biondi, Oses, Acuna-Rodriguez, Antognoni, Martinez and Molina-Montenegro2014) and high temperatures (Choukr-Allah et al., 2016; Hinojosa et al., Reference Hinojosa, Gonzalez, Felipe, Masias, Fuentes and Murphy2018). Additionally, it can grow successfully in sandy and alkaline soils (Agarwal et al., Reference Agarwal, Rizwana, Tripathi, Kumar, Sharma and Patel2023). Known for its resilience to harsh environmental conditions (Abdelgalil et al., Reference Abdelgalil, Hefzy, Sas-Paszt, Ali, Lamlom and Abdelghany2023), quinoa is drought-tolerant and performs well under water-limited situations (Ahmadi et al., Reference Ahmadi, Solgi and Sepaskhah2019; Akram et al., Reference Akram, Libutti and Rivelli2024; Algosaibi et al., Reference Algosaibi, Badran, Almadini and EI-Garawamy2017). Quinoa can be cultivated profitably in hilly and plain regions of India (Bhargava et al., Reference Bhargava, Sudhir and Ohri2006). As such, it is increasingly recognized as a climate-resilient crop (Akram et al., Reference Akram, Libutti and Rivelli2024). Due to these valuable traits, quinoa is considered a promising crop to address current and future challenges posed by climate change (Razzaghi et al., Reference Razzaghi, Plauborg, Jacobsen, Jensen and Andersen2012; Zurita-Silva et al., Reference Zurita-Silva, Fuentes, Zamora, Jacobsen and Schwember2014).
The Government of India has recognized the importance of quinoa and included it under the Millet Mission as a pseudo-millet crop to promote its wider adoption. In India, quinoa is currently cultivated on approximately 440 ha, with an average production of 1053 tonnes (Srinivasa Rao, Reference Srinivasa Rao2015) and it is gaining popularity in several states across the country. According to Pradhan et al. (Reference Pradhan, Rane, Basavaraj, Kumar, Shid, Paul, Pal and Reddy2025), quinoa has the potential to be grown on up to 26 million ha in India. As a short-duration and deep-rooted crop, quinoa can adapt well to various cropping systems. Its ability to produce high-quality grains under diverse stress conditions makes it a suitable option for crop diversification and a promising component of future crop production systems aimed at enhancing sustainability (Sharma et al., Reference Sharma, Chandra, Dwivedi and Partukar2015). Quinoa thrives in soils with higher clay content (Razzaghi et al., Reference Razzaghi, Plauborg, Jacobsen, Jensen and Andersen2012), making it well-suited for cultivation in the rice fallow lands of eastern India. Rice fallow land in eastern India refers to land where a single crop of rice is grown during the kharif season, but the land is left unused during the rabi season. The kharif and rabi season refers to the monsoon and winter crop seasons in India, typically spanning June to October and November to April, respectively. This practice is common in rainfed regions and is often due to challenges such as a lack of assured irrigation, moisture stress from early monsoon withdrawal and late harvesting of long-duration rice varieties.
Adoption of optimum land, crop and water management practices is crucial to achieving the high yields of quinoa. Among these, the planting method is a key agronomic practice that significantly influences quinoa yield (Mirsafi et al., Reference Mirsafi, Sepaskhah and Ahmadi2024). Efficient sowing techniques ensure early crop establishment, enable better resource utilization and help retain soil moisture, even during periods of water stress (Awadalla and Morsy, Reference Awadalla and Morsy2017). Proper land management, tailored to soil type, land characteristics and seasonal conditions, is a cost-effective management strategy that can significantly enhance crop grain yield (Deshmukh et al., Reference Deshmukh, Vasave and Patel2016). Judicious irrigation practices not only reduce water consumption but also improve crop yield, thereby enhancing water productivity. In the context of increasing water scarcity in agricultural systems, the efficient management of available irrigation water has become a critical factor for sustainable crop production (Pinto et al., Reference Pinto, Fischer, Wilckens, Bustamante and Berti2021). Quinoa responds well to irrigation and irrigation regimes have shown a significant impact on its productivity (Khaled et al., Reference Khaled, Abdel-Nasser, Hussein, Darwish and Ibrahim2021). Moreover, quinoa has demonstrated good performance under deficit irrigation, with minimal yield reduction (Algosaibi et al., 2017; Yazar et al., Reference Algosaibi, Badran, Almadini and EI-Garawamy2017), indicating its potential for cultivation in water-limited environments. However, information on irrigation scheduling under different land management practices for enhancing quinoa productivity in the rice fallow systems of eastern India is limited. Considering these factors, the present study evaluates various irrigation schedules under different land management to develop strategies aimed at improving water productivity, yield, resource use efficiency and profitability in quinoa cultivation.
Materials and methods
Site description
The field experiments were conducted during the dry seasons of 2022–2023 and 2023–2024 at the research farm of ICAR – Indian Institute of Water Management, Bhubaneswar, Odisha (20°17′ N, 85°41′ E and 61 m above mean sea level). Initial soil samples from the experimental field were analysed for pH and electrical conductivity (EC) using a potentiometric technique. Soil organic carbon was quantified using the Walkley–Black wet oxidation method, while available nitrogen (N), phosphorus (P) and potassium (K) were determined using the alkaline potassium permanganate method, Bray’s extractant and flame photometry, respectively. Soil bulk density was measured by the core sampling method, and soil texture was determined using the Bouyoucos hydrometer technique. The experimental soil was sandy clay (49.5 % sand, 36.5 % clay and 14.0 % silt), strongly acidic (pH 5.31), with a bulk density of 1.46 g/cm3, available water-holding capacity of 0.115 cm3/cm3 and EC of 0.041 dS/m. The soil contained 0.56 % oxidizable organic carbon, 220 kg/ha available N, 14.26 kg/ha available P and 133 kg/ha available K. During the study period, the average maximum and minimum temperatures were 29.6 and 16.7 °C, respectively. The crop received 48 mm of winter rainfall during the 2023–2024 season, while no rainfall was recorded during the 2022–2023 crop season.
Experimental design, treatments and crop management
The experiment was conducted using a split-plot design with three replications. Two land management methods were assigned to the main plots: L1 – Broad Bed and Furrow (BBF) and L2 – Flat Bed (FB). Three irrigation schedules were allotted to the subplots: I1 – Irrigation at branching, primordial initiation, flowering and grain filling stages; I2 – Irrigation at branching, primordial initiation and grain filling stages; and I3 – Irrigation at branching and flowering stages. Before growing the quinoa, during the kharif season, transplanted rice was grown in the experimental field in both years. After harvesting the kharif paddy, land preparation was carried out using a tractor-drawn cultivator, followed by a rotavator. Paddy stubbles were removed, and the field was levelled using a tractor-drawn leveller. In BBF system, 90 cm wide beds with 30 cm furrows were prepared manually. The plot size was 7.2 m × 6.0 m. Pre-sowing irrigation was applied to ensure optimal soil moisture at the time of quinoa sowing. Quinoa seeds were treated with carbendazim at the rate of 2 g/kg of seed prior to sowing. The seeds were sown at a shallow depth of 2–3 cm in furrows at a spacing of 30 × 10 cm during the first week of December in both years. Three rows of quinoa were sown on the bed. The recommended fertilizer dose of 100 kg N, 50 kg P2O5 and 50 kg K2O/ha was applied using urea, di-ammonium phosphate (DAP) and muriate of potash (MOP), respectively. Half of the nitrogen, the full dose of phosphorus, and half of the potassium were applied as a basal dose during the final land preparation. The remaining nitrogen and potassium were applied as top dressing after other field operations at 15 days after sowing (DAS). Thinning and gap filling were also carried out along with the intercultural operations at 15 DAS. The first post-sowing irrigation, in a measured quantity, was applied at 20 DAS to all treatments. Subsequent irrigations were provided as per the respective treatment schedules. All other recommended agronomic and plant protection measures were followed uniformly across all plots.
Observations recorded
Plant height was recorded at 20 and 45 days after sowing (DAS) by measuring 10 randomly selected plants from each plot, from the base of the plant to the tip of the uppermost leaf. At maturity, plant height was measured from the base to the tip of the main panicle. Days to 50 % flowering and days to maturity were recorded on a plot-wise basis. At harvest, 10 plants (excluding border plants) were sampled from each plot to record observations on the number of panicles per plant, panicle length, number of branches per plant, number of grains per panicle, panicle weight and 1000-grain weight. Grain and straw yields were recorded at maturity on a plot-wise basis, excluding border rows.
Productivity and profitability analysis
From the harvested sample, 1000 grains were counted from each plot and weighed using an analytical balance in the laboratory to determine the test weight (g) for each plot. The biological yield of quinoa was calculated by adding the grain yield to the straw yield. The harvest index (%) was estimated by dividing the economic yield (grain yield, kg/ha) by the biological yield (kg/ha) and multiplying by 100. The land productivity per day (kg/ha/day) was calculated by dividing the grain yield by the crop duration (days). The economics of quinoa cultivation were computed based on the local market prices of the inputs used and the prevailing market price of quinoa (Mishra et al., Reference Mishra, James, Mohanty and Anand2014; Rautaray et al., Reference Rautaray, Pradhan, Mohanty, Dubey, Roychaudhuri, Mohanty, Mishra and Ambast2020). The benefit-cost (B:C) ratio was calculated by dividing the gross return (US$/ha) by the cost of cultivation (US$/ha), while the cost of production (US$/kg) was calculated by dividing the total cost of cultivation by the grain yield. The economic analysis was carried out using 2023–2024 as the reference year.
Water productivity
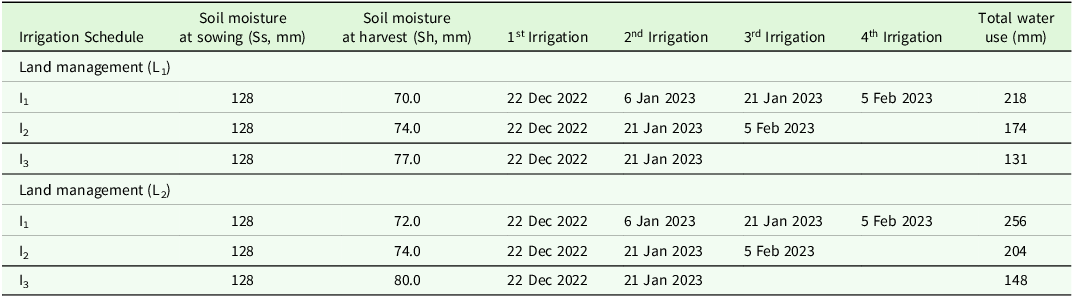
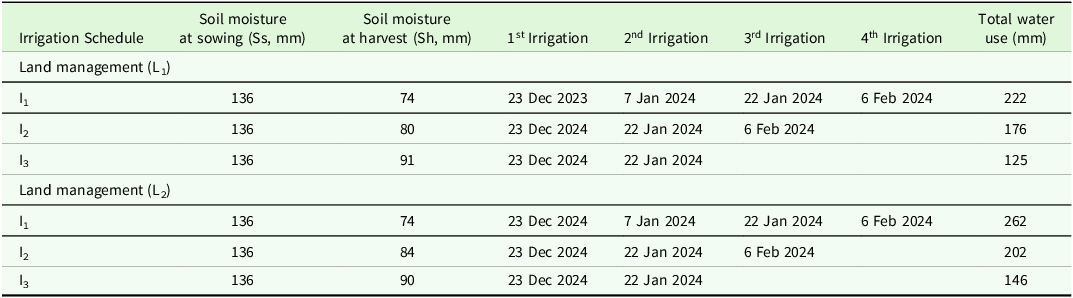
Physical water productivity was calculated as the ratio of grain yield (kg/ha) to the total water used by the crop (m 3 ), while economic water productivity was estimated by dividing the gross returns (US$/ha) by the total water used (m 3 ). The total water used by the crop comprised the irrigation applied and the contribution of profile soil moisture during the crop growth period. The profile moisture contribution (ΔS) was estimated by calculating the difference in soil moisture content (0–60 cm) between crop harvest and the subsequent sowing period, as described by Pradhan et al. (Reference Pradhan, Sehgal, Das, Jain, Bandyopadhyay, Singh and Sharma2014). Accordingly, total water use (TWU) was computed as: TWU = Irrigation + ΔS, where ΔS = Sh – Ss; Sh is the profile soil moisture at harvest and Ss is the profile soil moisture at sowing.
Irrigation was scheduled at the critical growth stages of quinoa, namely branching, panicle (primordial) initiation, flowering and grain-filling (Patnaik et al., Reference Patnaik, Baliarsingh, Dwibedi, Rath, Mishra, Panda and Samal2023; Salim et al., Reference Salim, Hadeethi and Alhadithi2020). Water was applied through irrigation pipes using a 5-hp diesel pump. The depth of irrigation was considered as 50 % of the available water content within the effective root zone of quinoa (0–60 cm). The field capacity and permanent wilting point of the experimental soil were 25 and 10 %, respectively. Based on these parameters, the calculated irrigation depth for flatbed plots was 50 mm. For broad bed and furrow plots, the irrigation depth was reduced to 40 mm, assuming a 20 % water saving under the broad bed and furrow method (Bana et al., Reference Bana, Prijone, Ariffin and Marno2013; Fahong et al., Reference Fahong, Xuqing and Sayre2004). The dates of irrigation, quantity of water applied, and the total seasonal water requirement are provided in Tables 1 and 2.
Irrigation details and total water use under different treatments during 2022–2023

L1: Broad bed and Furrow, L2: Flatbed, I1: irrigation at branching, primordial initiation, flowering and grain filling, I2: irrigation at branching, primordial initiation and grain filling and I3: Irrigation at branching and flowering; The amount of irrigation water applied per irrigation event differed between land configurations: 40 mm under L1 (broad bed and furrow) and 50 mm under L2 (flatbed irrigation).
Irrigation details and total water use under different treatments during 2023–2024

L1: Broad bed and Furrow, L2: Flatbed, I1: irrigation at branching, primordial initiation, flowering and grain filling, I2: irrigation at branching, primordial initiation and grain filling and I3: Irrigation at branching and flowering.
Energy analysis
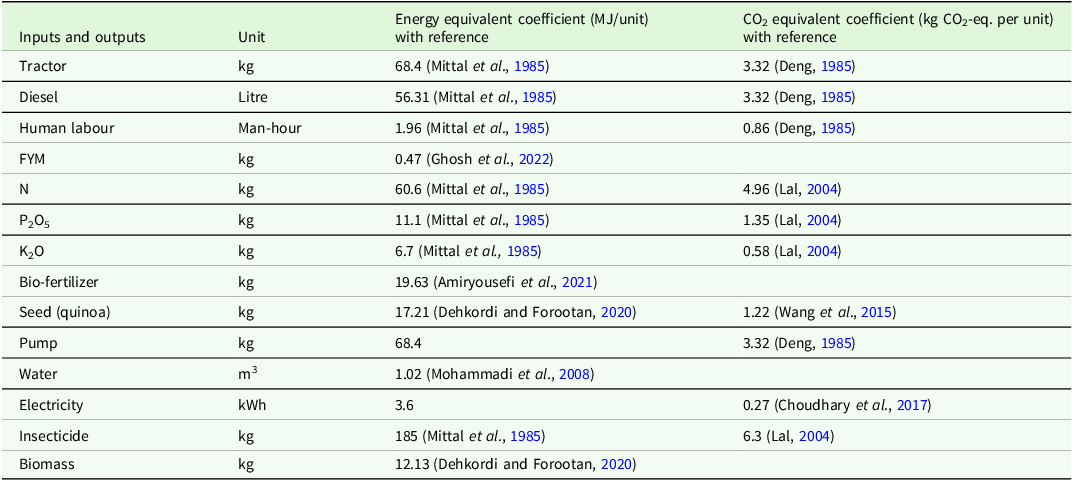
For calculating energy used, a comprehensive inventory of all crop inputs (diesel, electricity, human labour, water, machinery, fertilizers, chemicals, seed, etc.) under various management practices, along with crop outputs (biological yield), were considered. The physical quantities of inputs like diesel, irrigation water, fertilizer, chemicals, seed, etc., and outputs like biological yields were converted into energy units using standard energy coefficients from published literature (Amiryousefi et al., Reference Amiryousefi, Tadayon and Ebrahimi2021; Dehkordi and Forootan, Reference Dehkordi and Forootan2020; Ghosh et al., Reference Ghosh, Das, Rana, Biswas, Das, Singh, Bhattacharyya, Datta, Rathi and Bhatia2022; Mittal et al., Reference Mittal, Mittal and Dhawan1985; Mohammadi et al., Reference Mohammadi, Tabatabaeefar, Shahin, Rafiee and Keyhani2008). Energy equivalent coefficients for each input item were obtained from various literature sources and are presented in Table 3. The total input energy (MJ/ha) for each treatment was calculated by summing the energy of individual input operations, while the output energy was determined by summing the energy content of grain and stover. The environmental energy sources, such as solar radiation, rainfall and wind, were not considered in this study. Inputs were categorized based on their source (machinery, fuels, fertilizers, human labour, chemicals, water and seed) and farm operations (land preparation, sowing, weeding, irrigation, fertilizer application, plant protection and harvesting). In addition, energy inputs were classified as direct (diesel, electricity, human labour and water) and indirect (machinery, fertilizers, chemicals and seed), as well as renewable (human labour, seed and water) and non-renewable (fertilizers, machinery, chemicals, diesel and electricity), following the methodologies of Parihar et al. (Reference Parihar, Jat, Singh, Ghosh, Rathore, Kumar, Pradhan, Majumdar, Satyanarayana, Jat, Saharawat, Kuri and Saveipune2017), Ghosh et al. (Reference Ghosh, Das, Rana, Biswas, Das, Singh, Bhattacharyya, Datta, Rathi and Bhatia2022), Meena et al. (Reference Meena, Sammauria, Gupta, Gupta, Behera, Saxena, Yadav, Singh, Meena, Raza, Anil and Lal2022) and Yadav et al. (Reference Yadav, Singh, Kumar, Behera, Kumar, Yadav, Raza, Lal, Meena, Makarana, Baral, Panigrahi and Pradhan2025).
Energy and carbon equivalent coefficients of all inputs and outputs used in the study

Various energy indices were computed using standard formulae as described by Ghosh et al. (Reference Ghosh, Das, Rana, Biswas, Das, Singh, Bhattacharyya, Datta, Rathi and Bhatia2022), Meena et al. (Reference Meena, Sammauria, Gupta, Gupta, Behera, Saxena, Yadav, Singh, Meena, Raza, Anil and Lal2022) and Yadav et al. (Reference Yadav, Singh, Kumar, Behera, Kumar, Yadav, Raza, Lal, Meena, Makarana, Baral, Panigrahi and Pradhan2025), as presented below.
 ${\rm{NE = OE-IE}}$
 ${\rm{EUE = OE/IE}}$
 ${\rm{EP = GY/IE}}$
 ${\rm{SE = IE/GY}}$
where NE is net energy (MJ/ha), OE is output energy (MJ/ha), IE is input energy (MJ/ha), EUE is energy use efficiency, EP is energy productivity (kg/MJ), GY is grain yield (kg/ha) and SE is specific energy (MJ/kg).
Carbon footprint analysis
Greenhouse gas (GHG) emissions per unit area represent the spatial scale carbon footprint, while GHG emissions per unit of productivity represent the yield scale carbon footprint. The spatial scale carbon footprint (SCF) was calculated by estimating the total GHG emissions (CO2, N2O and CH4) during the crop growth period from various inputs, using the quantity consumed and corresponding CO2-equivalent coefficients (Table 3). Nitrous oxide (N2O) emissions, resulting from the application of nitrogen fertilizers, were estimated using the formula provided by Tubiello et al. (Reference Tubiello, Salvatore, Ferrara, House, Federici, Rossi, Biancalani, Condor Golec, Jacobs, Flammini and Prosperi2015):
 $\eqalign{\rm{N_2}O(C{O_2}\, \hbox{-}\, eq.perha) = Quantity\;of\;N\;applied{\rm{ }} \cr \times \;0.01{\rm{ }} \times \;1.571{\rm{ }} \times \;298}$
where 0.01 is the emission factor, 1.571 is the conversion factor from N-to-N2O and 298 is the global warming potential (GWP) of N2O. Methane (CH4) emissions typically occur under anaerobic, waterlogged soil conditions where the soil redox potential falls below −0.2 V. However, in the present study, the soil redox potential remained above this threshold, and no on-farm burning of crop residues occurred. Therefore, only CO2 and N2O emissions were considered. The total carbon output of the system was estimated by multiplying the system productivity by 0.44, considering plant dry matter contains 44 % carbon (Yadav et al., Reference Yadav, Singh, Kumar, Behera, Kumar, Yadav, Raza, Lal, Meena, Makarana, Baral, Panigrahi and Pradhan2025). Carbon indices for different treatments were calculated using the following formulas (Choudhary et al., Reference Choudhary, Rana, Bana, Ghasal, Choudhary, Jakhar and Verma2017; Ghosh et al., Reference Ghosh, Das, Rana, Biswas, Das, Singh, Bhattacharyya, Datta, Rathi and Bhatia2022; Lal, Reference Lal2004; Meena et al., Reference Meena, Sammauria, Gupta, Gupta, Behera, Saxena, Yadav, Singh, Meena, Raza, Anil and Lal2022; Yadav et al., Reference Yadav, Singh, Kumar, Behera, Kumar, Yadav, Raza, Lal, Meena, Makarana, Baral, Panigrahi and Pradhan2025):
 ${\rm{CI = SCF \times 0.27}}$
 ${\rm{CE = CO/CI}}$
 ${\rm{CSI = (CO - CI)/CI}}$
 ${\rm{YSCF = SCF/Productivity}}$
where CI is the carbon input (kg C-eq./ha), CO is carbon output (kg C-eq./ha), CSI is carbon sustainability index, SCF is the spatial scale carbon footprint (kg CO2-eq./ha), 0.27 is the conversion factor from CO2 to C, CE is carbon efficiency, CSI is the carbon sustainability index, YSCF is the yield scale carbon footprint (kg CO2-eq./kg of yield), and productivity is expressed in kg/ha.
Radiation conversion efficiency
Daily incoming solar radiation was estimated following the procedure described by Hargreaves and Samani (Reference Hargreaves and Samani1982), using extraterrestrial radiation along with maximum and minimum temperatures. The daily incident solar radiation was then multiplied by a factor of 0.48 (Monteith, Reference Monteith1972) to estimate the incoming photosynthetically active radiation (PAR). The daily incident PAR above the crop canopy (quinoa) was accumulated over the crop growth period to obtain the total incident PAR. The radiation conversion efficiency was calculated by dividing the above-ground biomass by the total incident PAR (Fahong et al., Reference Fahong, Xuqing and Sayre2004; Parihar et al., Reference Parihar, Jat, Singh, Ghosh, Rathore, Kumar, Pradhan, Majumdar, Satyanarayana, Jat, Saharawat, Kuri and Saveipune2017).
Nitrogen use efficiency
Nitrogen use efficiency was expressed as partial factor productivity of nitrogen (PFPN), which is obtained by dividing grain yield (kg/ha) by total nitrogen applied (kg/ha). Higher PFPN values indicate more efficient use of nitrogen (Pradhan et al., Reference Pradhan, Bandyopadhayay, Chopra, Krishnan, Jain, Singh and Chand2017).
Statistical analysis
The collected data were statistically analysed using OPSTAT, an online statistical analysis software developed in Python by Chaudhary Charan Singh Haryana Agricultural University, Hisar, Haryana, India (available at: https://opstat.pythonanywhere.com/). The analysis was conducted following a split-plot design, in accordance with the experimental layout. Treatment effects were tested using analysis of variance (ANOVA) appropriate for a split-plot design. Treatment means were compared using the Least Significant Difference (LSD) test at the 5 % level of significance (p ≤ 0.05) to identify statistically significant differences among the various land managements, irrigation schedules and their interactions. The interaction effects between land management and irrigation treatments were non-significant. In the present study, pooled data from both years were used for analysis.
Results
Weed flora and infestation
At 15 days after sowing (DAS) of quinoa, the experimental field was infested with 14 weed species belonging to 9 different families. Broadleaved weeds were predominant, accounting for 51.2 % of the total weed population, followed by grassy weeds (31.8 %). Among the broadleaved weeds, Portulaca oleracea, Euphorbia hirta, Alternanthera philoxeroides and Phyllanthus niruri were the most commonly observed across all plots. In the grassy weed category, Eleusine indica and Cynodondactylon were dominant, while sedge weeds such as Cyperus rotundus and Cyperus iria were also present. Land preparation had a significant impact on weed growth. Plots sown using the Broad Bed and Furrow (BBF) method showed a notable reduction in weed population by 21.9 % for broadleaved weeds, 19.2 % for grassy weeds and 19.9 % for the total weed population compared to those sown on flatbeds. In contrast, different irrigation schedules did not have a significant effect on weed infestation levels.
Plant growth and growth attributes
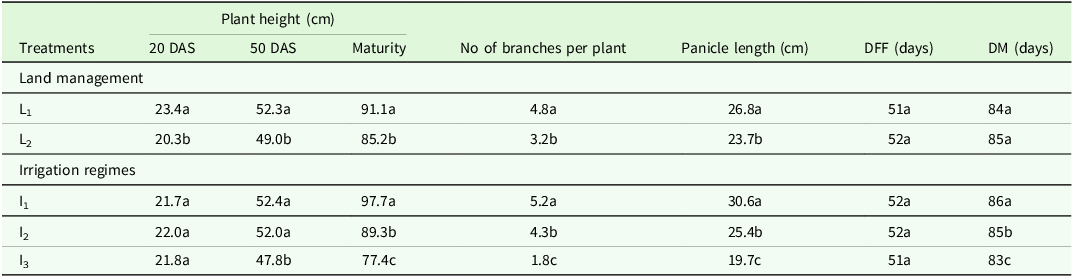
Adequate crop growth during the vegetative stage is crucial for establishing a strong source – sink relationship, facilitating the synthesis of maximum food reserves and ultimately enhancing crop yield. Different sowing methods under various land preparation significantly influenced plant height at 20 and 45 days after sowing (DAS), as well as at maturity. Quinoa sown using the Broad Bed and Furrow (BBF) method exhibited a significant increase in plant height by 15.3, 6.7 and 6.9 % at 20 DAS, 45 DAS and maturity, respectively, compared to flatbed sowing (Table 4). Irrigation scheduling also played a key role in plant growth. Scheduling irrigation at branching, primordial initiation, flowering and grain filling stages (I1) resulted in the highest plant height at maturity (97.7 cm), compared to other treatments. Growth attributes such as the number of branches per plant and the length of the primary panicle were significantly influenced by both sowing methods and irrigation regimes. BBF sowing resulted in a higher number of branches per plant (7.6) and longer panicle length (26.8 cm) than flatbed sowing. Similarly, the application of four irrigations at all critical growth stages (I1) produced a greater number of branches per plant and longer primary panicles compared to I2 and I3 irrigation schedules. However, sowing methods and irrigation schedules did not have a significant effect on the number of days to 50 % flowering. In contrast, applying only two irrigations at the branching and flowering stages (I3) led to earlier maturity by two days.
Growth and growth attributes of quinoa as influenced by land management and irrigation schedules

The columns followed by same letter are not significantly different at p < 0.05 as per Duncan’s Multiple Range Test (DMRT). (DAS: Days after sowing, DFF: Days to 50 % flowering, DM: Days to maturity, L1: Broad bed and Furrow, L2: Flatbed, I1: irrigation at branching, primordial initiation, flowering and grain filling, I2: irrigation at branching, primordial initiation and grain filling and I3: Irrigation at branching and flowering).
Yield, yield attributes and land productivity
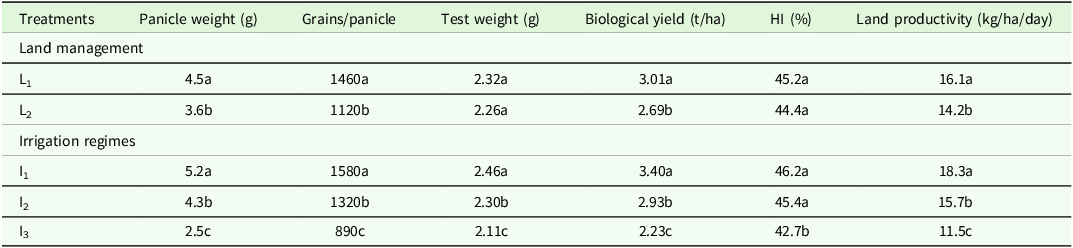
Land management and different irrigation schedules had a significant effect on the growth attributes, grain yield and total biomass of the quinoa crop. In this study, sowing quinoa on broad bed and furrow (BBF) resulted in an increase in grain yield (12.6 %), stover yield (10.1 %), biological yield (11.9 %) and land productivity (13.4 %) compared to sowing on flatbeds. Application of irrigation at branching, primordial initiation, flowering and grain filling stages (I1) led to a higher number of grains per panicle, greater panicle weight and higher test weight, which ultimately resulted in increased grain yield (1.57 t/ha), straw yield (1.83 t/ha), biological yield (3.40 t/ha) and harvest index (46.2 %) compared to I2 and I3 (Table 5, Figure 1a and 1b). Applying only two irrigations at the branching and flowering stages (I3) reduced the grain, straw and biological yields by 38.9, 30.6 and 34.4 %, respectively, compared to four irrigations in I1 plots. The land productivity of quinoa was significantly influenced by irrigation regimes. Scheduling irrigation at the branching, primordial initiation, flowering and grain filling stages (I1) resulted in higher land productivity (18.3 kg/ha/day) compared to plots under I2 and I3 irrigation schedules.
Yield, yield attributes and land productivity of quinoa as influenced by land management and irrigation schedules

The numbers followed by same letter are not significantly different at p < 0.05 as per Duncan’s Multiple Range Test (DMRT). (HI: Harvest index, L1: Broad bed and Furrow, L2: Flatbed, I1: irrigation at branching, primordial initiation, flowering and grain filling, I2: irrigation at branching, primordial initiation and grain filling and I3: Irrigation at branching and flowering).
(a) and (b). Effect of land management and water management on grain and stover yield of quinoa. Bars followed by the same letter are not significantly different at p < 0.05 according to Duncan’s Multiple Range Test (DMRT). L1 = broad bed and furrow; L2 = flatbed; I1 = irrigation at branching, primordial initiation, flowering and grain filling; I2 = irrigation at branching, primordial initiation and grain filling; I3 = irrigation at branching and flowering.

Economics of quinoa production
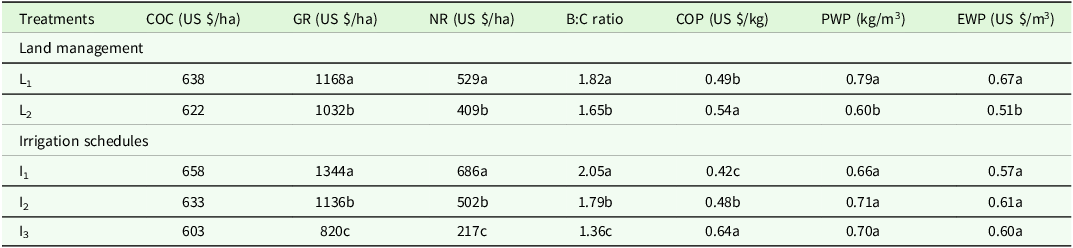
Sowing methods and irrigation regimes resulted in variations in gross return, net return, benefit-cost (B:C) ratio and cost of production of quinoa. Plots sown on broad bed and furrow (BBF) recorded significantly higher gross return (US $1168 per ha), net return (US $529 per ha) and B:C ratio (1.82) compared to flatbed plots (Table 6). The cost of production of quinoa was reduced by 9.8 % in BBF plots compared to flatbed plots. Irrigation scheduling at the branching, primordial initiation, flowering and grain filling stages (I1) resulted in the highest gross return (US $1344 per ha), net return (US $686 per ha), B:C ratio (2.05) and the lowest production cost (US $0.42 per kg of grain).
Economics and water productivity of quinoa as influenced by land management and irrigation schedules

The numbers followed by same letter are not significantly different at p < 0.05 as per Duncan’s Multiple Range Test (DMRT). (COC: Cost of cultivation, GR: Gross return, NR: Net return, B:C ratio: Benefit:Cost ratio, COP: Cost of production, PWP: Physical water productivity, EWP: Economic water productivity, L1: Broad bed and Furrow, L2: Flat bed, I1: irrigation at branching, primordial initiation, flowering and grain filling, I2: irrigation at branching, primordial initiation and grain filling and I3: Irrigation at branching and flowering).
Water productivity
Quinoa planted on broad bed and furrow (BBF) recorded significantly higher physical water productivity (0.79 kg/m3) and economic water productivity (US $0.67 per m3) compared to planting on flatbeds (Table 6). Irrigation scheduling at the branching, primordial initiation, flowering and grain filling stages (I1) resulted in a physical water productivity of 0.66 kg/m3 and an economic water productivity of US $0.57 per m3, which were statistically at par with treatments I2 and I3, despite reduced water application in those treatments.
Energy use efficiency and energy indices
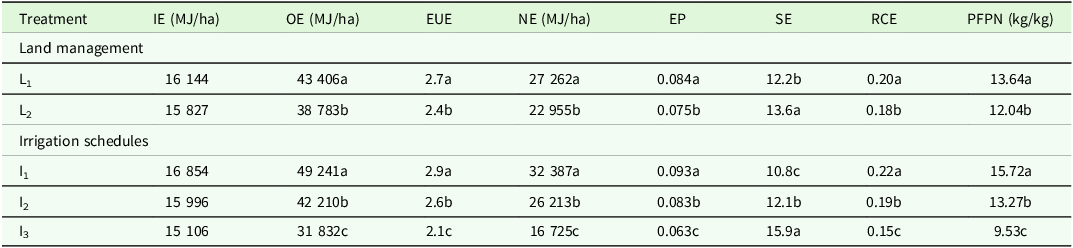
The energy utilization patterns across different treatments were analysed on both input-wise and operation-wise bases and are presented in Figures 2 and 3. Among the treatments, the highest energy use was recorded in BBF with I1 irrigation (16 924 MJ/ha), while the lowest was observed in FB with I3 irrigation (14 865 MJ/ha). Among the various inputs, fertilizer accounted for the largest share of energy use (58 %), followed by fuel (23 %). In terms of operations, fertilizer application contributed the highest proportion of energy use (59 %), followed by land preparation (18 %) and irrigation (16 %). The results of the energy analysis of quinoa under different sowing methods and irrigation regimes are presented in Table 7. Quinoa sown using the broad bed and furrow (BBF) method required 2 % more input energy compared to sowing on flatbeds. However, energy use efficiency under the BBF method was 12.5 % higher than that of the flatbed method. Similarly, quinoa sown on BBF recorded a significantly higher net energy output of 27 262 MJ/ha, compared to 22 955 MJ/ha under flatbed sowing. Irrigation scheduling at the branching, primordial initiation, flowering and grain filling stages (I1) resulted in a significantly higher energy use efficiency of 2.9 and net energy output of 32 387 MJ/ha, compared to the I2 and I3 irrigation treatments.
Heatmap showing the distribution of input-wise energy use (MJ/ha) across land and water management treatments in quinoa. Treatments include broad bed and furrow (BBF) and flatbed (FB) configurations combined with different irrigation schedules (I1–I3). Values within cells indicate the absolute energy contribution of each input.

Heatmap illustrating operation-wise energy use (MJ/ha) under different land and water management treatments in quinoa. Treatments comprise broad bed and furrow (BBF) and flatbed (FB) systems combined with irrigation schedules (I1–I3). Values shown within cells represent the energy input associated with each field operation.

Resource use efficiency of quinoa as influenced by land management and irrigation schedules

The numbers followed by same letter are not significantly different at p < 0.05 as per Duncan’s Multiple Range Test (DMRT). (IE: Input energy, OE: Output energy, EUE: Energy use efficiency, NE: Net energy, EP: Energy productivity, SE: Specific energy, RCE: Radiation conversion efficiency, PFPN: partial factor productivity of nitrogen, L1: Sowing on Broad bed and Furrow, L2: Sowing on Flatbed, I1: Irrigation at branching, primordial initiation, flowering and grain filling stage, I2: Irrigation at branching, primordial initiation and grain filling irrigation stage and I3: Irrigation at branching and flowering stage).
Carbon footprint
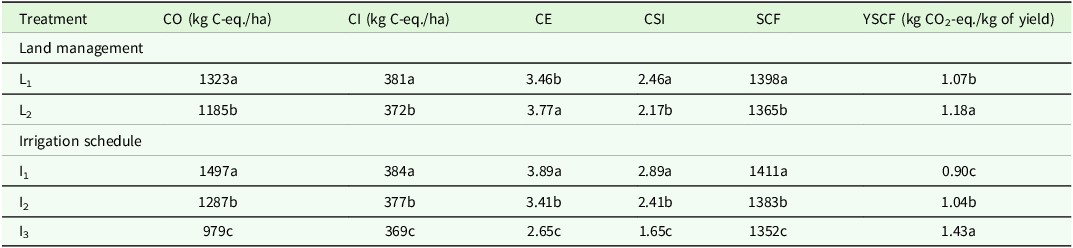
The highest total carbon footprint (GHG emissions) was recorded in BBF with I1 irrigation (1425 kg CO2-eq./ha), while the lowest was observed in FB with I3 irrigation (1333 kg CO2-eq./ha) (Figure 4). Among the various inputs, fertilizer contributed the largest share (43 %) to the total carbon footprint, followed by N2O emissions from the field (34 %) and fuel use (17 %). Land preparation had a significant effect on the carbon footprint of quinoa cultivation (Table 8). The broad bed and furrow (BBF) method recorded significantly higher Carbon Efficiency (CE) of 3.46 and Carbon Sustainability Index (CSI) of 2.46 compared to flatbeds. However, BBF plots showed a lower Yield Scale Carbon Footprint (YSCF) value of 1.07 compared to flatbed plots. Irrigation scheduling at the branching, primordial initiation, flowering and grain filling stages (I1) resulted in significantly higher CE (3.81) and CSI (2.89), along with a lower YSCF value (0.90), compared to the I2 and I3 irrigation schedules.
Heatmap showing source-wise carbon footprint (kg CO2 eq/ha) under different land and water management treatments in quinoa. Treatments include broad bed and furrow (BBF) and flatbed (FB) systems combined with irrigation schedules (I1–I3). Values within cells represent the contribution of individual sources to the total carbon footprint.

Carbon footprint of quinoa as influenced by land management and irrigation schedules

The numbers followed by same letter are not significantly different at p < 0.05 as per Duncan’s Multiple Range Test (DMRT). (CO: Carbon output, CI: Carbon input, CE: Carbon efficiency, CSI: Carbon sustainability index, SCF: Spatial scale carbon footprint, YSCF: Yield scale carbon footprint, L1: Sowing on Broad bed and Furrow, L2: Sowing on Flat bed, I1: Irrigation at branching, primordial initiation, flowering and grain filling stage, I2: Irrigation at branching, primordial initiation and grain filling irrigation stage and I3: Irrigation at branching and flowering stage).
Radiation conversion efficiency
Land preparation and different irrigation schedules had a significant effect on the radiant conversion efficiency (RCE) of the quinoa crop (Table 7). The broad bed and furrow (BBF) method resulted in a significantly higher RCE value of 0.20 compared to flatbeds. Irrigation scheduling at the branching, primordial initiation, flowering and grain filling stages (I1) recorded a significantly higher RCE of 0.22, in contrast to the I2 and I3 irrigation schedules.
Nitrogen use efficiency
Sowing quinoa using the broad bed and furrow (BBF) method resulted in a 13.3 % increase in partial factor productivity of nitrogen (PFPN) compared to flatbed sowing (Table 7). Different irrigation schedules significantly influenced the nitrogen use efficiency (NUE) of quinoa. Irrigation scheduling at the branching, primordial initiation, flowering and grain filling stages (I1) recorded the highest PFPN value of 13.64 kg/kg. In contrast, irrigation schedules I2 and I3 led to a reduction in NUE by 15.6 and 39.4 %, respectively, compared to I1.
Discussion
Weed infestation is one of the key factors reducing the yield of quinoa (Langeroodi et al., Reference Langeroodi, Mancinelli and Radicetti2020). Weeds compete with the quinoa crop due to its slow growth during the early developmental stages and are typically controlled through manual weeding (Taaime et al., Reference Taaime, Rafik, El Mejahed, Oukarroum, Choukr-Allah, Bouabid and El Gharous2023). Cultural practices such as planting techniques and optimal irrigation regimes are considered effective components of integrated weed management. Sowing on broad bed and furrow (BBF) indirectly suppresses weed infestation by creating favourable conditions for early crop growth while potentially inhibiting the germination of weed seeds present in the soil seed bank (Rao et al., Reference Rao, Reddy and Ramana2022). In the present experiment, following conventional land preparation, the soil was further modified to create BBF structures, which effectively suppressed the emergence of both broadleaved and grassy weeds compared to flatbed sowing. There was no significant effect of different irrigation schedules on weed density, as the first irrigation was applied at 20 days after sowing (DAS). By that time, weeds in the quinoa plots had already been managed through hoeing and manual weeding at 15 DAS.
Improved soil moisture availability and better soil aeration under the broad bed and furrow (BBF) system facilitated better crop establishment and reduced crop-weed competition during the early stages of growth. This, in turn, promoted greater plant height at various growth stages and increased the number of branches per plant. Sowing crops on BBF has been reported to enhance plant height and the number of branches per plant (Choudhary et al., Reference Choudhary, Tetarwal, Baldevram, Bijarnia and Kumawat2022a; Elamathi, Reference Elamathi2014; Joshi et al., Reference Joshi, Patel, Barad, Macwan and Ehsas2018; Paslawar and Deotalu, Reference Paslawar and Deotalu2015; Tomar et al., Reference Tomar, Dwivedi, Singh and Singh2016). In the present experiment, the observed increase in plant height, number of branches per plant and panicle length may be attributed to improved nutrient uptake during the early growth stages, facilitated by favourable soil moisture conditions under the BBF method.
The higher grain, straw and biological yield of quinoa under the broad bed and furrow (BBF) system was attributed to a greater number of branches per plant, more grains per panicle and higher test weight compared to flatbed sowing. Test weight of quinoa seeds is known to be significantly affected by moisture stress (Tabiei et al., 2022; Telahigue et al., Reference Telahigue, Yahia, Aljane, Belhoucheff and Toumi2017). The improved yield observed under BBF can be attributed to better crop establishment, reduced weed competition and enhanced soil moisture utilization, all of which contributed to improved plant growth and development. Land management and sowing methods had a significant impact on growth parameters, yield attributes and grain yield of quinoa (Choudhary et al., Reference Choudhary, Tetarwal, Baldevram, Bijarnia and Kumawat2022a, Reference Choudhary, Tetarwal, Bijarnia, Kumawat, Ghasil and Jangid2022b; Dao et al., Reference Dao, Alvar-Beltran, Guira, Nebie and Sanou2020). Modification of land through BBF improves soil physical properties such as better aeration, lower root penetration resistance and overall soil health, resulting in improved crop emergence and establishment, which ultimately reflects in higher yields (Ramesh et al., Reference Ramesh, Rathika, Nagarajan and Shanmugapriya2020). Row sowing on broad beds has also been shown to increase water productivity and seed yield in quinoa (Sezen et al., Reference Sezen, Yildiz, Ozer, Jacobsen, Hale, Zeliha, Orhan and Clever2024).
To achieve the yield potential of quinoa, the crop must be irrigated at regular intervals to avoid moisture stress during critical growth stages (Wang et al., Reference Wang, Wang, Shock, Meng and Qiao2020). Quinoa showed a significant response to different irrigation regimes, which had a notable impact on both productivity and economics (Satapathy et al., Reference Satapathy, Panda, Rautaray and Pradhan2023; Satapathy et al., Reference Satapathy, Pradhan, Panda, Behera, Rautaray and Sarangi2025). While quinoa is relatively tolerant to moisture stress during the vegetative stage, it becomes more sensitive during the reproductive period. Stress during the reproductive phase leads to a greater reduction in seed yield (Salim et al., Reference Salim, Rasheed, AI-Deen and ALMunum2024). In this study, maintaining favourable soil moisture throughout the crop growth period by providing irrigations at branching (20 DAS), primordial initiation (35 DAS), flowering (50 DAS) and grain filling (65 DAS) resulted in improved yield attributes, higher grain yield and greater total biological yield. The increased grain yield within the same crop duration contributed to higher land productivity (kg/ha/day) in plots sown using BBF (L1) compared to flatbeds (L2). Choudhary et al. (Reference Choudhary, Tetarwal, Baldevram, Bijarnia and Kumawat2022a) also reported higher grain yields with irrigation applied at 20–25, 55–60 and 90–95 DAS. In this study, quinoa performed better in terms of yield and other parameters when irrigated at four critical growth stages, likely due to the sandy clay soil and its moderate water-holding capacity.
Economics is the ultimate criterion for recommending any agronomic practice aimed at realizing the yield potential of field crops. The preparation of broad bed and furrow (BBF) requires additional manpower and farm machinery, which slightly increases the cost of land preparation compared to flatbeds. However, reduced weed infestation, better crop establishment and improved early crop growth in BBF plots lowered the expenses related to weed control, thinning and intercultural operations compared to flatbed sowing. The higher grain yield achieved under the BBF system, with only a minimal increase in the overall cost of cultivation, resulted in a reduced cost of quinoa seed production compared to flatbed plots. Similarly, while the application of four irrigations in the I1 plots slightly increased irrigation costs, the substantial improvement in grain yield – compared to plots with three (I2) or two (I3) irrigations – ultimately led to higher net returns and an improved benefit-cost (B:C) ratio.
Land preparation has significantly influenced water productivity in quinoa cultivation (Dao et al., Reference Dehkordi and Forootan2020; Hamza et al., Reference Hamza, Usman, Malik, Saad, Ghulam and Khan2021). The broad bed and furrow (BBF) sowing method facilitated better extraction of soil moisture from deeper root zones due to improved root development and early crop establishment, resulting in higher grain yield and enhanced water productivity (Choudhary et al., Reference Choudhary, Tetarwal, Baldevram, Bijarnia and Kumawat2022a). In this study, the BBF method recorded significantly higher physical and economic water productivity. This improvement can be attributed to increased plant height, panicle length and test weight, all of which contributed to higher grain yield, lower water use (14 %) and overall water productivity. Efficient irrigation practices are crucial for reducing water consumption, improving crop yield and increasing water productivity (Abdelgalil et al., Reference Abdelgalil, Hefzy, Sas-Paszt, Ali, Lamlom and Abdelghany2023; Khaled et al., Reference Khaled, Abdel-Nasser, Hussein, Darwish and Ibrahim2021). Judicious irrigation scheduling helps conserve water by reducing evaporation losses and improving water use efficiency (Ahmadi et al., Reference Ahmadi, Solgi and Sepaskhah2019). In this study, irrigation scheduling at the branching, primordial initiation and grain filling stages (I2) resulted in high physical and economic water productivity, which was statistically at par with the productivity achieved under the I1 schedule that included four irrigations.
Adopting appropriate sowing techniques combined with optimal irrigation scheduling enhances the energy efficiency of quinoa cultivation (Dehkordi and Forootan, Reference Dehkordi and Forootan2020). These practices contribute significantly to reducing the reliance on non-renewable energy sources, thereby making the production system more sustainable (Soltanzadeh and Borazjani, Reference Soltanzadeh and Borazjani2022). Among various agricultural inputs, irrigation water ranks second only to chemical fertilizers in terms of total energy consumption in quinoa production (Amiryousefi et al., Reference Amiryousefi, Tadayon and Ebrahimi2021). Therefore, cautious water management plays a crucial role in improving energy use efficiency (EUE) and maximizing the net energy balance. In the present study, sowing quinoa using the broad bed and furrow (BBF) method, in combination with efficient irrigation practices, resulted in a higher energy ratio and a substantial positive net energy output. The BBF system, by improving water retention, soil aeration and nutrient uptake, not only enhanced crop growth but also minimized the energy expended per unit of output. This demonstrates the energy efficiency of quinoa cultivation under BBF, particularly when supported by timely and well-regulated irrigation schedules.
Proper land management, combined with timely and adequate irrigation, ensures higher land productivity, water use efficiency and carbon use efficiency in quinoa cultivation (Pinto et al., Reference Pinto, Fischer, Wilckens, Bustamante and Berti2021). The carbon footprint of quinoa is comparable to that of other grain crops and is significantly lower than that of rice (Dehkordi and Forootan, Reference Dehkordi and Forootan2020). In this study, sowing quinoa on broad bed and furrow (BBF) and applying four irrigations under the I1 schedule promoted better plant growth and significantly enhanced grain yield. This, in turn, resulted in improved carbon use efficiency compared to flatbed sowing methods.
The efficiency of nitrogenous fertilizers, in terms of both crop yield and quality, is directly influenced by irrigation regimes (Alandia et al., Reference Alandia, Jacobsen, Kyvsgaard, Condori and Liu2016). Water productivity in quinoa is significantly regulated by the combined effects of nitrogen and water management practices (Abdelgalil et al., Reference Abdelgalil, Hefzy, Sas-Paszt, Ali, Lamlom and Abdelghany2023). In this study, irrigation applied through furrows in BBF plots likely contributed to improved water management by minimizing water losses, enhancing soil structure and promoting better crop establishment. These factors collectively led to a higher partial factor productivity of nitrogen (PFPN) compared to flatbed sowing. The application of irrigation at all four critical growth stages – branching, primordial initiation, flowering and grain filling – helped maintain favourable soil moisture conditions in the root zone. This not only enhanced nitrogen uptake but also significantly boosted grain yield. The combination of the recommended dose of fertilizer with the I1 irrigation schedule resulted in a markedly higher PFPN compared to moisture-stressed plots, underlining the importance of synchronized water and nutrient management for maximizing productivity.
Conclusions
The present study highlights the significant impact of land management and irrigation scheduling on the growth, yield, economics, water productivity, energy efficiency and carbon and nutrient use efficiency of quinoa. The sowing of quinoa on broad bed and furrow (BBF) systems significantly improved crop establishment and reduced weed pressure, resulting in higher grain yield, stover yield and total biomass compared to flatbed sowing. Among the irrigation treatments, scheduling water application at four critical growth stages, branching, primordial initiation, flowering and grain filling (I1) proved to be the most effective for crop growth and increasing productivity. BBF combined with I1 irrigation achieved the highest land productivity, water productivity, energy use efficiency and nitrogen use efficiency. Additionally, it led to improved economic returns and reduced production costs, making the system not only agronomically effective but also economically viable. Furthermore, carbon footprint analysis revealed higher carbon efficiency and sustainability indices under BBF and I1 treatments. Overall, the integrated approach of adopting BBF sowing with optimized irrigation scheduling ensures a resilient, resource-efficient and sustainable production system for quinoa, particularly under semi-arid conditions with sandy clay soils. These findings can serve as a guiding framework for improving quinoa productivity in similar agro-ecological regions.
Acknowledgements
We sincerely acknowledge ICAR-Indian Institute of Water Management, Bhubaneswar, for providing facilities and assistance in conducting this research.
Author contributions
BSS: Conceptualization, Methodology, Investigation, Data curation, Formal analysis, Visualization, Writing – original draft; SP: Conceptualization, Methodology, Investigation, Data curation, Writing – review and editing; DKP, BB: Validation, Writing – review and editing; AKN, SKR: Supervision, Writing – review and editing; SM, AS: Resources, Writing – review and editing.
Funding statement
Research was supported by the Indian Council of Agricultural Research, Department of Agricultural Research and Education, Government of India.
Competing interests
The authors declare that they have no known competing financial interests or personal relationships that could have appeared to influence the work reported in this paper.
Ethical standards
Ethical approval is not applicable.