Implications
A comprehensive lipid analysis showed that foal meat is a rich source of n-3 polyunsaturated fatty acids (PUFAs) which is healthy for humans. However, when animals are young (suckling) or reared under extensive conditions it is difficult to reach levels of n-3 fatty acids (FAs) on an absolute basis required for labeling purposes according to European Food Safety Authority regulation. However, a more thorough knowledge of the neutral lipid (NL) and polar lipid (PL) fractions of horse meat could establish the basis for a better understanding of this red meat in terms of its shelf-life at the retail level and its stability during storage and/or processing.
Introduction
The intramuscular (IM) fat content and its FA composition are related to the nutritional value, sensory attributes and technological quality of meat (Wood et al., Reference Wood, Richardson, Nute, Fisher, Campo, Kasapidou, Sheard and Enser2003 and Reference Wood, Richardson, Nute, Fisher, Campo, Kasapidou, Sheard and Enser2008). In addition, meat FA composition is strongly influenced by the level of fatness, as well as genetic and dietary factors (De Smet et al., Reference De Smet, Raes and Demeyer2004). In general, horse meat was found to be lean with a significant content of n-3 PUFAs (Lorenzo et al., Reference Lorenzo, Crecente, Franco, Sarriés and Gómez2010; Belaunzaran et al., Reference Belaunzaran, Lavín, Barron, Mantecón, Kramer and Aldai2017), and for this reason it has been considered an interesting option from a nutritional point of view. However, the higher PUFA content could also negatively affect its stability during storage and/or processing due to oxidation (Wood et al., Reference Wood, Richardson, Nute, Fisher, Campo, Kasapidou, Sheard and Enser2003). The IM lipids are composed of NL and PLs. The former consists primarily of triacylglycerols, whereas the latter mainly of phosphatidylcholine and phosphatidylethanolamine (Larick and Turner, Reference Larick and Turner1989). Triacylglycerols are essential components of mammalian energy homeostasis, and their content in meat is directly related to the total fat level (0.200% to 5.00% of muscle weight), whereas phospholipids are involved in membrane structure and cell functions (Hornstein et al., Reference Hornstein, Crowe and Hiner1967), and their content is relatively constant (0.200% to 1.00% of muscle weight) (De Smet et al., Reference De Smet, Raes and Demeyer2004). Triacylglycerols were reported to be the major components in the horse NL fraction (55.7% to 63.2% of total lipids), whereas phospholipids represented an average value of 0.695% of muscle weight, ranging from 12.8% to 23.7% of total lipids depending on production system (Sarriés et al., Reference Sarriés, Murray, Troy and Beriain2006).
Meat is also known to contain plasmalogenic lipids in which one of the ester linkages is replaced by a vinyl ether (alk-1-enyl moiety). These compounds are seldom reported in meat, and to our knowledge have never been reported in horse meat. In mammalian tissues, the plasmalogens are only present in small amounts in the NL fraction, whereas in the PL fraction they are major components, particularly in phosphatidylethanolamine (Horrocks, Reference Horrocks1972), where they have been reported to be important components of membrane phospholipids (Nagan and Zoeller, Reference Nagan and Zoeller2001). The ether bond is generally linked to the sn-1 position, whereas long-chain (LC) PUFA occupy the sn-2 position of the molecule. To date, the alkyl chain length of the alkenyl ethers reported in the mammalian tissues did not exceed C18 FAs (Horrocks, Reference Horrocks1972).
A comprehensive analysis of horse lipids that includes the content and localization of acyl and alkenyl moieties in the NL and PL structures is necessary to have a reliable database to evaluate this meat as an alternate nutritional source. It would also provide valuable information to improve the shelf-life at retail conditions of this meat. Such a complete characterization of horse lipids is not currently available. In this manuscript we wish to provide a complete analysis of both the NL and PLs of horse meat and how this composition is affected by the age of the horse and associated feeding practices.
Material and methods
Experimental design and sampling
In the present study two groups of crossbred horses were used. The first group was selected from foals that were naturally suckled by their mothers from birth (March to April 2015) to slaughter (July 2015) at 4 months of age (n=8), and consisted of equal numbers from both sexes. They were managed under grazing conditions. The second group was selected from crossbred males (n=7) born in April 2015, that after weaning (November 2015) were intensively fattened indoors. The amount of commercial concentrate given to foals was gradually increased from 4 to 5 kg/head per day at the start to 10 kg/head per day at the end of the fattening period, and oats and straw were supplied ad libitum. Foals were slaughtered at 12 months of age.
The concentrate was composed by barley, wheat bran, soya, alfalfa, sunflower, beet molasses and a premix of vitamins and trace elements. On dry matter basis, chemical composition of the concentrate was as follows: 18.2% of CP (ISO, 2005), 7.93% of ash (ISO, 2002) and 2.41% of ether extract (American Oil Chemists’ Society (AOCS), 2008), whereas the main FAs were as follows: 16:0 (20.8%), 18:0 (2.25%), 9c-18:1 (14.9%), 18:2n-6 (45.8%) and 18:3n-3 (5.46%).
Foals were slaughtered in a commercial abattoir according to standard procedures. The carcass weight reached an average value of 101±2.38 kg and 272±11.7 kg in suckling and fattened foals, respectively. The 6th to 8th rib joints of the left half carcasses were transported to the laboratory in refrigerated coolers. Then, the longissimus throracis et lumborum (LTL) muscle was dissected and two steaks of ~3-cm thick were cut. The first steak was used to determine the proximate chemical composition using standard procedures (ISO, 2002 and 2005; AOCS, 2008). The second steak was cut into pieces, freeze-dried, ground, vacuum-packaged and stored at −80°C for further lipid analysis.
Muscle lipid extraction and fatty acid esterification
Lipids from 1.5 g of freeze-dried muscle were extracted using chloroform–methanol (2 : 1, v/v; Folch et al., Reference Folch, Lees and Sloane-Stanley1957). Two lipid aliquots of 10 mg were separately methylated using base- (2 ml of Methanolic-Base, 0.5 N from Supelco) and acid- (2 ml of sulfuric acid in methanol, 2%) catalyzed procedures. The latter method assured the complete methylation of all type of lipids; the conversion of acyl and N-acyl lipids into fatty acid methyl ester (FAME), and the alk-1-enyl ethers of plasmalogenic lipids into dimethylacetals (DMA). On the other hand, the base-catalyzed procedure was used to avoid isomerization of CLA (Kramer et al., Reference Kramer, Sehat, Dugan, Mossoba, Yurawecz, Roach, Eulitz, Aalhus, Schaefer and Ku1998). Before derivatization, 0.5 mg of two internal standards (13 : 0 and 23 : 0 methyl esters from Nu-Chek Prep Inc., Elysian, MN, USA) was added for quantitative purposes.
Fractionation of neutral and polar lipid classes
Intramuscular lipids (45 to 60 mg) were fractionated into their NL and PLs using solid-phase extraction (SPE) cartridges packed with silica gel (SupelcleanTM LC-Si SPE Tubes 1 g/6 ml; Supelco, Bellafonte, PA, USA). The NLs were eluted with chloroform (30 ml) and the PLs with methanol (30 ml), as described by Juaneda and Rocquelin (Reference Juaneda and Rocquelin1985). To the individual fractions, and before derivatization, the internal standard (23 : 0 methyl ester) was added at ~0.05 mg/1 mg of lipids, and then transesterified using sequential base- and acid-catalyzed procedures.
Gas chromatographic (GC) analysis of lipid compounds
Fatty acid methyl esters and DMAs were analyzed using a GC equipped with a flame ionization detector (Model 7890A; Agilent Technologies, Wilmington, DE, USA) and coupled with an automatic injector (Model 7693; Agilent Technologies). Samples were injected using a 50 : 1 split ratio on a Supelco SP2560 capillary column (100 m×0.25 mm I.D., 0.2 μm coating; Supelco, Bellefonte, PA, USA) using the 175°C temperature program described by Kramer et al. (Reference Kramer, Hernandez, Cruz-Hernandez, Kraft and Dugan2008). In order to resolve CLA isomers and several other overlapping peaks, the FAMEs were subjected to a second GC analysis using a SLB-IL111 ionic liquid stationary-phase column (100 m×0.25 mm I.D., 0.2 μm coating; Supelco) and using the temperature program described by Delmonte et al. (Reference Delmonte, Fardin Kia, Kramer, Mossoba, Sidisky and Rader2011). Hydrogen was used as a carrier gas at a flow rate of 1 ml/min, the injection volume was 1 µl, and injector and detector ports were set at 250°C.
For identification purposes, reference standards of individual FAMEs (21 : 0, 23 : 0, 26 : 0, 28 : 0) and mixtures such as #463, #603 and #UC-59M CLA were obtained from Nu-Check (Elysian, MN, USA). Linoleic acid (LA; 18:2n-6) and linolenic acid (LNA; 18:3n-3) isomers were purchased from Sigma-Aldrich (CRM47791 and CRM47792, respectively; Sigma-Aldrich, St Louis, MO, USA), and a bacterial mixture was obtained from Matreya (Pleasant Gap, PA, USA). Many of trans-FA, CLA, non-conjugated (NC) dienes, trienes, and LC-PUFA not included in the standard references were identified by retention times and elution orders previously reported in the literature (Alves and Bessa, Reference Alves and Bessa2009; Delmonte et al., Reference Delmonte, Fardin-Kia, Kramer, Mossoba, Sidisky, Tyburczy and Rader2012), and by FAME fractions obtained using silver-ion SPE cartridges (Supelco Discovery™, 750mg/6mL; Supelco Inc., Bellefonte, PA, USA) (Kramer et al., Reference Kramer, Hernandez, Cruz-Hernandez, Kraft and Dugan2008; Belaunzaran et al., Reference Belaunzaran, Bravo‐Lamas, Kramer, Morales and Aldai2017).
For quantitation purposes, chromatographic peak areas were corrected according to theoretical response factors (Bannon et al., Reference Bannon, Craske and Hilliker1985), and thereafter the amounts (milligram) were calculated according to the internal standard added. Fatty acid methyl esters and DMAs were expressed as mg/100 g of fresh meat or as percentage of total FAME quantified (%).
Data analysis
Statistical analysis was conducted using IBM SPSS (2016). A t-Student test was applied to compare the chemical composition, fat constituents (FAME, DMA) composition and deposition preference values in total, NL and PLs between animal groups (suckling and fattened foals). Deposition values of individual FAs in NL and/or PL fraction of horse muscle were calculated as follows:
 $$\log \left( {{\rm individual}\,{\rm FA}\,\%\,\,{\rm in}\,{\rm the}\,{\rm PL}\,{\rm fraction}\,/\,{\rm same}\,{\rm FA}\,\%\,\,{\rm the}\,{\rm NL}\,{\rm fraction}} \right)$$
Principal component (PC) analysis was conducted on main individual and groups of FAs to establish relationships among them. Sample distribution plots using the two-dimensional coordinate system defined by the two first PCs were used to study the variability in composition. Three significant figures were used to express the data. Significance was declared at P⩽0.05.
Results
Chemical composition of muscle
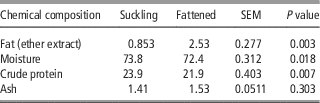
In terms of the chemical composition of the horse meat (Table 1), the fat content was significantly higher in concentrate-finished (2.53%) than in suckling foals (0.853%; P<0.01). Moisture (73.8% v. 72.4%; P<0.05) and protein (23.9% v. 21.9%; P<0.01) percentages were the highest in suckling foals, whereas no differences in total ash content (average value of 1.46%) were observed between studied groups.
Chemical composition (%) of Longissimus thoracis et lumborum muscle from suckling and fattened foals

Fatty acid and plasmalogen composition of muscle
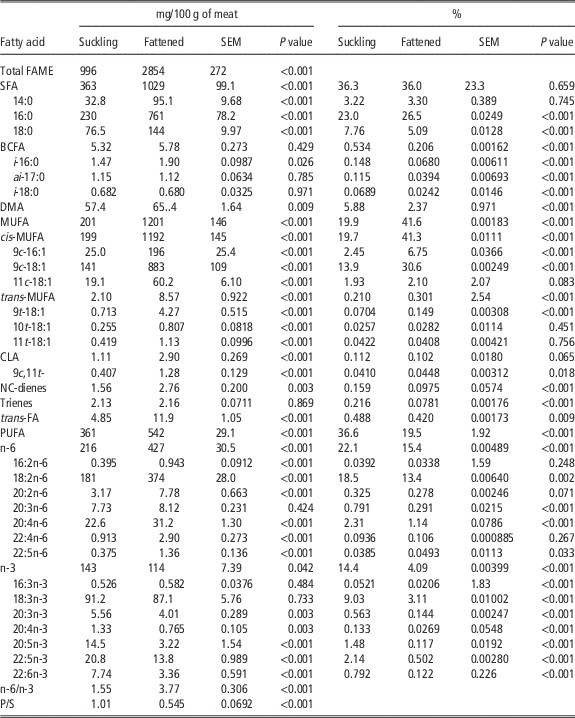
Total FA content and composition of LTL muscle from suckling and fattened foals are presented in Table 2 (mg/100 g of fresh meat and %). On the absolute basis, total FAME content was significantly higher in concentrate-fed (2854 mg/100 g of meat) than in suckling foals (996 mg/100 g of meat; P<0.001), and it was influenced by higher levels of saturated fatty acid (SFA; P<0.001), monounsaturated fatty acid (MUFA; P<0.001) and n-6 PUFA (P<0.001; Table 2), whereas the opposite was true for n-3 PUFA (P<0.05). The total branched-chain fatty acid (BCFA) content was not affected by age and feeding practices, although i-16:0 content was slightly higher in concentrate-fed foals (P<0.05). Similarly, DMA, CLA (P<0.001), NC-diene (P<0.01) and trans-FA (P<0.001) levels were higher in concentrate-fed foals, whereas no differences in trienes were found between studied groups.
Total fatty acid content (mg/100 g of fresh meat) and composition (mg/100 g of fresh meat and %) of Longissimus thoracis et lumborum muscle from suckling and fattened foals

FAME=fatty acid methyl esters; SFA=saturated fatty acids; BCFA=branched-chain fatty acids; i=iso; ai=anteiso; DMA=dimethylacetal; MUFA=monounsaturated fatty acids; NC=non-conjugated; PUFA=polyunsaturated fatty acids; P/S=polyunsaturated fatty acids/saturated fatty acids.
trans-FA: summatory of all fatty acids with at least one double bond in trans configuration except CLA isomers.
Looking at the muscle FA profile data on the percentage basis, SFA were not affected by age and feeding (average value of 36.1%), although differences were significant for some individual SFA; the percentage of palmitic acid (16:0) was higher, whereas stearic acid (18:0) was lower in fattened compared with suckling foals (P<0.001; Table 2). The content of BCFA was significantly higher in suckling (0.534%) than in fattened foals (0.206%; P<0.001). Likewise, the total content of DMA was significantly higher in suckling (5.88%) compared with fattened foals (2.37%; P<0.001). When expressed as percentages of total quantified DMA in horse muscle, the saturated DMA represented 76.9% of the total, with 16:0 (50.6%) and 18:0 (23.0%) the most predominated isomers. Monounsaturated represented about 17.4%, 3.47% were BCFA and only 2.15% were PUFA. The percentage of MUFA were significantly higher in concentrate-fed (41.6%) than in suckling foals (19.9%; P<0.001), and this was influenced by both the major cis- (9c-16:1 and 9c-18:1) and trans-MUFA (9t-18:1; P<0.001; Table 2). No differences were found for the total CLA content between studied groups (average value of 0.107%); however, the percentage of NC-dienes (11t,15c-, 9c,15c-, and 12c,15c-18:2) related to LNA metabolites, and trans-FA were significantly higher in suckling compared with intensively fattened foals (P<0.01). Similarly, the PUFA content was higher in samples from suckling (36.6%) than concentrate-fed foals (19.5%; P<0.001; Table 2), and it was attributable to all n-3 (P<0.001) and most n-6 PUFA (P<0.01), except 22:5n-6 that was higher in fattened foals. A more favorable PUFA/SFA ratio was obtained in meat from suckling foals (P<0.001), whereas the n-6/n-3 ratio was higher in fattened foals (P<0.001).
Neutral and polar lipid composition of muscle
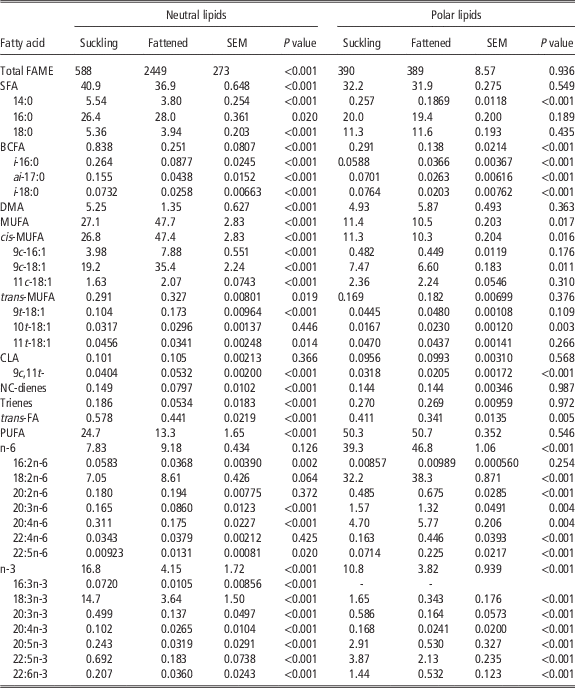
Total FAME content (mg/100 g of fresh meat) and profile (percentages) of NL and PL fractions are shown in Table 3. The total FAME content in the NL fraction was significantly higher (2449 mg/100 g of meat) in fattened compared with suckling foals (588 mg/100 g of meat; P<0.001), which was mainly influenced by the increased content of oleic acid (9c-18:1; +758 mg/100 g of meat), 16:0 (+532 mg/100 g) and palmitoleic acid (9c-16:1; +172 mg/100 g). In fattened foals, the overall FA composition of the NL fraction (Table 3) was fairly similar to that of the total lipids (Table 2), since this fraction represented 86.3% of total lipids. In contrast, the PL fraction remained fairly constant with an average muscle weight of 0.390% (Table 3; P>0.05). Overall, the PL represented a higher percentage of the total lipids in suckling (39.9%) compared with fattened foals (13.7%). The main FA constituents (representing >5%) of the NL fraction were 16:0 (average value of 27.2%), 9c-18:1 (average value of 26.8%), LNA (average value of 9.52%) and LA (average value of 7.78%), which together represented an average of 71.2% of the total FA. In the PL fraction, LA was the major FA (average value of 35.1%), followed by 16:0 (average value of 19.7%), 18:0 (average value of 11.4%) and 9c-18:1 (average value of 7.06%), which together represented an average of 73.3% of the total.
Total fatty acid content (mg/100 g of fresh meat) and composition (%) of neutral and polar lipid fractions of Longissimus thoracis et lumborum muscle from suckling and fattened foals

FAME=fatty acid methyl esters; SFA=saturated fatty acids; BCFA=branched-chain fatty acids; i=iso; ai=anteiso; DMA=dimethylacetal; MUFA=monounsaturated fatty acids; NC=non-conjugated; PUFA=polyunsaturated fatty acids; P/S=polyunsaturated fatty acids/saturated fatty acids.
trans-FA: summatory of all fatty acids with at least one double bond in trans configuration except CLA isomers.
In the NL fraction, most of the FA were significantly higher in suckling than fattened foals except for 16:0 (P<0.05), all the cis- (P<0.001) and several trans-MUFA (P<0.05), rumenic acid (RA; 9c,11t-18:2, P<0.001) and 22:5n-6 (P<0.05), whereas most of the remaining FA were greater in fattened foals. In the PL fraction, on the other hand, few differences were observed between studied groups. Some FA were significantly higher in suckling (BCFA, P<0.001; cis-MUFA, P<0.05; RA, P<0.001; trans-FA, P<0.001; 20:3n-6, P<0.01 and all n-3 PUFA, P<0.001), whereas others such as 10t-18:1 (P<0.01) and the main n-6 PUFA (P<0.01) were significantly higher in fattened foals.
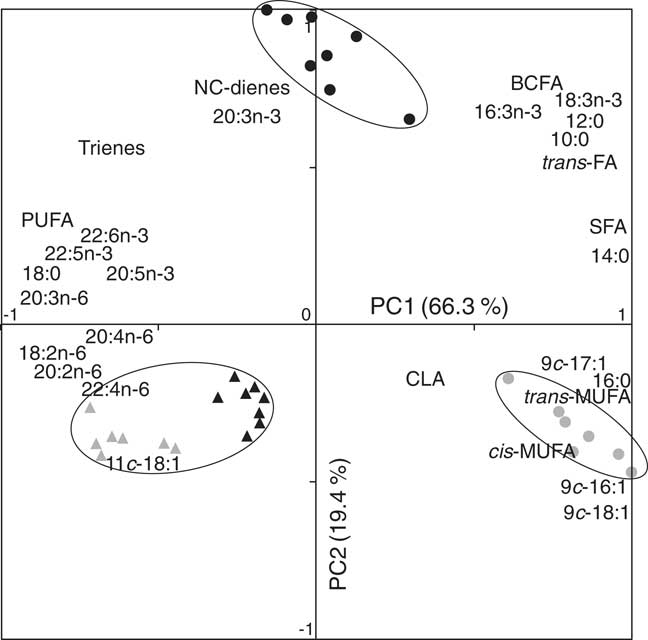
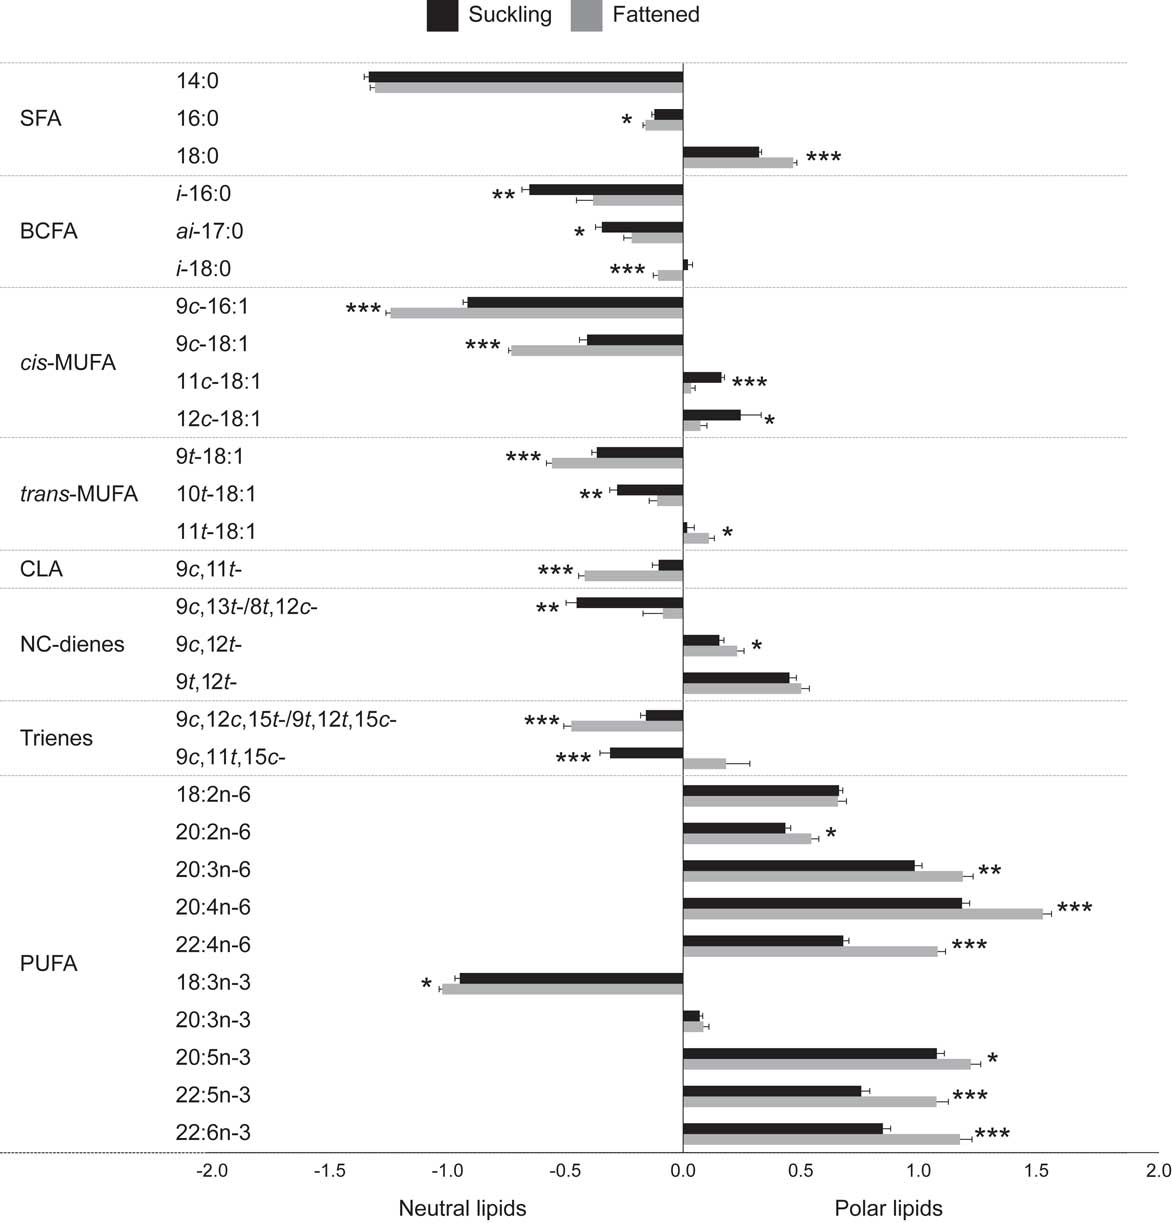
The major FA present in the NL fraction of suckling and fattened foals were clearly differentiated, whereas the major FA in the PL fraction from both groups of animals showed a very close relationship (Figure 1). The NL fraction of suckling foals showed positive relationships with short-chain SFA (<15C), BCFA, unresolved NC-dienes (9c,13t-, 8t,12c) and trienes (9c,12c,15t-, 9t,12t,15c-), trans-FA and some individual n-3 PUFA (16:3 and 18:3; Figure 1), whereas the NL fraction of fattened foals was related to 16:0, the main cis- and trans-MUFA and RA that showed negative deposition preference values (Figure 2). Deposition of i-18:0 and 11t-18:1 was about equally distributed between the NL and PL fractions (deposition preference close to zero). There was no clear trend observed for the 9c,11t,15c-18:3 isomer, which in suckling foals deposited primarily in the NL fraction and in fattened foals deposited mainly in the PL fraction (Figure 2). Meanwhile, positive deposition preference values were observed for 18:0, 18:1 (11c-, 12c-, 15c-), some NC-dienes (9c,12t-, 9t,12c-18:2), 18:2n-6 and all LC-PUFA (n-6 and n-3), indicative of a favored deposition of them in the PL fraction (Figure 2). Even though deposition preferences were affected by the age and feeding of foals, it did not appear to modify the preferential pattern of incorporation into one or the other fraction. Overall, the higher and positive deposition preference values of LC-PUFA in the PL fraction of fattened foals could be due to the low content of these LC-PUFAs in NL fraction of concentrate-fed foals, whereas it was relatively constant in PL fraction of both groups of animals (Figure 2).
Loading variables and horse muscle neutral (suckling ●, fattened  ) and polar (suckling ▲, fattened
 ) lipids distribution on the two-dimensional coordinate system defined by principal component (PC) 1 and PC2. NC=non-conjugated; BCFA=branched-chain fatty acids; FA=fatty acids; PUFA=polyunsaturated fatty acids; SFA=saturated fatty acids; MUFA=monounsaturated fatty acids; c=cis.

Deposition preference of main fatty acids into neutral (negative values) or polar lipid (positive values) fraction of Longissimus thoracis et lumborum muscle from suckling and fattened foals. Deposition preferences were calculated according to the logarithm of (individual fatty acid in percentage basis in the polar lipid fraction divided by the same fatty acid in percentage basis in the neutral lipid fraction). SFA=saturated fatty acids; BCFA=branched-chain fatty acids; MUFA=monounsaturated fatty acids; NC=non-conjugated; PUFA=polyunsaturated fatty acids; i=iso; ai=anteiso; c=cis; t=trans. Error bars indicate the standard error of the mean for each group. *P<0.05, **P<0.01, ***P<0.001.

Discussion
As observed by others, differences in horse IM fat content were most likely related to age (Sarriés and Beriain, Reference Sarriés and Beriain2005; Franco et al., Reference Franco, Rodríguez, Purriños, Crecente, Bermúdez and Lorenzo2011; Domínguez et al., Reference Domínguez, Crecente, Borrajo, Agregán and Lorenzo2015) and/or associated feeding (Lorenzo et al., Reference Lorenzo, Crecente, Franco, Sarriés and Gómez2010; Franco et al., Reference Franco, Crecente, Vázquez, Gómez and Lorenzo2013; Lorenzo et al., Reference Lorenzo, Sarriés, Tateo, Polidori, Franco and Lanza2014). Our results confirmed the higher moisture and protein content reported in extensively reared foals (Lorenzo et al., Reference Lorenzo, Sarriés, Tateo, Polidori, Franco and Lanza2014). The ash content was also in agreement with the values reported in the literature, which ranged from 0.98% in 6- to 10-year-old horses (Badiani et al., Reference Badiani, Nanni, Gatta, Tolomelli and Manfredini1997) to 4.03% in foals slaughtered at 16 months of age (Sarriés and Beriain, Reference Sarriés and Beriain2005), and 1.11% to 1.33% in 8 to 12 months of age donkey foals (Polidori et al., Reference Polidori, Pucciarelli, Ariani, Polzonetti and Vincenzetti2015).
In terms of lipid constituents, data obtained from a survey of horse loin steaks (n=82) collected in the northern Spain showed that the highest MUFA, and the lowest DMA, BCFA and PUFA content (%) were found in samples with higher content of IM fat (Belaunzaran et al., Reference Belaunzaran, Lavín, Barron, Mantecón, Kramer and Aldai2017). Higher values of 16:0 and lower values of 18:0 were reported in tissues of concentrate-fed horses (Lorenzo et al., Reference Lorenzo, Crecente, Franco, Sarriés and Gómez2010) and higher MUFA values (50.2%) were shown to be associated with concentrate-based diets (He et al., Reference He, Ishikawa and Hidari2005). We did not conduct gene expression of stearoyl-CoA desaturase, but the higher percentages of all cis-9 MUFAs (14:1, 16:1, 17:1, 18:1 and 20:1; P<0.001), found in the fattened foals (Table 2) suggest a higher Δ9-desaturase activity in this group of animals, also reported by others (Daniel et al., Reference Daniel, Wynn, Salter and Buttery2004). The present study provides the first complete DMA composition of horse meat. Although acid-catalyzed transesterification procedures were used to methylate horse lipids (Sarriés et al., Reference Sarriés, Murray, Troy and Beriain2006; Lorenzo et al., Reference Lorenzo, Crecente, Franco, Sarriés and Gómez2010), the expected DMA content was not reported. Very few studies report the plasmalogen content and composition in any meat (Kraft et al., Reference Kraft, Kramer, Schoene, Chambers and Jahreis2008; Aldai et al., Reference Aldai, Dugan, Kramer, Martínez, López-Campos, Mantecón and Osoro2011) even though there is increased interest of these compounds considering their important biological activities and their implication in the development of several human diseases (Nagan and Zoeller, Reference Nagan and Zoeller2001). Ether lipids represented an average value of 4.401% of the total horse lipids and the plasmalogen composition could be valuable information from its nutritional point of view. We found that the DMA content was relatively independent of the IM fat level between the two groups at ~0.0611% by weight in horse meat. This meant that the relative proportion of DMA in the total fat of the foals would be diluted with the higher levels of IM fat level in fattened foals. The alkenyl chain composition was reported to consist mainly of saturated and monounsaturated moieties with 16:0, 18:0 and 9c-18:1 predominating (Horrocks, Reference Horrocks1972). However, in the current study we found small amounts of polyunsaturated alkenyl moieties of 18:2 and 18:3 in horse plasmalogens that will be reported separately.
The formation and deposition of BCFA, CLA isomers and other biohydrogenation intermediates in horses is low largely due to minimal microbial metabolism of amino acids and PUFA in the small intestine. Microbial metabolites formed in the hindgut are generally poorly absorbed (Clauss et al., Reference Clauss, Grum and Hatt2009). Nevertheless, we did find several metabolites which are believed to be linked to LNA biohydrogenation. These differences could be influenced by the higher availability of LNA and its metabolites in grass-fed mares’ milk (Malacarne et al., Reference Malacarne, Martuzzi, Summer and Mariani2002) than in LA-rich (45.8%) concentrate-fed foals. On the other hand, the higher accumulation of RA in fattened foals was potentially related to the active Δ9-desaturase activity in IM fat, which converted vaccenic acid (11t-18:1) to RA, and is responsible for the formation of other 9c-containing FA in animal tissues (Vahmani et al., Reference Vahmani, Rolland, Gzyl and Dugan2016). Deposition of n-3 PUFAs in horse tissues was previously found to be significant under grazing conditions (Lorenzo et al., Reference Lorenzo, Crecente, Franco, Sarriés and Gómez2010), whereas the higher 22:5n-6 percentage observed in fattened foals could be associated with a compensatory accumulation of this FA due to a reduction of 22:6n-3 in this group of animals with low n-3 PUFA in their diet (Galli et al., Reference Galli, Agradi and Paoletti1974).
Regarding lipid fractions, present results agree with the general knowledge that fat accumulation occurs within the NL fraction, whereas the PL content stays relatively constant (De Smet et al., Reference De Smet, Raes and Demeyer2004; Figure 1). Furthermore, the FA composition of the NL fraction will be largely influenced by the diet, whereas the FA composition of the PL will be less affected. Knowledge of the FA composition of both horse lipid fractions is helpful to assess the nutritional value of the meat product and how it will impact its shelf-life. The higher content of 18:0 found in PL fraction was consistent with the high content also found by others in horse IM fat compared with subcutaneous (SC) adipose tissue that consists primarily of triacylglycerols and is low in LC-PUFA (Sarriés et al., Reference Sarriés, Murray, Troy and Beriain2006; Belaunzaran et al., Reference Belaunzaran, Lavín, Barron, Mantecón, Kramer and Aldai2017). Differences in DMA content between suckling and fattened foals were only observed in the NL fraction (Table 3). Neutral plasmalogens have been found in small amounts in mammalian tissues and in high amounts in some marine species (Hayashi et al., Reference Hayashi, Takagi and Kitagawa1983). Interestingly, the DMA content located in the NL fraction of suckling foals was higher than values observed in mammalian tissues (Horrocks, Reference Horrocks1972).
Most of the MUFA were preferentially deposited in the NL fraction, except for some minor cis-18:1 isomers (i.e. 11c-, 12c- and 15c-) that were mainly found in the PL fraction. It is of interest to note that Jerónimo et al. (Reference Jerónimo, Alves, Alfaia, Prates, Santos‐Silva and Bessa2011) also showed a favored esterification of these particular isomers in the PL fraction of sheep muscle fat, and Emken et al. (Reference Emken, Dutton, Rohwedder, Rakoff, Adlof, Gulley and Canary1980) showed that human plasma lipids have a selective preference to incorporate 12c-18:1 compared with 9c-18:1. The function of the cis-18:1 isomers in the PL fraction remains unclear. However, contrary to the general principle of higher levels of PUFA found in PL compared with NL, we found that hexadecatrienoic acid (16:3n-3) was only detected in the NL fraction. The reason could be that 16:3n-3 originates from dietary galactolipids that is transferred from grass-fed mares’ milk to the suckling foals. Galactolipids are the main components of chloroplasts and thylakoid membranes of botanical species (Siebertz et al., Reference Siebertz, Heinz, Linscheid, Joyard and Douce1979) and 16:3n-3 is present in high proportion at the sn-2 position of monogalactosyldiacylglycerol (Amara et al., Reference Amara, Barouh, Lecomte, Lafont, Robert, Villeneuve, De Caro and Carrière2010). Interestingly, the LNA content was found to be higher in NL compared with PL fraction in agreement with the higher content found in SC adipose tissue than in the IM fat of horse (Table 3) (He et al., Reference He, Ishikawa and Hidari2005; Sarriés et al., Reference Sarriés, Murray, Troy and Beriain2006; Belaunzaran et al., Reference Belaunzaran, Lavín, Barron, Mantecón, Kramer and Aldai2017). By contrast, LNA content in the PL fraction was lower due to the active conversion of LNA to LC n-3 PUFAs as membrane bound phospholipids reviewed by Pugh and Kates (Reference Pugh and Kates1979), which was also observed in ruminant species (Wood et al., Reference Wood, Richardson, Nute, Fisher, Campo, Kasapidou, Sheard and Enser2003). The LC-PUFAs are known to be essential membrane components in the cell regulating fluidity and metabolic functions (Spector and Yorek, Reference Spector and Yorek1985). The higher affinity for desaturation and elongation of LNA over LA has been previously described by others (Emken et al. Reference Emken, Adlof, Rohwedden and Gulley1992).
Conclusions
To our knowledge, this is the first report detailing the FA composition and their preference in the NL and PL fractions of horse muscle. It also provided for the first time the content of plasmalogenic lipids in horse meat. There were significant effects related to the age and associated feeding practice of foals which affected the IM fat content and the FA composition of NL and PL fractions. Samples from suckling foals were the leanest, and provided the highest content of DMA, PUFA and n-3 PUFA both as percentage and as mg/100 g of fresh meat. By contrast, the meat from concentrate-finished foals had a higher IM fat level resulting in a greater accumulation of 16:0 and total MUFA in the NL fraction, whereas muscle PL fraction retained a similar FA composition between these two animal groups. This study provided evidence that LNA was preferentially deposited in the NL fraction, but LC n-3 PUFAs were incorporated into the PL fraction. On the other hand, LA was preferentially incorporated in the PL fraction. Even though the LA percentages were higher in both lipid fractions in fattened foals, the leaner meat from suckling foals presented higher proportion of PL and, thus, provided higher percentage of LA located mainly in this lipid fraction. LC-PUFA deposition occurred primarily in the PL fraction suggesting their biological role in cell membrane structures and eicosanoid formation. High-PUFA content of horse meat, LNA in NL and LC n-3 PUFAs in PL fraction, could represent an alternative product to ruminant meat, even though the n-3 content was not sufficiently high to receive a label as a source of n-3 FA. Further research will be needed to evaluate the influence of a higher content of PUFA on meat stability during storage and/or processing.
Acknowledgments
X. B. thanks the Department of Economic Development and Competitiveness of the Basque Government for his doctoral fellowship, and N. A. thanks the Spanish Ministry of Economy and Competitiveness and the University of the Basque Country (UPV/EHU) for her contract through the ‘Ramón y Cajal (RYC-2011-08593)’ program. Financial support was provided by the UPV/EHU (EHUA 13/29; ZALDITRANS Project) and the Basque Government (IT766-13). Collaboration and help provided by horse producers is very much appreciated.