Biomarkers, also called molecular fossils (Peters et al. Reference Peters, Walters and Moldowan2005a), are organic compounds containing a molecular structure very similar to that of their source organisms. Some important geological issues can be explained by their occurrence and mutual proportions; such as characterisation of sedimentary conditions, type of deposited organic matter (OM) and degree of thermal transformation of kerogen (Didyk et al. Reference Didyk, Simoneit, Brassel and Eglinton1978; Huang & Meinshein Reference Huang and Meinschein1979; Tissot & Welte Reference Tissot and Welte1984; Radke et al. Reference Radke, Welte and Wilsch1986; van Aarsen et al. Reference van Aarsen, Hessels, Abbink and de Leeuw1992; Simoneit Reference Simoneit1977; Otto & Simoneit Reference Otto and Simoneit2001; Killops & Killops Reference Killops and Killops2005; Peters et al. Reference Peters, Walters and Moldowan2005a). However, an original biomarker assemblage may be overprinted by secondary processes, such as interaction with hot hydrothermal fluids, weathering or biodegradation. Such secondary alterations may have an influence on biomarker parameters. Therefore, it is crucial to know how these alterations affect organic matter.
The Carboniferous rocks of the Midland Valley have been an important source of energy resources for over 200 years. Exploitation of coal and hydrocarbons has fuelled the industrial development of Scotland. These deposits are particularly related to the Mississippian (Lower Carboniferous) West Lothian Oil-Shale Formation, which is the biggest hydrocarbon reservoir in the estimated resources of the Midland Valley (Monaghan Reference Monaghan2014). This area is covered by the sedimentary rocks cut by numerous igneous intrusions. Two types of intrusions were distinguished: alkaline-dolerite (Carboniferous) and quartz-dolerite (Permian). George (Reference George1992) showed that the Permian quartz-dolerite dykes and sills had a much greater influence on the thermal maturity of organic matter in the sediments of Midland Valley than did the older alkaline-dolerite sills. He also indicated that the thermal maturity of organic matter varies depending on the distance from the igneous intrusions. This present study concerns the Mississippian organic carbon-rich shales with siderite concretions from the Midland Valley, known as the oil shales from Wardie, Scotland. Bojanowski et al. (Reference Bojanowski, Bagiński, Clarkson, Macdonald and Marynowski2012) revealed that the thermal maturity of organic matter from these rocks was not solely controlled by burial, but also by hydrothermal activity related to the igneous intrusions. The purpose of this present paper is: (1) to understand how precipitation of early diagenetic concretionary cements affected organic matter enclosed in concretions in comparison to the surrounding sediments; (2) to detect differences between the rocks influenced by hydrothermal fluids and biodegradation and those that did not undergo these alterations; and (3) to evaluate the influence of these processes on the thermal maturity of the organic matter in the Wardie shales. Recognition of the effects of these processes on biomarker parameters which are used as indicators of thermal maturity is very important, especially when rocks associated with heat source (i.e., igneous activity) are examined.
1. Geological setting
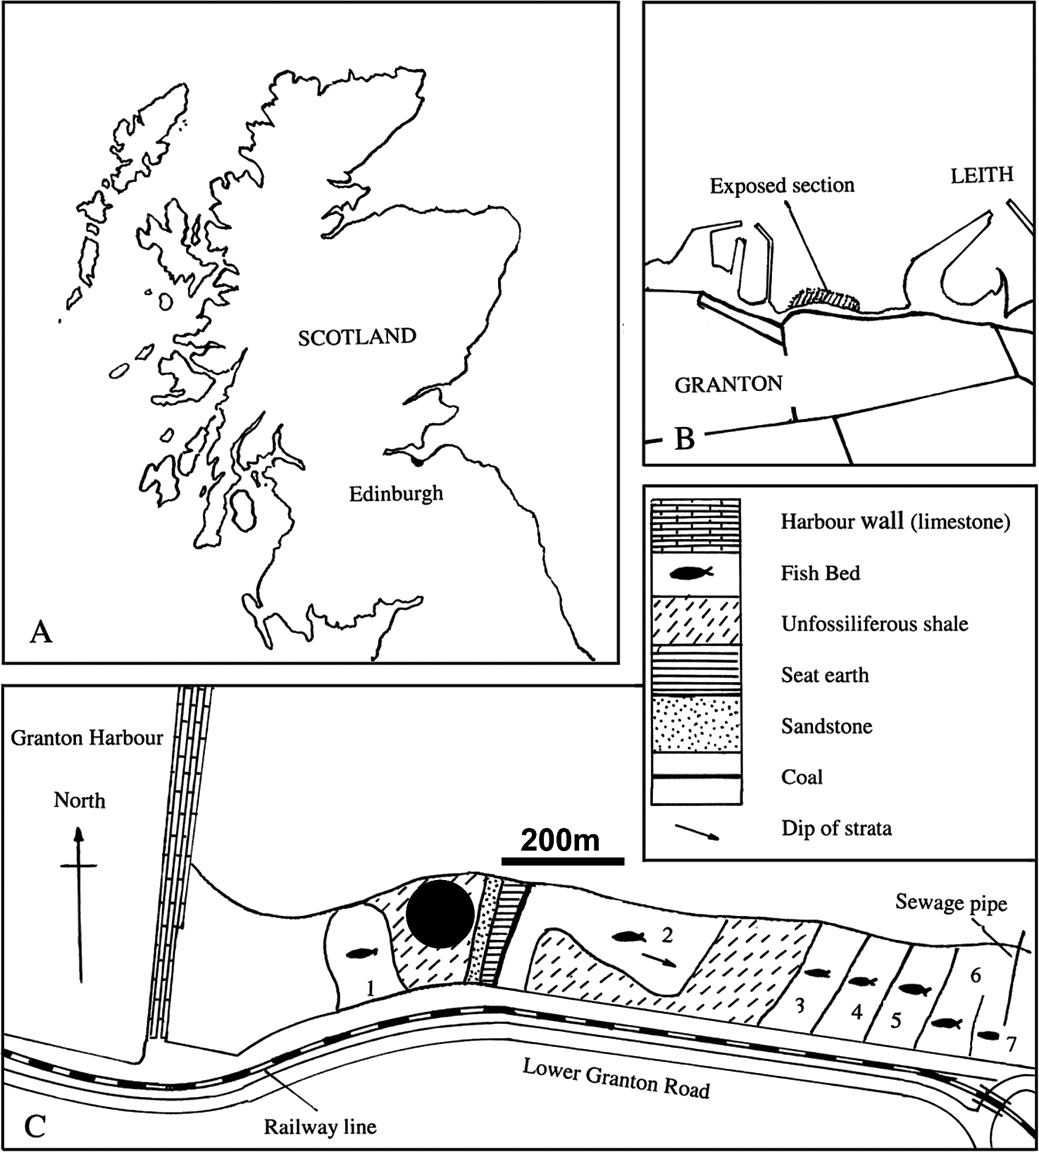
The Wardie oil shales were deposited in a brackish basin which was partially isolated from the open sea by elevations of volcanic origin (George Reference George1993). Both terrestrial and marine organic remains were deposited in the basin. The shale strata are usually bent at the boundary with the siderite concretions, wrapping subtly around them. This and other, also geochemical, properties suggests that concretions were formed at a shallow burial depth before significant mechanical compaction of the sediments (Bojanowski & Clarkson Reference Bojanowski and Clarkson2012). The concretions are discoidal or ellipsoidal in shape and reach 40 cm in diameter. They usually contain well preserved coprolites or fossil fish in their centres. The concretions were formed during early diagenesis in microenvironments of methanogenesis, developed in the diagenetic zone of sulphate reduction (Bojanowski & Clarkson Reference Bojanowski and Clarkson2012). The studied exposure of the Wardie oil shales is located in the Midland Valley, along the coast from Edinburgh, to the east of Granton (Fig. 1). This exposure is accessible only during low tide, and is about 65 m thick (Clarkson & McAdam Reference Clarkson, McAdam, Clarkson and McAdam1986).
(A) Location map. (B) Exact location of the Wardie shales. (C) Lithologies of the Wardie shales. Modified after Clarkson & McAdam (Reference Clarkson, McAdam, Clarkson and McAdam1986).

The Wardie shales belong to the Mississippian (Lower Carboniferous) West Lothian Oil-Shale Formation, Strathclyde Group. Sedimentary rocks of the West Lothian Oil-Shale Formation are intercalated with abundant syngenetic basaltic lava flows and tuffs. During the early Permian, they were deeply buried to the oil window (George Reference George1993) and cut by local intrusions, occurring as sills and dikes. The maximum length of the dikes is 300 km, whilst their width usually ranges between 3 m and 75 m. They extend along fractures with a predominantly E–W direction. The sills are up to 150 m thick. Those adjacent to the examined rocks do not exceed a thickness of 1 m (George Reference George1993).
2. Material and methods
Ten samples from the Wardie section were examined: three siderite concretions designated with the letter ‘c’ at the end of their symbols (A1c, B1c, Jc); and seven black organic-rich shales (A3, B2, E2, M, P, R, S). Two shale samples, A3 and B2, were taken from the layers directly surrounding the concretions A1c and B1c, respectively. Samples labelled from A to E were collected by ENKC and MJB in 2006 from the shales below the sandstone (Fig. 1). The rest of the samples are stored in the National Museums of Scotland in Edinburgh, so the exact location of their collection is not known; but they were most probably collected from the upper fish-bearing part above the coal seam, in a search for fish fossils. The samples were crushed in a jaw-crusher and then powdered in an agate mortar until the fraction 0.2 mm was reached. The powdered samples were placed in cellulose thimbles and Soxhlet extracted, with dichloromethane/methanol mixture (93:7) for 72 hours. The extracts were divided into aliphatic, aromatic and polar fractions using a glass Pasteur pipette filled with silica gel (activated at a temperature of 110°C for eight hours). The following eluents where used: n-pentane (aliphatic hydrocarbons); n-pentane/dichloromethane in a 7:3 v:v mixture (aromatic hydrocarbons); and dichloromethane/methanol in a v:v mixture (polar compounds). For details see Bastow et al. (Reference Bastow, van Aarssen and Lang2007).
Obtained fractions were examined using a gas chromatograph coupled with a mass spectrometer Clarus 500 Perkin Elmer (Faculty of Geology, University of Warsaw, Poland). A capillary column Elite–5MS (30 m×0.25 mm×0.25 μm) was used for the separation, on which 1 μl of given fraction was injected. Helium was the carrying gas. For the aliphatic fraction, a temperature programme was set in the chromatographic oven. The initial temperature was 40°C, which was maintained for one minute; then the temperature began to rise by 20°C/min, up to 120°C. Further temperature rise was at the rate of 3°C/min, until reaching an eventual temperature of 300°C, which was maintained for 30 minutes. For the aromatic fraction, the initial temperature was 60°C, which then began to rise at the rate of 8°C/min to 150°C; then at the rate of 4°C/min until reaching a final temperature of 320°C, which was maintained for 10 minutes. In both cases, the analysis was conducted by scanning the spectrum in the range of m/z 45–550.
The samples were analysed for total organic carbon (TOC) and total sulphur content using an Eltra CS-500 IR-elemental analyser with a TIC (total inorganic carbon) module (Faculty of Earth Sciences, Silesian University, Sosnowiec, Poland). TC (total carbon) and TIC contents were measured using an infrared cell detector on CO2 gas, due to sample combustion under an oxygen atmosphere for TC, and reaction with concentrated hydrochloric acid for TIC. TOC was calculated as the difference between TC and TIC. Calibration was achieved by means of the Eltra standards.
3. Results
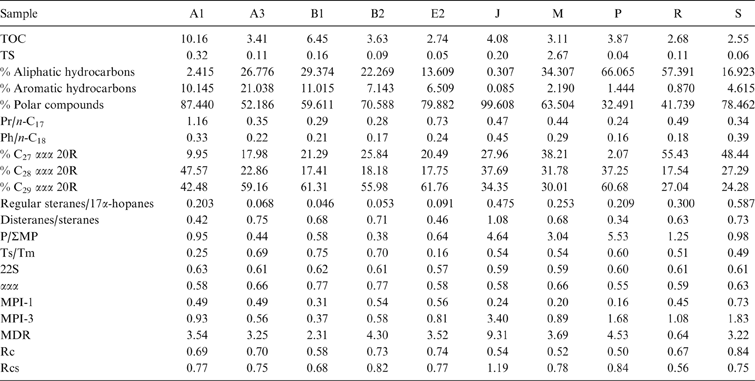
Total organic carbon (TOC) in the samples ranges from 2.55 % (sample S) to 10.16 % (sample A1c) (Table 1), showing higher values for concretions in comparison to the shales. Total sulphur (TS) is usually low, ranging from 0.043 % (sample P) to 0.322 % (sample A1c), except for the M sample (2.667 %) (Table 1). The content of extractable organic matter (EOM) ranges from 343 ppm (sample S) to 6114 ppm (sample A1c). The concentrations of aliphatic, aromatic and polar fractions range from 0.030 mg/g of sample (sample S) to 0.366 mg/g (sample P), from 0.005 mg/g (sample R) to 0.241 mg/g (sample A3) and from 0.138 mg/g (sample S) to 14.892 mg/g (sample Jc), respectively (Table 1). The high amount of polar fraction is associated with kerogen type III (resin).
Biomarkers analytical data for the samples from Wardie.

UCM (unresolved complex mixture) (Gough & Rowland Reference Gough and Rowland1990; Peters et al. Reference Peters, Walters and Moldowan2005a), although not prominent, is present in samples A1c, A3, B1c and B2 for the aromatic fraction and in samples Jc, M and S for the aliphatic fraction. In sample P, the elevated background is higher on the chromatograms of aromatic and aliphatic fractions.
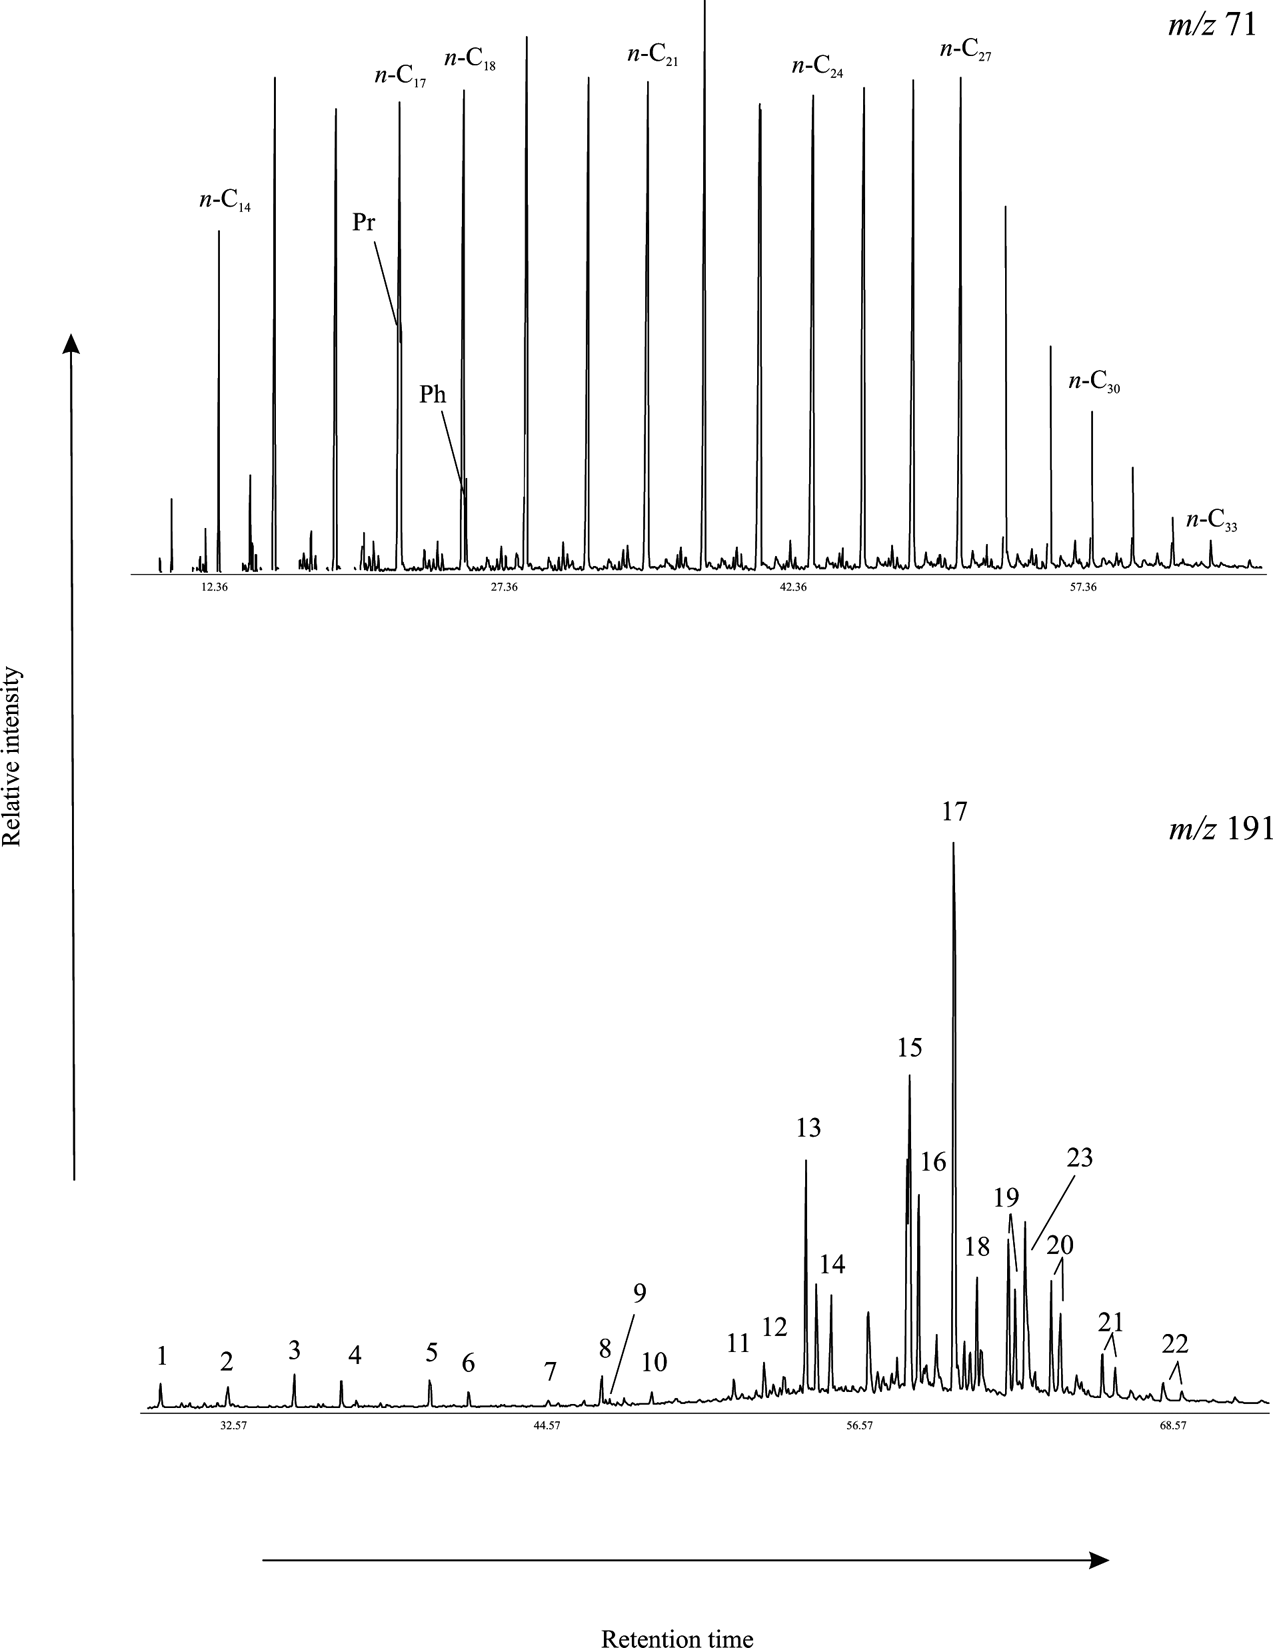
n-alkanes range from n-C13 to n-C34 (Fig. 2; Table 2). One maximum at n-C22/n-C23 can be observed in samples from the lower part of the section (A1c, A3, B1c, B2 and E2); whereas the remaining samples from the upper part (Jc, M, P, R and S) demonstrate bimodal distribution, with a dominance of n-C15 to n-C18 and n-C20 to n-C23. The carbon preference index (CPI) (Bray & Evans Reference Bray and Evans1961) in the samples ranges from 0.56 to 1.22 (Table 1).
Partial gas chromatograms for m/z 71, showing distribution of n-alkanes, and for m/z 191, showing distribution of terpenes (for sample B1c). Peak assignments are given in Table 2.

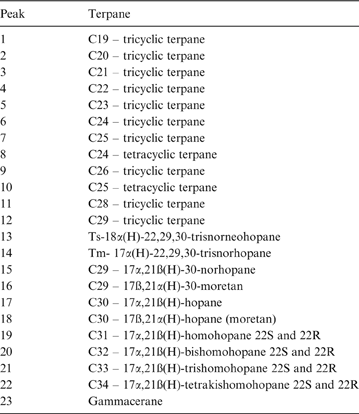
Peak assignments for terpane in Figure 2

The distribution of compounds from the terpene group (Fig. 3) demonstrates major variations amongst the samples. Pentacyclic triterpanes (hopanes) predominate in samples A3 and B2, whilst tricyclic and tetracyclic compounds are the most abundant in samples Jc and S. Gammacerane was identified in all the samples, but in different concentrations. The highest relative concentrations were noted in samples A3, B1c and B2. In the remaining samples, the values are substantially lower, but gammacerane is clearly identifiable based on its mass spectrum.
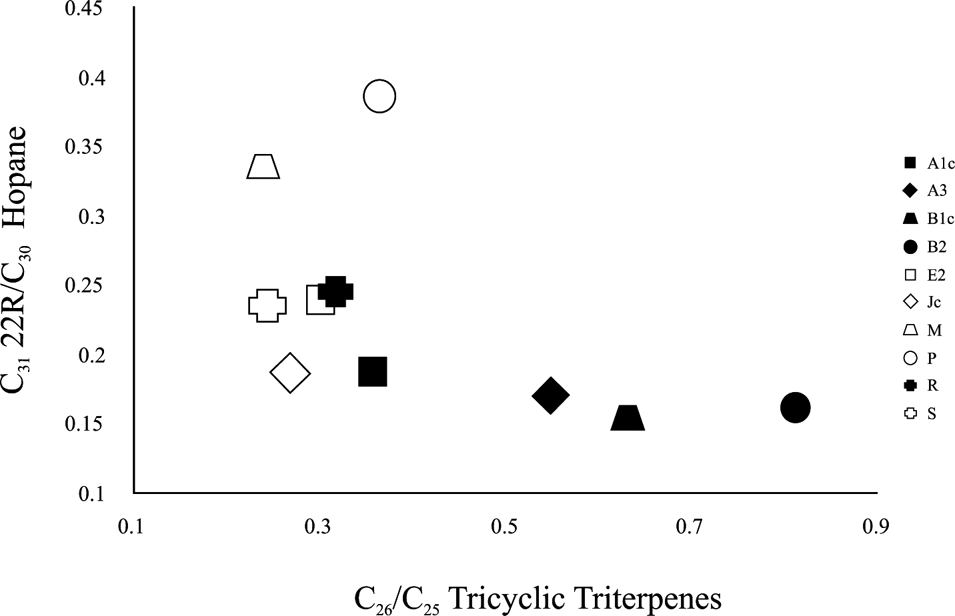
The C26/C25 tricyclic terpene vs. C31 22R/C30 hopane plot diagram. This ratio is useful as a supporting method to distinguish lacustrine from marine organic matter.

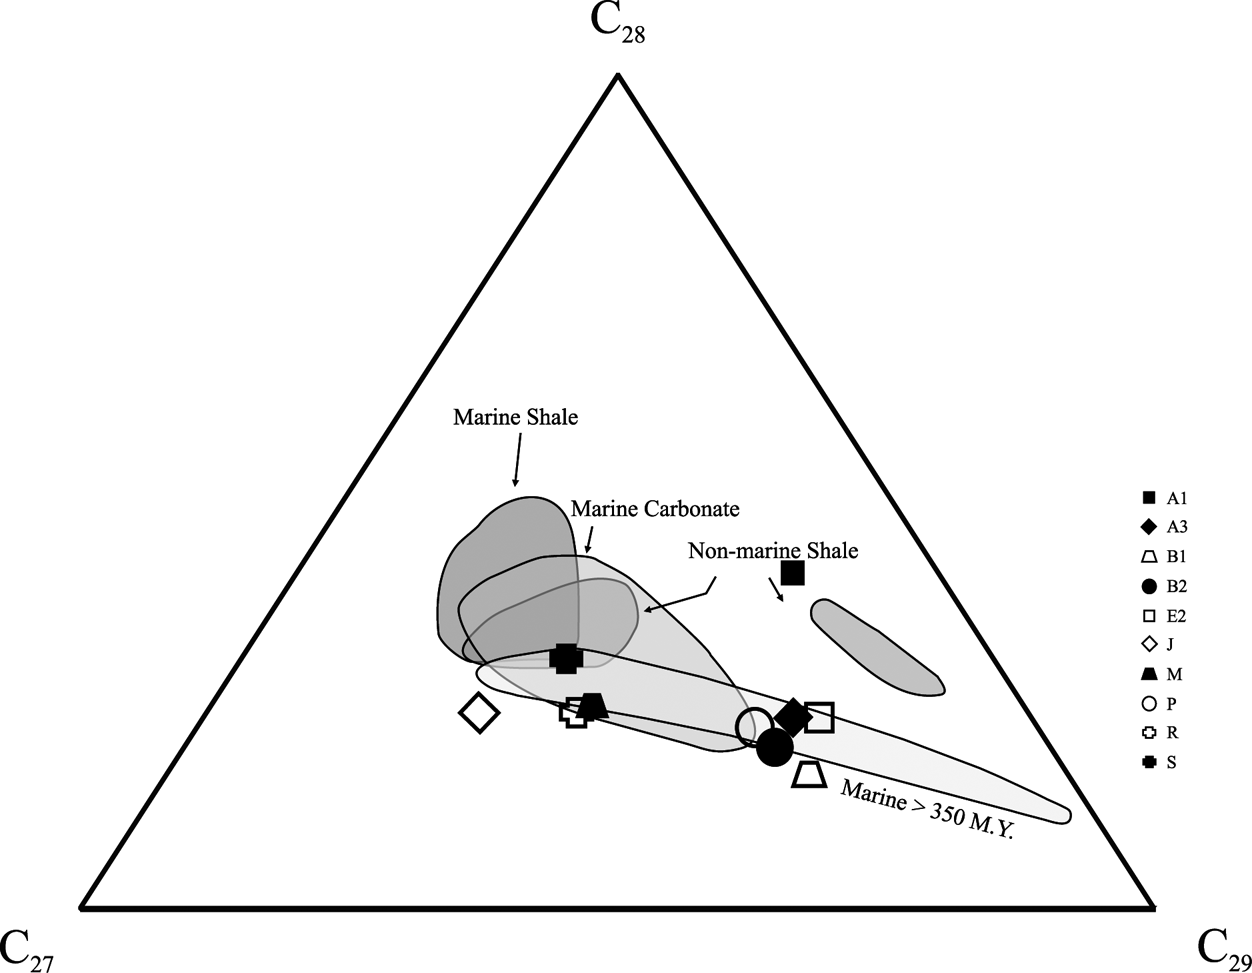
The distribution of steranes C27:C28:C29 ααα 20R is clearly variable (Table 1; Fig. 4). The relative concentration of C27 sterane is the smallest in sample P, and the highest in sample R. Sample B1c has the lowest amount of C28 sterane and the highest amount is present in sample A1c. Furthermore, the concentration of C29 sterane is the smallest in sample S and the highest in sample E2. The steranes/17α-hopanes ratio is in the range of 0.046 (sample B1c) to 0.587 (sample S) (Table 1).
Ternary diagram showing the relative abundances of the regular steranes C27, C28 and C29 (ααα 20S+20R and αββ 20S+20R), suggesting mixed source of organic matter.

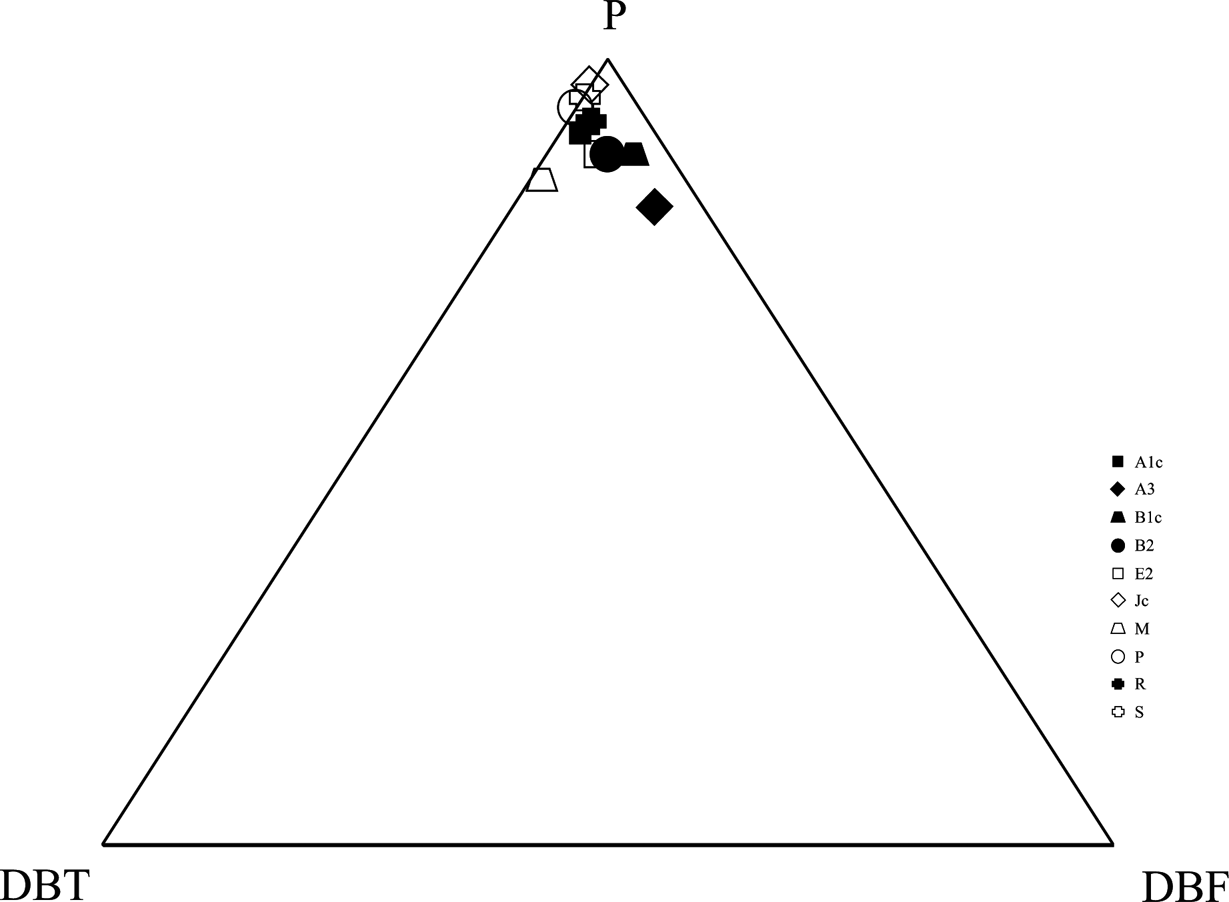
Major polycyclic aromatic hydrocarbons (PAH) identified in the Wardie sediments include: naphthalene; phenanthrene; pyrene; fluoranten; benzoanthracen; chrysene + triphenylene; and perylene. Phenanthrene and its methyl derivatives are present in all samples, showing a phenanthrene/total methylphenanthrenes (P/ΣMP) ratio in a range from 0.38 (sample B2) to 5.53 (sample P) (Table 1). Sulphur compounds such as dibenzothiophene (DBT) and its methyl derivatives, and oxygen compounds including dibenzofuran (DBF) and its methyl derivatives, were also detected in the studied material. Phenanthrene dominates amongst the compounds listed above (Fig. 5), ranging from 81.4 % (sample A3) to 96.9 % (sample Jc); whilst DBF and DBT vary from 0.02 % (sample Jc) to 14.54 % (sample A3) and from 3.06 % (sample Jc) to 14.63 % (sample M), respectively.
Ternary diagram showing the relative abundances of P (phenanthrene), DBF (dibenzofuran) and DBT (dibenzothiophene) in samples from Wardie (based on Radke et al. Reference Radke, Vriend and Ramanampisoa2000).

4. Discussion
4.1 Secondary processes
TOC and TS show a positive relationship (Table 1); only sample M does not fit this trend. The correlation coefficient (r2) between TOC and TS, excluding sample M, is 0.88. The highest TOC and TS values are observed for the concretions. The excess of TOC and TS in the concretions relative to the shales is caused, most probably, by the fact that in concretions, organic matter is more protected from oxidation and biodegradation (Wildman et al. Reference Wildman, Berner, Petsch, Bolton, Eckert, Mok and Evans2004). This is due to the early, pre-compaction growth of concretions close to the sediment–water interface in microenvironments, characterised by more anoxic and reducing conditions than in the surrounding sediments (see Bojanowski & Clarkson Reference Bojanowski and Clarkson2012). Organic matter in these microenvironments was metabolised by methanogenic microbes less effectively than in the surrounding sediments, where it was oxidised by sulphate; which confirms the presence of 3-methyl-hopanes in the examined material, which comes from the methanotrophic bacteria. This mechanism can explain why early diagenetic carbonate concretions contain more organic carbon than the host sediments, even though the detrital and organic material is diluted by abundant authigenic carbonates.
The first evidence confirming biodegradation is the occurrence of the elevated background in the chromatograms (called UCM, or hump), present in all samples except E2. In the aliphatic fraction, the initial biodegradation is associated with the removal of short-chain n-alkanes: n-C8–n-C12. Further biodegradation causes the almost total removal of n-alkanes. Short-chain n-alkanes (n-C12–n-C15) are better preserved in concretions (samples A1c and B1c) in comparison to the shales, which confirms more favourable conditions for the preservation of organic matter within the concretions.
Polycyclic aromatic hydrocarbons are also used for estimation of the degree of oxidation and the decomposition of organic matter, by both meteoric and hydrothermal waters. The parameter is based on the phenanthrene/total methylophenanthrenes (P/ΣMP) ratio. High P/ΣMP indicates the presence of oxidising conditions and their influence on organic matter (e.g., Sun Reference Sun1998; Bechtel et al. Reference Bechtel, Gratzer, Püttmann and Oszczepalski2001). The process of OM oxidation causes the addition of free oxygen to the methyl groups in MP, which leads, in the final stage, to the formation of benzoic acids. When the carboxyl group is detached, it is transformed into phenanthrene (Speczik & Püttmann Reference Speczik and Püttmann1987). The high values of the P/ΣMP ratio may imply OM oxidation. High values of this parameter were observed in samples Jc, M and P (with P having the highest value), suggesting that they probably underwent the strongest secondary oxidation processes (Table 1). This parameter does not exceed 1 in the remaining samples, and the lowest values were noted in sample B2.
Naphthalene present in the aromatic fraction is considered to have very little resistance to biodegradation, oxidation and/or water washing (Fabiańska Reference Fabiańska2007; Marynowski et al. Reference Marynowski, Kurkiewicz, Rakociński and Simoneit2011). It is present in almost all studied samples (except sample P). However, the concretions show stronger enrichment in naphthalene than the shales. Again, it suggests that organic matter in the concretions is less susceptible to biodegradation and oxidation processes, probably because it is sheltered from the fluids by abundant fine crystalline cements. These cements are early diagenetic and do not show any sign of secondary alteration (cf. Bojanowski et al. Reference Bojanowski, Barczuk and Wetzel2014), so they are not related to deep burial.
4.2 The origin of organic matter
The heterogeneous distributions of n-alkanes may suggest the occurrence of both marine and terrestrial organic matter types (e.g., Peters et al. Reference Peters, Walters and Moldowan2005b). Samples A1c, A3, B1c, B2 and E2, from the lower part of the section, show a stronger influence of terrestrial OM (a high amount of C21-C35 n-alkanes); whilst samples Jc, M, P, R and S, from the upper part of the section, are enriched in OM of marine origin (a low amount of C21–C35 n-alkanes). This is also confirmed by CPI values. The distribution of compounds from the terpene group may indicate either a different type of organic matter in some samples, or the influence of biodegradation on lipids. Pentacyclic triterpanes, to which hopanes belong, are less resistant to biodegradation processes than are tri- and tetracyclic compounds. Terpenes are commonly used for reconstruction of the sedimentary conditions. The high C26/C25 ratio and low C31 22R to C30 hopanes ratio indicate sedimentation in a lake environment (Peters et al. Reference Peters, Walters and Moldowan2005b; Fabiańska Reference Fabiańska2007). In several samples from the lower part of the section (A3, B1c and B2), the influence of sedimentation in a continental setting is shown by the high content of tricyclic triterpanes and the low content of hopanes (Fig. 3).
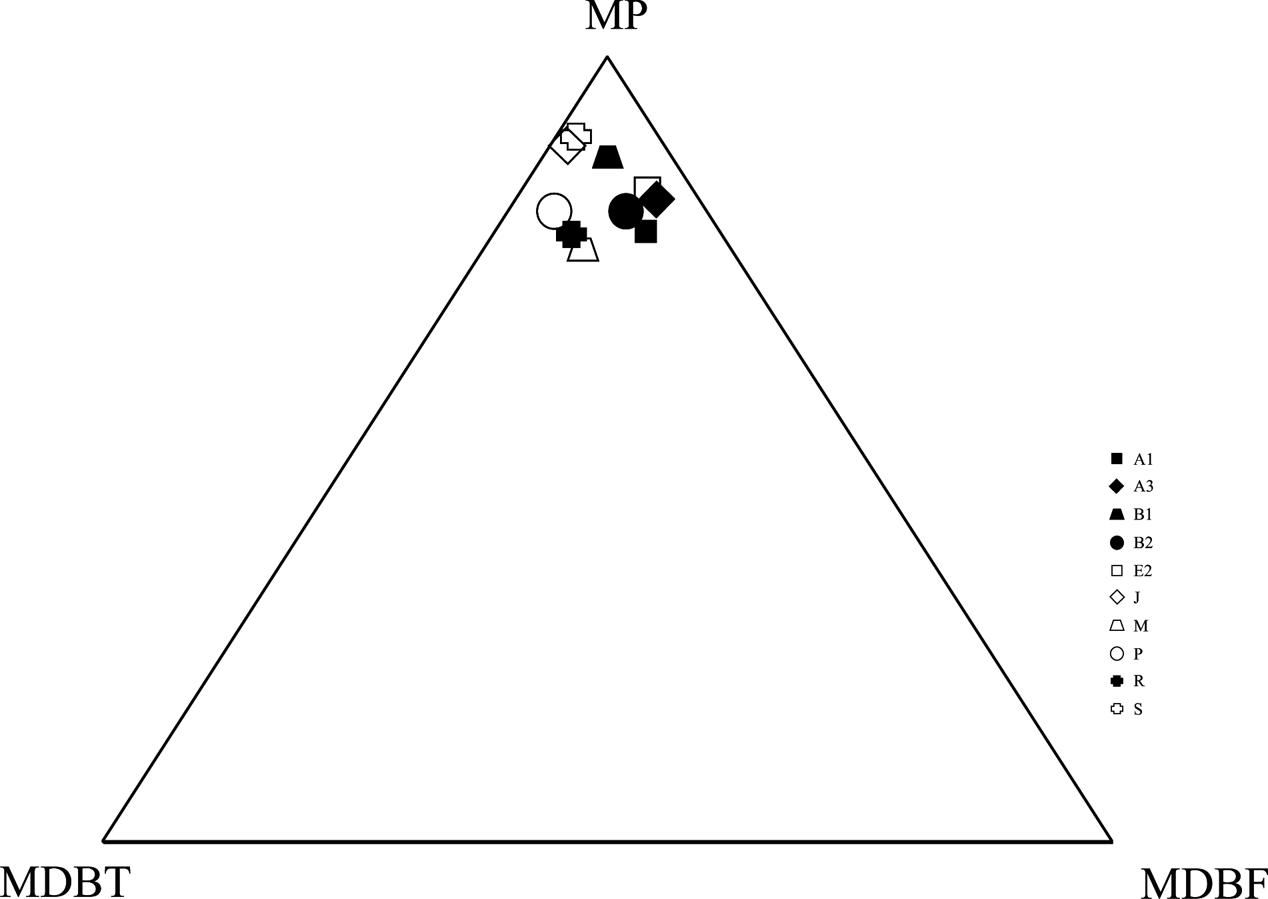
Compounds from the sterane group were used for kerogen source determination. These compounds derive from sterols building cell walls in eukaryotic organisms. The comparison of the relative content of the regular steranes (5α,14α,17α(H) 20S+20R and 5α,14β,17β(H) 20S+20R), cholestane (C27, origin of the cholesterol, found in animals, algae or plankton), ergostane (C28, origin of the ergosterol found in fungi) and stigmastan (C29, origin of the sitosterol, stigmasterol found in vascular plants and some algae) could provide information about the origin of organic matter in sediments (Fig. 4). Terrigenous OM predominates mainly in the rocks from the lower part of the Wardie section (samples A1c, A3, B1c, B2, E2 and P), which is revealed by the occurrence of a high relative concentration of stigmastan (C29), originating mainly from land plants (Moldowan et al. Reference Moldowan, Seifert and Gallegos1985; Peters et al. Reference Peters, Walters and Moldowan2005b). The influences of an open marine and coastal environment are indicated by the cholestane (C27) content in samples from the upper part of the section (Jc, M, R and S). The ratio of steranes/17α-hopanes reflects the relationship between eukaryotic (mostly algae and higher plants – steranes) and prokaryotic organisms (bacteria – hopanes). In all of the samples, the steranes/17α-hopanes ratio is <1 (Table 1). Values below 1 are typical for terrestrial OM, but also indicate generally well oxygenated bottom water conditions and intensive OM reworking (e.g., Marynowski et al. Reference Marynowski, Narkiewicz and Grelowski2000). In the case of the investigated, organic carbon-rich samples, low values of steranes/17α-hopanes ratio may confirm the terrestrial type of OM. A high concentration of phenanthrene (P), as compared to dibenzofuran (DBF) and dibenzothiphene (DBT), reflects the dominance of type III kerogen of terrigenous origin (Radke et al. Reference Radke, Vriend and Ramanampisoa2000; Fig. 5). A similar relationship is observed in the case of methyl-derivatives of phenantrene (MP), DBF and DBT (Fig. 6), but these parameters can be modified by the changes in thermal maturity and oxidation process (Speczik & Püttmann Reference Speczik and Püttmann1987; Bechtel et al. Reference Bechtel, Gratzer, Püttmann and Oszczepalski2001).
Ternary diagram showing the proportions of MP (methylphenanthrene), MDBT (methyldbenzothiophene) and MDBF (methyldibenzofuran) in samples from Wardie (based on Radke et al. Reference Radke, Vriend and Ramanampisoa2000).

The presence of gammacerane (Fig. 2) has major significance for palaeoenvironmental interpretations, because it implies stratification of the water column. It is considered that gammacerane most probably originates from the reduction of tetrahymanol (gammacerane-3β-ol) (ten Haven et al. Reference ten Haven, Rohmer, Rullkotter and Bisseret1989). This reaction occurs through the dehydration of tetrahymanol, enabling the production of gammacer-2-en, which subsequently undergoes hydrogenation (Sinninghe-Damsté et al. Reference Sinninghe-Damsté, Kenig, Koopmans, Köster, Schouten, Hayes and de Leeuw1995). Tetrahymanol substitutes for sterols in the cell walls of primitive organisms. The main source of this compound is probably ciliates, which occur on the boundary between oxic and anoxic water column zones (Sinninghe-Damsté et al. Reference Sinninghe-Damsté, Kenig, Koopmans, Köster, Schouten, Hayes and de Leeuw1995). In the examined sediments, this compound is present in different concentrations. The highest values were noted in samples A1c, A3, B1c and B2, from the lower part of the section. In the remaining rocks from the upper part of the section, the values are substantially lower, but gammacerane is clearly identifiable. This implies that the bottom water was anoxic. These redox conditions may have had an indirect impact on the generation of hydrocarbons, because they enhanced preservation of OM in sediments.
Precipitation of concretions at a very early diagenetic stage allowed for even better preservation of OM within them, by providing protection against post-depositional degradation. Therefore, the abundance and composition of OM enclosed in the concretions are more representative of the original conditions at the stage of deposition. The original TOC amount can be estimated by a minus-cement calculation, as the cements are early diagenetic and organic carbon is diluted by them. The concretions contain 70–86 % carbonates, with siderite cement being the dominant carbonate constituent (Bojanowski & Clarkson Reference Bojanowski and Clarkson2012). Assuming that the concretions are composed of siderite cements in 2/3, then the values of TOC should be multiplied by 3, which would give the original TOC as high as 30 %. This is a rough approximation, as microbial activity during diagenesis may have influenced (rather decreased than increased) the actual TOC to some extent.
4.3 Thermal maturity
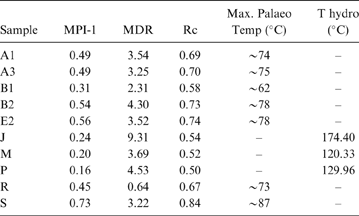
The parameter of the thermal transformation of OM, based on C31–C35 17α-hopanes 22S/ (22S+22R) (Farrimond et al. Reference Farrimond, Taylor and Telnæs1998), is in the range of 0.57–0.62 for all the samples (Table 1). These values point most probably to the oil window stage. Thermal transformation of OM was also estimated using certain indicators which could be calculated to theoretical vitrinite reflectance values. Based on these values, the maximal temperatures of the OM transformation were calculated. Two indicators were used: one based on the distribution of phenanthrene and methylphenanthrenes: MPI-1=1.5×(2-MP+3-MP)/(P+1-MP+9-MP); and the other on methyldibenzothiophenes: 4-/1-MDBT (Table 1). These indicators depend on the lithology, as they reflect the catalytic processes taking place in the surrounding mineral matrix (e.g., Szczerba & Rospondek Reference Szczerba and Rospondek2010).
The theoretical vitrinite reflectance values were calculated using the following formulae:
 $$Rc = 0.6\times MPI-1 + 0.4 (Radke \it {et al.} 1983)$$
;
 $$Rcs = 0.073\times MDR + 0.5 (Radke & Willsch 1994)$$
.
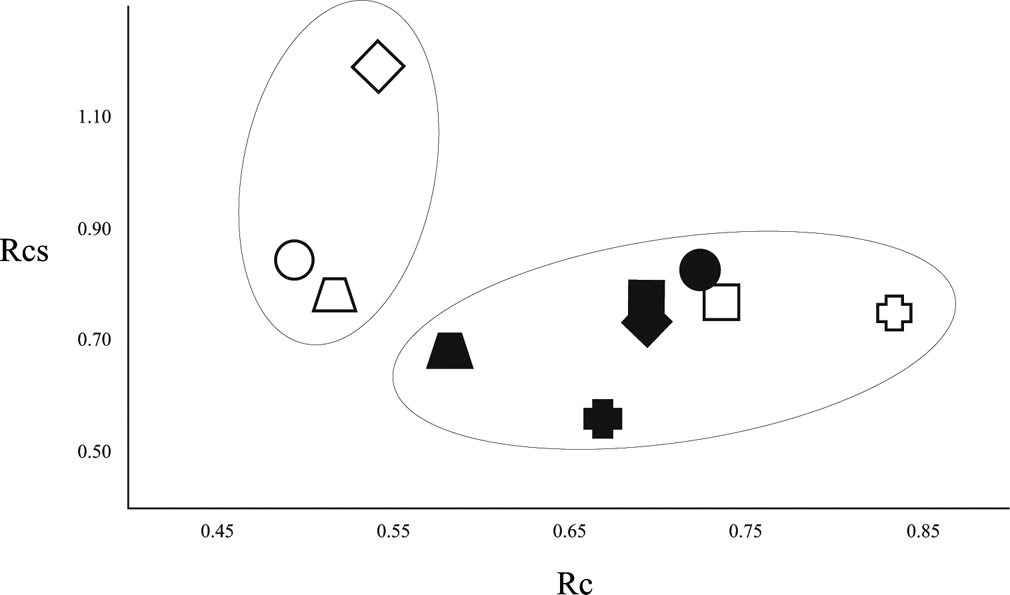
For kerogen type II/III and III, originating from carbonate rocks and oil shales within the oil window range, the best indicator of the organic matter transformation is the Rc parameter. This is based on the distribution of phenanthrene and its alkyl derivatives. Another maturity indicator is Rcs, which is based on the distribution of methyldibenzothiophenes. The concentrations of these compounds can be influenced by the sedimentary environment, the lithology of sediments and by secondary diagenetic processes (Radke et al. Reference Radke, Vriend and Ramanampisoa2000; Marynowski et al. Reference Marynowski, Kurkiewicz, Rakociński and Simoneit2011). The least thermally mature sample is B1c (calculated maximum palaeotemperature 62°C), whereas the most thermally mature is sample S (87°C) (Table 3). The calculated parameters (Rc vs. Rcs – similar values) correlate with each other only in some samples (A1c, A3, B1c, B2, E2, R and S; Tables 1 & 3; Fig. 7). As this group contains samples from both the lower and upper parts of the section, the lithology and sedimentary environments may not be responsible for the different values of these parameters (Rc and Rcs). These three samples (Jc, M and P) probably underwent secondary alteration, which modified the Rcs parameter. Sample R has low values for both Rc and Rcs, which indicates lowest thermal maturity. Samples Jc, M and P differ significantly from the rest, which is probably due to secondary processes obscuring the final results. They show the lowest Rc values, but very high Rcs values (Fig. 7).
Biomarker parameter values based on phenanthrene and dibenzothiophene

Rc vs. Rcs plot diagram, showing dependence of the calculated vitrinite reflectance.

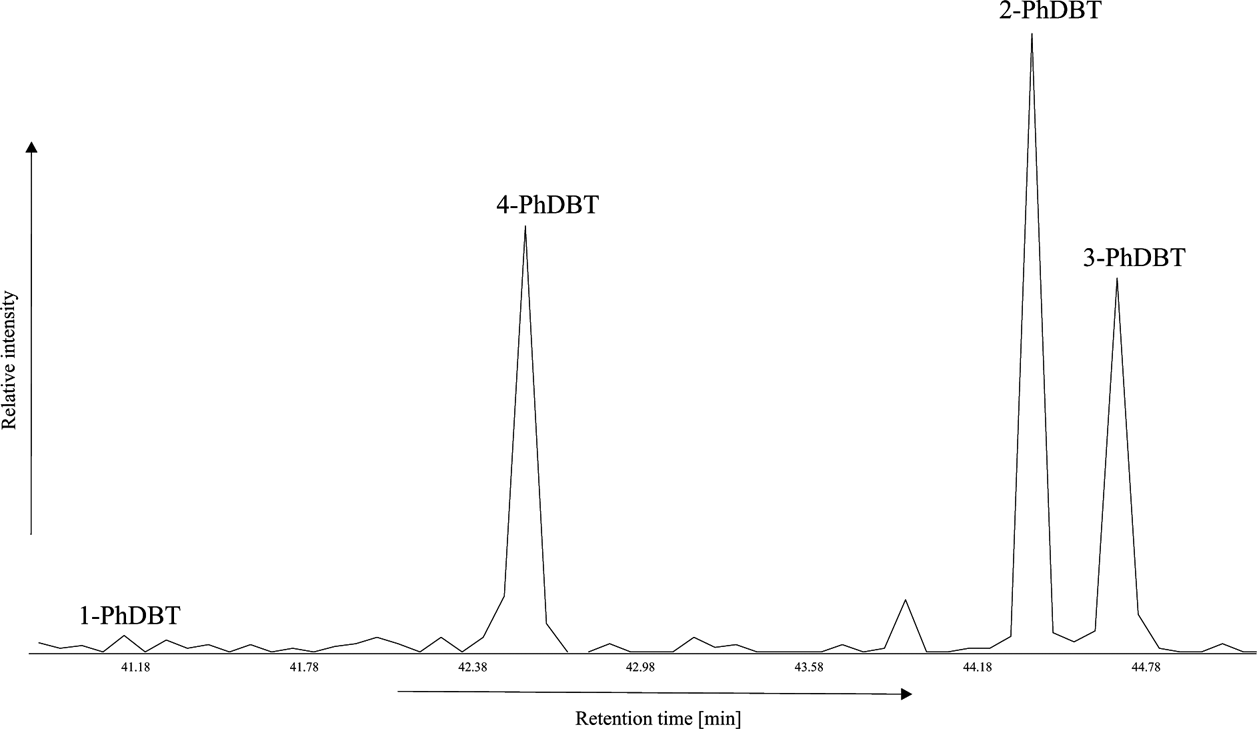
Phenylodibenzo[b,d]thiophenes, phenyl derivatives of dibenzothiophene (PhDBTs), occur in samples Jc, M and P (Fig. 8). They probably formed in the early stage of diagenesis, when the non-organic sulphur was incorporated to unsaturated hydrocarbons or carbohydrates, which then lead to the formation of a 1-PhDBT isomer (Marynowski et al. Reference Marynowski, Rospondek, Meyer zu Reckendorf and Simoneit2002). The alternative origin of these compounds is free radical phenylation of dibenzothiophene (Rospondek et al. Reference Rospondek, Marynowski and Góra2007). There are four known PhDBT isomers: 1-PhDBT, 2-PhDBT, 3-PhDBT and 4-PhDBT. In more thermally mature rocks, isomers 2- and 3-PhDBT dominate, whilst 1-PhDBT is present as traces, or does not occur at all (Marynowski et al. Reference Marynowski, Rospondek, Meyer zu Reckendorf and Simoneit2002; Rospondek et al. Reference Rospondek, Szczerba, Małek, Góra and Marynowski2008; Grafka et al. Reference Grafka, Marynowski and Simoneit2015).
Partial gas chromatogram m/z 260, showing distribution of PhDBT (phenyldibenzo[b,d]thiophenes) in sample M.

Phenyl derivatives of DBT are typical products of hydrothermal activity related to elevated temperature and oxidation potential (Marynowski et al. Reference Marynowski, Rospondek, Meyer zu Reckendorf and Simoneit2002; Rospondek et al. Reference Rospondek, Szczerba, Małek, Góra and Marynowski2008; Grafka et al. Reference Grafka, Marynowski and Simoneit2015). To define the thermal conditions associated with the interaction of hydrothermal fluids, the following algorithm for vitrinite reflectance calculation is used, as proposed by Barker & Pawlewicz (Reference Barker, Pawlewicz, Mukhopadhyay and Dow1994):
 $$T_{hydrothermal} = [ln Rc] + 1.19]/ 0.00782$$
; because short-lived hydrothermal heating is not as efficient as is thermal alteration of OM driven by long-lasting heating related to burial. Phenyl derivatives of DBT occur in samples J, M and P from the upper part of the section. Therefore, the maximum temperatures, to which the sediments were hydrothermally heated, were calculated for these samples using the algorithm proposed by Barker & Pawlewicz (Reference Barker, Pawlewicz, Mukhopadhyay and Dow1994; Table 2). The estimated hydrothermal temperatures are in the range of 120–174°C; whilst for the samples which were not affected by such fluids, the estimated temperatures are in the range of 62–87°C. The presence of the PhDBTs compounds also explains the abnormal Rcs values of these samples, as hydrothermal alteration was probably the cause of increased Rcs values. The presence of the PhDBT compounds in some samples was probably related to the magmatic intrusions which are common in this area, and which have induced circulation of hydrothermal fluids through the Wardie shales, as shown by Bojanowski et al. (Reference Bojanowski, Bagiński, Clarkson, Macdonald and Marynowski2012). The whole region of the Midland Valley is cut by a dense system of igneous intrusions, so it is likely that hydrothermal solutions could have migrated through the entire region and, in consequence, accelerated the generation of hydrocarbons. This process must have enhanced the generation of hydrocarbons and contributed to the economic importance of the West Lothian Oil-Shale Formation of the Midland Valley.
5. Conclusions
1) The concentration of organic matter is much higher in concretions than the surrounding shales, due to better preservation from weathering and from early diagenetic oxidation by the abundant siderite precipitation in anoxic conditions. Although fingerprints of secondary processes such as biodegradation and secondary oxidation were detected, organic matter enveloped within the concretions was better protected from these alterations than that found in the shales. This exceptional preservation of OM within the concretions allowed the estimation of the original TOC (up to 30 %) from the time of deposition, based on a minus-cement calculation performed on the concretions.
2) The analysis of n-alkanes, isoprenoids, terpenes and steranes, as well as the parameters using compounds from the aromatic fraction (P/DBT/DBF and MP/MDBT/MDBF), indicate type II/III kerogen in the investigated samples. The analysis of biomarkers revealed that the material is not uniform and that it should be divided into two groups, differentiated by origin and the composition of organic matter. Samples A1c, A3, B1c, B2 and E2, from the lower part of the section, contain mainly organic matter of terrestrial and algal origin; whilst samples Jc, M, P, M, R and S, from the upper part of the section, are composed of organic matter of mainly marine and bacterial affinity. This shows that the sedimentation in the basin varied from typically terrestrial to predominantly marine.
3) The occurrence of gammacerane was detected in the analysed rocks, suggesting water column stratification and anoxic conditions at the seafloor; which is confirmed by the previous examination of pyrite diameters and REE conducted by Bojanowski & Clarkson (Reference Bojanowski and Clarkson2012) on the Wardie concretions.
4) On the basis of the composition and content of biomarkers, the calculated vitrinite reflectance for the methylphenenthrene index is 0.5 %<Rc<0.84 %; whilst for the methyldibenzothiophene index it is 0.56 %<Rcs<0.88 %. This means that the Wardie oil shales experienced the oil window phase.
5) In three samples (Jc, M and P), the occurrence of phenyl-PACs provides evidence for alteration by hydrothermal fluids. Although these samples are characterised by the lowest Rc values, they experienced hydrothermal heating in the temperature range of 120–174°C. The rocks unaffected by hydrothermal fluids exhibit maximum temperatures of OM alteration in the range of 62–87°C.
6) The Midland Valley of Scotland is a basin which was formed by continental rifting and is associated with alkaline magmatism. Igneous intrusions are particularly widespread in the Carboniferous rocks. This work shows that the Wardie shales experienced hydrothermal alteration which was probably related to this magmatism. Therefore, magmatic intrusions are likely to have affected the thermal maturity of a considerable volume of sediments and the enhanced generation of hydrocarbons from the Carboniferous rocks.