


Introduction
A large number of meteorites have been found on the blue-ice area near such nunataks as the Yamato Mountains and the Allan Hills on the Antarctic ice sheet (e.g. Reference YanaiYanai 1979, Cassidy and others 1977).
The dynamic behaviour of the ice sheet around the blue-ice areas has been examined with a view to explaining the mechanism of meteorite accumulation (Nishio and others 1982, Reference Whillans and CassidyWhillans and Cassidy 1983, Azuma and others 1985). It was revealed that the flow vector inclined upwards relative to the surface, and the continuous evaporation of the blue ice was compensated for by the vertical movement.
Hence it was thought that those meteorites were once buried in the accumulation area, and had been transported by the ice flow, to reappear in the blue-ice area (Reference NagataNagata 1978). The meteorites accumulated at the surface over a long period, during the sublimation of the ice.
These studies indicate that relatively old ice is exposed in blue-ice areas, and various records of the climatic change as well as of the ice-sheet variation could be obtained by examining ice cores taken from ablation areas. It is generally to be expected that a relatively short core will preserve a longish history (Reference Whillans and CassidyWhillans and Cassidy 1983, Azuma and others 1985).
Core Description
A 101.4 m long core (ϕ = 0.12 m) was recovered from the southern part of the meteorite ice field (near the Yamato Mountains, Antarctica) by the 24th Japanese Antarctic Research Expedition. The drilling was carried out for about a week in December 1983.
The core was cut into 0.5 m long segments, and transported to the icebreaker Shirase. Air temperature was in the range of −10° to −20°C during the month taken by the oversnow traverse. It was considered that the core segments were exposed to the same range of temperatures or, at most, to temperatures only a few degrees higher, since the core boxes were covered by a specially designed sheet which effectively reflected solar radiation.
Samples were stored on the icebreaker at −20°C, until they were eventually used for various analyses in Japan. It was about 16 months after the recovery of the core that it was subjected both to total gas content and to density determination.
Stratigraphie record of a 100 m long ice core from the Meteorite Ice Field, Antarctica. T.G.C.: total gas content.

Temperature profile at the drilling site. The solid line shows a linear regression.

Many vertical cracks were found in the shallow part of the core, down to 7 m, whereas there were no cracks at greater depths. The cracks were almost parallel to the flow direction. There were occasional cloudy and clear bands, which were perpendicular to the main axis of the core. No clathrate hydrate inclusions were found after careful observation with a microscope.
For density measurements, specimens of about 0.1 kg were cut from the core at every 5 m, avoiding the cracks, and the cloudy and clear layers. The measurements were made using the hydrostatic method (Reference ButkovichButkovich 1953). Values were corrected for bubbles cut at the sample surfaces, using the procedure of Reference Nakawo and NaritaNakawo and Narita (1985). These density values are shown in Figure 1, after correction for the in-situ temperature (shown in Fig. 2), using Bader’s (1964) expression for the density-temperature relationship. Density increases gradually with depth, from about 888 kg m−3 at 3 m to about 913 kg m−3 at 101 m.
The density samples per se were used for measuring total gas content. Langway’s (1958) method was employed for the measurements; the samples were melted in kerosene, and the released air was introduced into a gas burette. Various corrections for the data were made acording to Higashi and others (1983). The results are plotted in Figure 1. The total gas content fluctuates considerably around a value of 90 × 10−6m3kg−1, showing a slight tendency to decrease with depth.
The full length of each 0.5 m section was used for analyzing δ18O, so that the seasonal variation in δ18O would be averaged and only the long-term trends would be apparent. These data are also shown in Figure 1. The value for δ18O varies with depth, in a range between −52 and −47‰.
Electrical conductivity of the ice was measured continuously from the top to the bottom of the core, by the method developed by Reference HammerHammer (1980). The measurements were made twice, and both sets of results agreed fairly well. The conductivity is shown in Figure 1. Eleven remarkable peaks can be seen in the figure. At three depths (31, 52, and 65 m, the 0.5 m long core sample was cut into segments of 50 mm. Electrical conductivity of the melt water from each segment was measured. The locations or depths of peaks found in this measurement matched those found for the electrical conductivity of solid ice. The height of the peaks in both measurements also showed a positive correlation, although the agreement was not as good.
Bubble pressure versus depth. Solid circles show the values obtained from the total gas content and densities, which were measured about 16 months after core recovery. The relaxation of the samples during the 16 months was taken into account, and the in-situ pressure was estimated as shown by open circles.

Bubble Pressure
Bubble pressure was calculated from the data on density, total gas content (Fig. 1), and in-situ temperature distribution (Fig. 2). The pressure, about 2 atmospheres near the surface, increases with depth almost linearly, and attains a value of about 10 atmospheres at the bottom of the core (Fig. 3). Bubble pressure thus estimated would be different from the in-situ pressure, since the core ice had relaxed (in association with the increase in volume of the bubbles) before the density measurements were carried out, 15–16 months after core recovery.
Reference Jones and JohariJones and Johari (1977) examined the shrinkage of air bubbles in natural and artificial ice under high hydrostatic pressure, and found that the strain-rate of bubbles was in agreement with the uniaxial compressive creep curves of Barnes and others (1971). Reference Shoji and LangwayShoji and Langway (1983), on the other hand, observed the volume-expansion process of air bubbles in a fresh ice core recovered at Dye 3, Greenland. They analysed the data on the basis of stress / strain-rate relationship, ε = (σ/A)n, in which ε refers to the rate of expansion of an air bubble, σ is the pressure difference between that of the internal bubbles and the atmosphere, and A and n are constants. They found that n = 2.7 and A = 7.8 × 10³ bar s1/n at a temperature of about −11.5°C. It was observed, however, that the rate of bubble expansion in polycrystalline ice was not uniform for all bubbles (personal communication from N. Azuma), presumably because it is dependent on the orientation of the host crystal in conjunction with that of the other surrounding crystals. Hence Shoji and Langway’s results may not be adequate for estimating the bulk expansion of the core, since they studied a limited number of bubbles. In addition, the volume expansion of an individual bubble is not uniform but anisotropic, e.g. the formation of “crack ring” or sub-boundary networks as seen in the photographs in Reference Shoji and LangwayShoji and Langway (1983) and Reference Nakawo and NaritaNarita and Nakawo (1985).
Reference NakawoNakawo (1986) examined the volume expansion of core samples by intermittent measurements of their densities. The density-time relation was analysed with an expression which was similar to Shoji and Langway’s: ε = Bσn, where δ is the pressure difference between gases in the internal bubbles and in the atmosphere. It should be noted, however, that in Nakawo’s expression ε is not the rate of expansion of a bubble, but that of an ice sample with air inclusions. He obtained the value of n = 3 and B = 10−13 bar−n s−1 for −10°C. These values are still uncertain, because there are many fine cracks in the samples. It is considered, however, that Nakawo’s result is the most appropriate one, among stress / strain-rate relationships available at present, for estimating the in-situ bubble pressure from pressure data which has been obtained some time after core recovery.
The pressure data thus obtained were corrected for in-situ values, which are shown in Figure 3. The correction was negligible near the surface, but became significant with increasing depth, as the pressure increased. The bubble pressure was appreciably higher than the overburden pressure (atmospheric pressure plus the cumulative weight of the ice) which had been estimated from the density data.
Vertical Movement of Ice
The emergence flow has been observed in the blue-ice areas of Antarctica (Reference NaruseNaruse 1978, Nishio and others 1982). When the ice which contains air bubbles at rather high pressure is lifted relative to the surface, the pressure of the bubbles decreases so as to equilibrate with the overburden pressure at the depth of the current location of the bubbles. This is the same process as volume relaxation of core samples which are exposed to relatively low atmospheric pressure after extraction from pressurized depths. The sudden drop in pressure could lead to crack formation, but this is not the case with upward movement where the pressure change is gradual. The deterioration of air hydrate and/or the formation of new bubbles may be another mechanism for volume relaxation. This process, however, can also be excluded in the case of the Yamato core, since no hydrate inclusions were found in it. It is considered, therefore, that the decrease in bubble pressure caused by vertical ice movement is to be attributed solely to expansion of the contained bubbles per se.
If a power law is applied to the volume expansion of the bubbles, the following expression can be given, assuming that the ice field is almost horizontal:
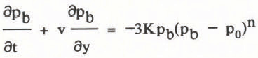
where pb and pO are bubble pressure and overburden pressure respectively, t is time, y is depth, v is vertical velocity, and n and K are constants. If the flow is in a steady state, the first term on the left-hand side becomes zero. Hence the vertical velocity v was obtained from the values of pb and pO shown in Figure 3. In the calculation, the value of K. was adjusted to take into account the temperature profile given in Figure 2, which has an activation energy of 0.8 eV (e.g. Reference HobbsHobbs 1974).
Figure 4 shows the estimated velocity v versus depth. Curve A was obtained on the basis of the flow law for volume expansion given by Reference NakawoNakawo (1986), and curve B was obtained from Reference Shoji and LangwayShoji and Langway (1983). Both profiles show a similar trend, although the former predicts a velocity five to seven times lower than the latter. The velocity is almost constant (about 3 mm/a in A and about 15 mm/a in B) at depths above 50 m, but it decreases rapidly with increasing depth.
The rate of vertical movement versus depth. A different flow law for the volume expansion of ice gave different profiles (see text).

As can be seen in the differences between the two curves A and B, vertical velocity is sensitive to K in the flow law for the bubble expansion. As Reference NakawoNakawo (1986) obtained the value from the time-dependent density data, his value might be more appropriate for estimating mean-pressure decrease than that of Reference Shoji and LangwayShoji and Langway (1983), which was derived by observing the expansion of a limited number of individual bubbles. Nakawo’s sample, however, had a considerable number of cracks, and the correction for the cracks meant there were some uncertainties in K. It would be reasonable, therefore, to conclude that the vertical velocity is of the order of several millimeters per year at depths above, for example, 60 m. For deeper parts of a core, the effect of K increases both on estimating the in-situ pressure from its measured value and also in deriving the velocity from the pressure.
In the bare ice area, the sublimation rate of surface ice was observed to be 50–70 mm/a around the drilling site (Nakawo and others 1984). The ice-ablation rate is much larger than the estimated vertical velocity of the ice’s upward movement. This may indicate that the surface of the bare ice field has lowered at a rate of about 50 mm/a. This lowering could have taken place very recently, since the vertical velocity was the value relative to the surface.
Age of Ice
From the velocity profile it was possible to estimate, for every depth, the age of the ice relative to the age of the surface ice, on the assumption of a steady state, which, however, may not be correct (as mentioned above). With the velocities of curve A, the difference in age from that of the surface ice became 18 ka at a depth of 50 m and 40 ka at a depth of 75 m. Curve B, on the other hand, resulted in age differences of 3 and 6 ka at the respective depths.
Because of the uncertainties in K., and the flow condition (steady state versus non-steady state), the attempt to determine the age of the core samples was not successful. The stratigraphie record shown in Figure 1, therefore, will not be discussed further. In summary, however, the rather short core may have preserved the information on past climate and/or the ice sheet over as long as 104–105a. The ice may have been deposited during the last glacial period, since the terrestrial age of meteorites found in the Yamato meteorite ice field was estimated to be less than 40–70 ka (e.g. Reference SchultzSchultz 1986).
Acknowledgements
The authors are grateful to Dr Y Ageta of the Water Research Institute, Nagoya University, for analyzing δ18O. This study was partly supported by a Grant-in-Aid for Scientific Research from the Japanese Ministry of Education, Science and Culture.



