INTRODUCTION
Environmental preferences may be solicited at different environmental scales, ranging from the protection of single species (Buschena et al. Reference Buschena, Anderson and Leonard2001) to measures for reducing global warming. Environmental preference studies most often address one theme at a time, for example by employing willingness to pay techniques (Bockstael et al. Reference Bockstael, Freeman III, Kopp, Portney and Smith2000) or by soliciting utility values (Keeney & Raiffa Reference Keeney and Raiffa1976; Keeney Reference Keeney1992). On the local scale, stakeholders may belong to the owners and users of a particular landscape (Bullock Reference Bullock1999), and on the larger scales, with several end-points aggregated (Frankenhauser et al. Reference Frankenhauser, Tol and Pearce1997; Sharifi et al. Reference Sharifi, van den Toorn, Rico and Emmanuel2002), stakeholders may be people and decision makers in many countries, or even the global community. The objective of this study is to examine if groups of environmentally-concerned individuals in different countries have different preferences for environmental issues or if the country groups rank issues similarly in importance. A study called The World Value Survey, (http://www.worldvaluessurvey.org/) has addressed environmental issues as part of a larger value study in about 100 countries on all the continents. However, the nine questions in that study addressing environmental issues focused more on environment versus costs (taxes, prices, efforts) than on preferences among issues. Furthermore, studies of benefit transfer have examined willingness to pay (WTP) values for more restricted goods and services across states in the USA (Loomis Reference Loomis1992) or issues related to health in European countries (Ready et al. Reference Ready, Navrud, Day, Duborg, Machado, Mourato, Spanninks and Rodrigues2004). Knowledge of environmental preferences is important, because measures to protect or improve the environment to an increasing degree obtain their legitimacy from laws, regulations and supportive actions that are supranational.
We first define six clusters of environmental issues which we believe cover the most important themes related to environmental protection: These are: (1) protection of land for wilderness preservation, (2) pollution control, (3) restrictions to avoid overharvesting, (4) restrictions on the use of nonrenewable resources, (5) applying the precautionary principle, and (6) assigning rights to animals that may conflict with human rights. Corresponding to these themes are six mitigation measures that we believe support sustainable environmental management. Thereafter we sketch a scenario for selecting between themes, so that the decision makers, respondents or judges (judges is the common term in comparison terminology) accept the decision situation. Preferences are found by the method of pairwise comparison, that gives weights, wi, to the six themes, where i = 1 to 6 and

as well as a measure for the agreement among the respondents. We hypothesized that people in different countries would have different preferences, depending upon the environmental conditions in their immediate region or in their country. For example, people in a country where air pollution is a daily problem may have higher preferences for pollution control measures than people in a region where air pollution is largely controlled and where other issues, like species extinction, are focused on in the newspapers. Furthermore, people in countries that have a large portion of their income from the export of non-renewable energy resources may be more willing to accept the use of such resources than people in countries that have to import it. Also media coverage, and the values expressed by officers of environmental non-governmental organizations (NGOs), may influence people's preferences. The extent of the coverage of environmental issues is likely to differ among countries.
MATERIALS AND METHODS
Themes for good environmental management
We suggest six criteria for sustainable environmental management, which is based on end-points related to sustainability, biotic diversity, nature's intrinsic value, and human needs. We do not use end-points directly because we found it difficult to construct realistic decision scenarios for end-points. We have not included a criterion for the reduction of pain in animals (and plants) inflicted directly by mankind. Neither do we address themes related to the optimization of agricultural yield, nor to support of the poor. We believe that the measures chosen are among the most frequently cited in ecological literature, for example, with only few exceptions, they comply well with the list of causes for species endangerment in the USA developed by Czeh and Krausman (Reference Czeh and Krausman1997). However, the selection includes components of subjectivity by the authors.
The pairwise comparison method
To rank issues, pictorial presentations and sensory feelings, the method of pairwise preferences is often used (Guilford Reference Guilford1954; Siegel et al. Reference Siegel, Castellan and John1988). With this method the issues to be valued are compared pairwise so that, for example, n = 6 issues require n(n-1)/2 = 15 pairwise comparisons. A preferred issue obtains a score of 1.0, and the non-preferred issue a score of 0.0. If a respondent is indifferent between two issues, a score of 0.5 is assigned to both. From scores on these comparisons, an n × n square table, or matrix, is constructed that summarizes the scores and allows issue preferences and degree of agreement between respondents to be calculated; there is no negotiation amongst the respondents. The aij terms in the matrix express the number of times one issue has been preferred, or been found to elicit indifference to another. Based on these aij coefficients, weights wi are calculated for each issue by summing the number of times an issue has been preferred in all pairwise comparisons and normalizing the results so that the weights satisfy Eq. (1). Agreement is measured by the parameter U (Siegel et al. Reference Siegel, Castellan and John1988):

where k is the number of respondents and n the number of issues to be compared. The sum is taken over the aij below or above the diagonal. The value of coefficient U ranges from −1 for complete disagreement to +1 for complete agreement among the respondents. Values around 0 give random scores. We tested the hypothesis Ho that U = 0 against the hypothesis H1 that U ≠ 0, the former null hypothesis being that there was no agreement among the respondents, the alternative being that the degree of agreement was greater than expected had the paired comparison been done at random. We calculated the test statistic

where the degree of freedom is given by n(n − 1)/2. The test statistics were compared to critical values of the χ2 distribution.
The decision framework
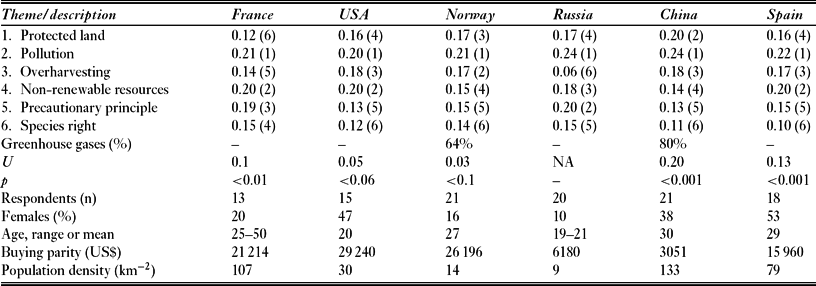
For the respondents to regard the decision situation as real, the decision had to be embedded in a life-like decision situation. We chose to present the situation as a choice of delegates to the United Nations with respect to the theme of the year (for example, in the year 2001 the theme was volunteer work). By using this framework we believed that the respondents would accept the necessity of preferring one theme over another. A questionnaire was presented to individuals in six countries during the years 2000–2002. In France, people that attended a seminar on decisions for environmental issues at University Claude Bernard (Lyon) were given the questionnaire. In the USA, the respondents were a class of students in environmental science at the University of Kansas (Kansas). In Norway, the respondents were students attending an introductory class in environmental science at Telemark University College (Porsgrunn). In Russia, the respondents were students at the Department of Theoretical and Experimental Mechanics, Sarov Physics and Technological Institute, which took a class in ecological risk assessment and, in China, they were students in environmental science at Taiyuan Technical University (Taiyuan). In Spain, the respondents were students of environmental science at the CSIC Centro de Ciencias Medioambientales (Serrano). Thus, the respondents were all familiar with environmental issues. The total number of respondents questioned in each country, and their average age and gender were noted (Table 1), as age and gender have been hypothesized to impact environmental preferences (Gifford Reference Gifford1996; Brennan Reference Brennan2002). Our questionnaire consisted of two pages. On the first page, we explained the United Nations context, presented the acronym for each issue cluster, and briefly described the issues in 10–25 words of text. Each description started with a sentence like ‘Nations should declare . . .’ or ‘Nations should develop . . .’. On the second page, we presented the rating matrix relating theme A to B, A to C, and so on, the rating rules, and two or three words reminding the respondents of the theme content. For the French, Spanish and USA studies, the questionnaire was written in English, for the Norwegian study it was written in Norwegian and for the Russian study the questionnaire was in Russian. The Chinese students could select either Chinese or English texts. Responses were handed in immediately, or within 2–3 days of the distribution of the questionnaire. The response rate was 70–80%. Copies of the questionnaire and the spreadsheet used to calculate results are available online (supplementary material at URL http://www.ncl.ac.uk/icef/EC Supplement.htm).
Preferences for environmental themes in six countries (weights, wi, on a 0–1 scale for each theme obtained by pairwise comparison technique and statistical treatment). Number in parenthesis designates rank. For Norway and China we provide % relative concern for greenhouse gases with respect to all pollutants. Number of respondents is number of respondents to the questionnaire. U = degree of agreement on a −1 (complete disagreement) to +1 (complete agreement) scale. p = significance of the agreement. NA = raw data not available. Buying parity and population density obtained from Le Nouvel Observateur (Reference Le Nouvel2001).

Clusters of management measures
We identified six clusters of management measures corresponding to the six themes described above. For each theme we show below the text that was presented to the respondents. Since the respondents were environmentally concerned, we also included here a few notes on auxiliary measures that we believed would have been suggested to the respondents by the leading text we chose for the questionnaire if the respondents read such scientific journals as Science and Nature. In a test session, we found that the reaction of individuals to our leading texts was as anticipated, but undertook no further testing after the questionnaires were filled in by the respondents. Not all measures within a cluster were expected to be independent of measures within other clusters, but the separation between measures was considered to be sufficient for the respondents to distinguish clearly among them. Six clusters may be close to the maximum number feasible for most respondents to handle (Miller Reference Miller1956).
(1) Protection of land. Nations should declare large areas as protected land
Humans require space for buildings, roads, agriculture and waste disposal (including atmospheric green-house gases), often expressed as their footprint (Wackernagel et al. Reference Wackernagel, Lewan and Hansson1999). Human space requirements are listed as the second to fourth causes of species endangerment in the USA (Czeh & Krausman Reference Czeh and Krausman1997).
(2) Restrict pollution. Nations should emphasize laws and control measures against pollution, including greenhouse gases
The implications of the first part should be easily understood by the respondents, but the inclusion of greenhouse gases might have been questioned by some. We found it difficult to formulate the question so that traditional pollutants would be separated from greenhouse gases.
(3) Harvesting and agriculture. Nations should develop laws against overharvesting and harvesting of endangered species
We included harvesting of endangered species as a separate measure, because overharvesting may be strongly associated with the harvesting of fish and wood and not with endangered animal species. The long-term effect is risk of species extinction and reduced genetic diversity.
(4) Non-renewable resources
The idea here was that nations should develop incentives to reduce the use of non-renewable resources like oil and gas. This fourth cluster of measures addresses the issue of physical and chemical resources being used so slowly that humans could find replacement resources.
(5) Precautionary principle. Nations should include the precautionary principle in their environmental legislation
The principle here was that no action affecting the environment should be undertaken if all feasible negative effects are not known and evaluated. Measures that emphasized nature's intrinsic values rather than human needs belonged to this cluster.
(6) Animal rights. Human interests and even human lives may sometimes be subordinate to animal rights (tigers and wolves should be allowed to exist even if they will cause some statistical fatalities)
Measures that allow top carnivores to roam the wilderness, and measures that restrict hunting of these animals belonged to this cluster.
RESULTS
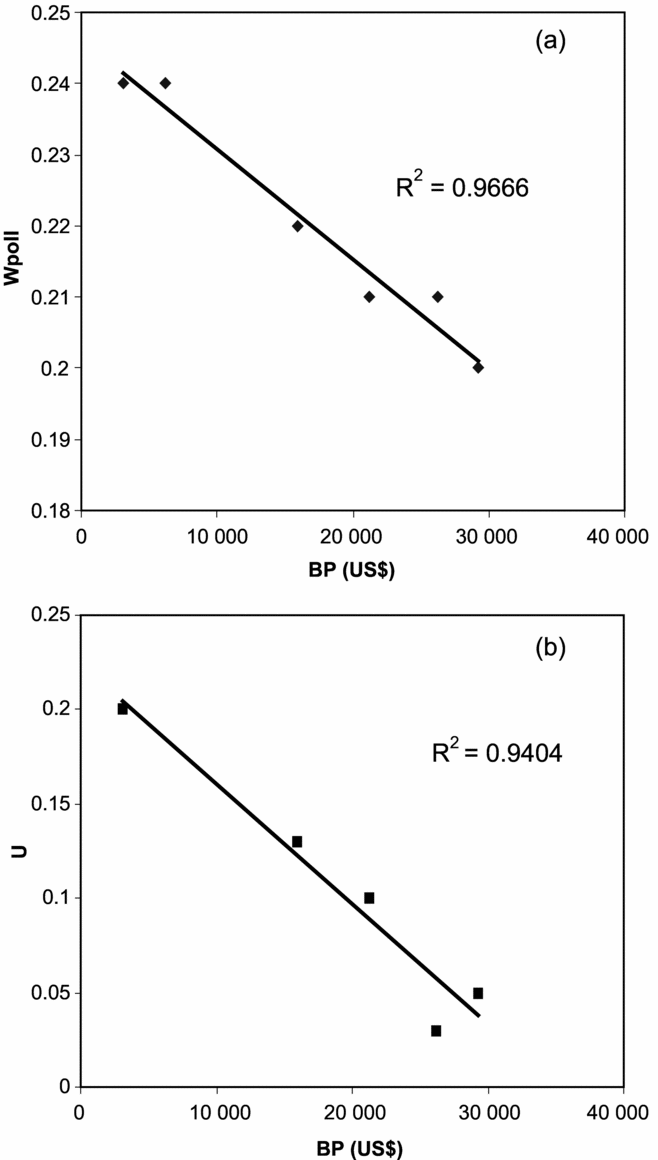
Pollution and measures to mitigate pollution (issue 2) were ranked most highly (1) in all six countries with weights wPoll in the range 0.20–0.24 (Table 1). In spite of the small range, the weights were a smooth function (r 2 = 0.967, p < 0.0004) of the country's buying power (BP):

Although group preferences (aggregated individual preferences) in all countries gave highest weight to pollution control, groups in the poorest countries put more weight on this than others. No other sets of weights showed associations with buying power. We only obtained responses from two countries on the relative weights of greenhouse gases and ordinary pollutants, but greenhouse gases appeared to carry 60–80% of the burden from pollution (Table 1). Protecting animal rights (issue 6) scored low in groups in all countries when these rights were contrasted with the statistical loss of human lives (weights wSpe in the range 0.11–0.15). Although effective protection of land as wilderness areas or as national parks will also preserve animal rights, the conflict between rights, species preservation and humans were not emphasized. The groups in the USA, Spain and Norway had similar rankings of preferences. The group in China emphasized protection of land more than the others (wLand = 0.20, rank 2). The group in Russia put very little emphasis on overharvesting of renewable resources (wHar = 0.06, rank 6) and the group in France, like the group in Russia, put emphasis on the precautionary principle (wPre 0.19–0.20, ranks 3 and 2, respectively).
Consistency and agreements
The degree of agreement among the respondents on what they prioritized (U) decreased (r 2 = 0.940, p = 0.0064) with the country's buying power. The country with the lowest BP (gross domestic product per caput adjusted with purchase power parity) was China, and the country with the highest BP was the USA.

The U value also decreased with BP, with values for the group in China giving the most consistent weighting (U = 0.20, p < 0.01). There was a strong relationship of both the weight given to concern for pollution (wpoll) and U as a function of BP (Fig. 1). Age and gender had no significant effects.
(a) Weight placed on pollution restriction measures (wpoll) and (b) degree of agreement (U) as a function of buying power, BP (US$; Le Nouvel Observateur Reference Le Nouvel2001).

DISCUSSION
Concerns for pollution were highest across groups in all countries and concerns for endangered species were among the lowest. Concerns for pollution may relate to pollution effect both on the environment and on people's health, although the study emphasized the environment. We suggest that an explanation for the close negative association between buying power and concern for pollution may be that buying power acts as a proxy for pollution, that is, countries with low buying power are also the countries where pollution is most prevalent and probably also most visible. The environmental Kuznets curve relating countrieś income to pollution showed an inverse U–shaped pattern (Selden & Song Reference Selden and Song1995), but for pollution abatement preferences it would be more reasonable to anticipate a satiation-level type of function (for example Andreoni & Levinson Reference Andreoni and Levinson2001). Although our data show a high probability of an inverse association between buying power and preferences for pollution abatement measures among the groups, the data were too thin to support second order effects which the description of satiation level would require. The results indicate that among the many forces that may help explain the high pollution level in countries with medium income (lack of advanced institutions to internalize externalities, increasing returns to scale), low preferences for abating pollution was not one of them, at least not among our respondents.
The finding that the degree of agreement among the respondents decreased with buying power supports the inverse relationship between buying power and concern for pollution.
The low weight on species rights contrasts with the strong emphasis on this topic in recent literature on environmental philosophy and conservation biology (for example Ayers Reference Ayers and Hargrove1986; Callicott et al. Reference Callicott, Crowder and Mumford2000). The abatement measures related to the six environmental themes did not show one-to-one correspondence with end-points like preservation of large carnivore species, endangered species, or holistic end-points related to land ethics (for example Leopold Reference Leopold1949). It may be possible to solicit preferences both ways, from the perspective of mitigation measures and from the perspective of end-points. However, to accomplish the latter, end-points have to be carefully formulated so that they are understood within the same framework in all countries. For example Keeney and McDaniels (Reference Keeney and McDaniels2001) discuss this topic with respect to climate change policies and Ready et al. (Reference Ready, Navrud, Day, Duborg, Machado, Mourato, Spanninks and Rodrigues2004) do so with respect to health issues.
Our results for preferences across countries are surprisingly significant. There are several reasons why this should not be the case. Although the sample of respondents largely represent a captive audience belonging to the middle class, we would have anticipated that age and gender, as well as other unidentified factors, would have influenced the results more than they appear to have done. One reason may be that preferences for environmental values belong to characteristics that are deeply embedded in a nation (Walas Reference Walas1995), like the preferences for certain food types, so that even small samples are representative of wider traits. The World Value Survey shows a strong agreement weighing values in different cultures (http://www.worldvaluessurvey.org/). Furthermore, since individuals in our groups probably were more informed than the average individual in each country, the ranking may be more precise than for a random sample from each country (Cameron & Englin Reference Cameron and Englin1997; Kenyon & Edwards-Jones Reference Kenyon and Edwards-Jones1998).
Weights as reflections of the state of the environment
The groups in France, the USA and Spain showed that incentives to reduce the use of non-renewable resources had a high weight (wNon = 0.20), whereas this issue had a lower weight in groups from Norway and China (wNon = 0.14–0.15). This may reflect the high percentage of nuclear power and shortage of oil and gas in the first three countries, whereas oil and gas are exported and responsible for a large portion of Norway's revenues, and coal, the preferred fossil fuel used in China, is abundant. Individuals in the Norwegian group assigned a relatively high weight to measures against overharvesting (wHar = 0.17, rank 2), whereas this measure was accorded a lower rank (3–6) among groups in the other countries. An explanation for this result may be that the Norwegian population frequently is exposed to statements in the press that fisherfolk from several nations overexploit their fish populations. In a study on WTP for health improvements in European countries, Ready et al. (Reference Ready, Navrud, Day, Duborg, Machado, Mourato, Spanninks and Rodrigues2004) found consistent national differences, but were unable to explain them in terms of measured differences, such as in health status or income. However, they suggested that the differences may be a result of as yet unmeasured differences in culture or shared experiences. Studies related to landscape protection show, for example, that local landscape patterns affect the demand for landscape protection (Schläper & Hanley Reference Schläper and Hanley2003). Our results suggest that although it is currently impossible to determine national differences in statistical terms, more thorough investigations may reveal real differences. Our results have implications for benefit transfer studies and for implementation policies across nations to strengthen environmental protection and management. For example, benefits accrued in one country may not have the same weight in another country, in particular if countries have different economic development status. Our study also suggests that efforts to preserve species diversity may require other types of public motivation than efforts to reduce pollution or to use non-renewable resources.