INTRODUCTION
In tropical forests, leaf-litter ants are abundant and diverse (Agosti et al. Reference AGOSTI, MAJER, ALONSO and SCHULTZ2000). They make up a large proportion of the leaf-litter fauna (Brühl et al. Reference BRÜHL, ELTZ and LINSENMAIR2003). Because of their high numbers, leaf-litter ants perform important and diverse functions in the leaf-litter ecosystem, they are important for bioturbation (Folgarait Reference FOLGARAIT1998), for seed dispersal and granivory (Pfeiffer et al. Reference PFEIFFER, NAIS and LINSENMAIR2006). Furthermore, these ants influence other arthropods in the leaf litter by predation and various interactions (Agosti et al. Reference AGOSTI, MAJER, ALONSO and SCHULTZ2000). Like other tropical ant assemblages, leaf-litter ant communities are structured by several forces, including competition (Pfeiffer et al. Reference PFEIFFER, HO and TEH2008), abiotic factors (Blüthgen et al. Reference BLÜTHGEN, GEBAUER and FIEDLER2003) and random processes (Floren & Linsenmair Reference FLOREN and LINSENMAIR2000). We conducted a large study in Bornean forests in order to explore the impact of different mechanisms on community structure and species composition (Mezger & Pfeiffer, unpubl. data). If abiotic factors are considered as important in explaining high diversity in the tropics, we might expect especially narrow niches that allow the coexistence of many species. A major factor suitable for species separation by niche partitioning might be temperature.
Temperature can influence ants in various ways; it may impact the development time of their immature stages (Hartley & Lester Reference HARTLEY and LESTER2003), all of their activities (Albrecht & Gotelli Reference ALBRECHT and GOTELLI2001) such as foraging or even mating (Noordijk et al. Reference NOORDIJK, MORSSINKHOF, BOER, SCHAFFERS, HEIJERMAN and SÝKORA2008), as well as the metabolism of brood and adults. In temperate regions some ant species, especially bigger-bodied species with a large colony size, are able to warm their nests by internally produced metabolic heat (Rosengren et al. Reference ROSENGREN, FORTELIUS, LINDSTRÖM and LUTHER1987), while most tropical species seem to lack active temperature regulation and have to choose a nest place according to their thermal requirements. For this reason ant species on tropical mountains show typical distribution patterns with thermally specialized species being restricted to certain elevation ranges, thus demonstrating niche partitioning along a thermal gradient (Malsch et al. Reference MALSCH, FIALA, MASCHWITZ, MOHAMED, NAIS and LINSENMAIR2008).
There is a close relationship between temperature and behavioural dominance (Lessard et al. Reference LESSARD, DUNN and SANDERS2009, Santini et al. Reference SANTINI, TUCCI, OTTONETTI and FRIZZI2007) often resulting in a dominance–thermal tolerance trade-off: dominant species prefer higher temperatures, while subdominant species show activity at all temperatures (Lessard et al. Reference LESSARD, DUNN and SANDERS2009) or at more extreme temperatures (Bestelmeyer Reference BESTELMEYER2000).
Most of the studies of ant temperature preferences have examined how temperature partitioning affects competition for food resources by studying the foraging activity of ants (Cerdá et al. Reference CERDÁ, RETANA and MANZANEDA1998). However, little is known about the way that niche separation of different species is impacted by the thermal requirements and thermal preferences of their brood. The only studies which were conducted to explore thermal requirements of the brood focused on single species (Bollazzi & Roces Reference BOLLAZZI and ROCES2002, Porter & Tschinkel Reference PORTER and TSCHINKEL1993). For the first time, we have conducted a large experimental study of the temperature preferences of leaf-litter ants from tropical rain forests at the community level, including tests of individual species in the laboratory combined with field observations on assemblages from different forest types. Forty-one ant species from primary rain forest were tested for their thermal preferences during brood care, based on an essential subset of a species-rich leaf-litter ant community (Mezger & Pfeiffer, unpubl. data). With these data, we tested the hypothesis that ant species differ in their thermal niche requirements. In detail we studied the following hypotheses: (1) the thermal niche for brood care differs significantly among the studied ant species; (2) functional groups (specialized predators, opportunists, tropical climate specialists, generalized myrmicines, cryptic species) differ in their preferred temperatures; (3) ant species of various nest types and/or habitats show different temperature preferences; (4) macroclimatic conditions in the forest correlate to brood-raising thermal preference.
MATERIALS AND METHODS
Study sites
This study was conducted in Gunung Mulu National Park (4°57′N, 114°47′E) in Sarawak (Malaysia) on Borneo. The climate in this 528-km2 area is tropical wet, with mean temperatures in the lowlands of about 26 °C and 4000–5000 mm y−1 of rain (Sarawak Weather Service, pers. comm.). We recorded data from 5 April 2006 to 4 June 2008. The Gunung Mulu National Park is covered by several types of forest (Hazebroek & Morshidi Reference HAZEBROEK and MORSHIDI2001), four of which we have examined. (1) Alluvial forests (50–60 m asl) are inundated several times a year. Minor altitudinal differences between various areas of this forest type influence the local flooding frequency. The lower, more frequently flooded parts grow on gley soils of the Bijat family, while the higher areas that are seldom flooded grow on podzolic or peaty soils (Proctor et al. Reference PROCTOR, ANDERSEN, CHAI and VALLACK1983). Alluvial forests in Mulu NP are rich in tree species, dominated by the Leguminosae and to a lesser extent by Ebenaceae, Euphorbiaceae and Dipterocarpaceae trees (Proctor et al. Reference PROCTOR, ANDERSON and VALLACK1982). Few trees within our study area reached heights of more than 40 m. (2) Limestone forests (75–250 m asl) are found on steep terrain. Their shallow soils consist largely of mull humus (0–50 cm in depth), which is irregularly interrupted by jagged limestone rocks. In terms of flora these are species-poor forests dominated by Dipterocarpaceae trees (Proctor et al. Reference PROCTOR, ANDERSEN, CHAI and VALLACK1983) of up to 30 m. (3) Lowland mixed dipterocarp forest (200–300 m asl) grows on red-yellow podzolic soils with a substantial organic layer of up to 15 cm. This type of forest is floristically species-rich and trees of the dominant family, Dipterocarpaceae, reach heights of up to 57 m (Proctor et al. Reference PROCTOR, ANDERSEN, CHAI and VALLACK1983). (4) Kerangas or heath forests (180–200 m asl), grow on terraces with sandy organic podzols. These forests are dominated by trees of the families Dipterocarpaceae, Guttiferae and Myrtaceae and show medium tree species richness. The forests we used for our study had tree heights of up to 40 m (Proctor et al. Reference PROCTOR, ANDERSON and VALLACK1982).
Sampling and keeping ant nests
We sampled ant nests from the above four forest types. We searched opportunistically for all types of nests on the ground layer and noted the microhabitat and nest type of every ant colony found. Ant nests were transferred to small terrariums, with the bottom covered with plaster of Paris to maintain a constant moisture level. All ant colonies were well fed with sugar solution, honey, sesame seeds and dried fish, the metabolic state of ants being known to influence their temperature preferences (Porter & Tschinkel Reference PORTER and TSCHINKEL1993). To avoid any possible effects of long-term captivity on the ant colonies we conducted all experiments within a period of 4 d after collection. During this time we kept the terrariums in semi-natural conditions, i.e. outside under shade and in a natural temperature pattern.
Collecting habitat parameters
At the same time, we conducted temperature measurements in the forest types in which the nests were collected (Appendix 1). We used iButtons (DS 1921G-F5, Maxim GmbH, Fraunhofer Str. 11, 82152 Planegg, Germany) to measure soil temperature; ten such loggers were used per forest type. They were placed 5 cm deep into the soil and measured temperature every 40 min for a period of 5 mo. We employed temperature loggers (two channel data logger ONS-H08, Synotech GmbH, Franzosenberg 9, 52441 Linnich, Germany) to measure the air temperature 10 cm above the leaf litter. These data loggers measured the temperature every 20 min for 5 mo (we used one to three loggers per forest type).
In the same area, we conducted a study on ant diversity and community structure (Mezger & Pfeiffer, unpubl. data). Ants were collected from 98 plots, for which we recorded several habitat parameters, two of which were used in the present study. (1) In order to test the influence of ground vegetation cover on temperature preferences of ants, we developed a vegetation index in which each type of vegetation received a certain number of points according to the contribution of the plants to vegetation density: seedlings 0.25 points, herbs and ferns 1 point, climbers 1.5 points, tree saplings 1 to 4 points according to size, and small trees 5 points. (2) To measure canopy openness, we took pictures with a Nikon Coolpix 5900 digital camera of the canopy directly above the plot; from these pictures we calculated canopy openness with the software Gap Light Analyzer 2.0 (downloadable from http://www.ecostudies.org/gla/).
Ant species identification
From all ant colonies in our experiments we kept voucher specimens for identification; these are deposited at the ‘Antbase.net collection’ of the University of Ulm (ABNC), with Automontage© photographs of most species being available via http://www.antbase.net. Identification of ant genera was performed using Bolton (Reference BOLTON1994); details on the identification of the species are given elsewhere (Mezger & Pfeiffer, unpubl. data).
Measurements of temperature preferences of ant species
We analysed temperature preferences of ant colonies for their brood in a self-constructed controlled temperature gradient in our laboratory in Gunung Mulu National Park. The main part of this temperature gradient was a metal ring (width 30 mm) with an inserted runway (total diameter 37.5 cm). This experimental runway was 18 mm wide. The sidewalls of the metal ring that confined the runway were 7 mm high and were extended by means of about 5 mm of modelling clay. This ring was connected with heating and cooling devices in order to create a double temperature gradient. We covered the apparatus with a plate of acrylic glass. The ring was heated on one side with a soldering iron (power 40 W) in combination with a digital thermostat (universal thermostat UT 100, Conrad Electronic SE, Klaus-Conrad-Str. 1, 92240 Hirschau, Germany). On the opposite site, the ring was cooled by running water and a Peltier element energized by a switched-mode power supply (Voltkraft SPS 1525 PFC). The warmest part had a mean temperature of 32 °C (± 0.5 °C), whereas the coolest point that we generated had a mean temperature of 16 °C (± 0.5 °C). All experiments were conducted with the same apparatus.
Since Roces & Núñez (Reference ROCES and NÚÑEZ1989) found only small differences in the temperature preferences of ants at night and during the daytime (mean difference 3 °C), we conducted experiments day and night in order to be able to test a variety of different colonies. Before each experiment the runway was covered with a flat circle of wet paper to ensure constant air humidity. This piece of paper was changed after each trial to avoid any possible influence by ant pheromones from other colonies. We chose brood-tending ants or ants that stayed near the brood for our experiments; in some cases the whole colony was put into the arena. For better handling of the ants we immobilized them in a deep-freeze compartment for 60–90 s (according to ant size) at a temperature of −20 °C. Our aim was to use 25 worker ants together with 25 larvae or pupae. A considerable proportion of colonies were smaller than this (Appendix 2 gives colony size). In such cases we used all suitable workers and brood items of the respective nest. Effectively we tested between five and 25 ants and the same number of larvae or pupae in one run. Since different starting temperatures might result in biased temperature preferences (Bollazzi & Roces Reference BOLLAZZI and ROCES2002), we placed worker ants or a brood in the middle of the temperature gradient on the runway. We darkened the whole apparatus to avoid any influence of light on the location choice of the ants.
After 6 h we measured the ground temperature at the locations to which the ants had transported their brood (Conrad LCD hand thermometer DT-300). We noted the number of ants, larvae, and pupae at different places. Single, moving, or dead ants were omitted. In cases in which the brood was still lying at the initial point, and had not been moved by the ants in any way, we did not use any data from these experiments, and the same was done with runs in which the brood had strayed over a large temperature gradient. If the ants had chosen more than one place for their brood we calculated a mean value for statistical analyses by using the formula:
T = ΣTj×Nj/Ntotal (where T = mean temperature at the brood location, N = number of larvae or pupae at place j, and Ntotal = total number of brood items).
Statistical analyses
All species with a sample size of at least two or more runs were divided into steno- or eurythermal species. Stenothermal species are defined as those species which are restricted to a narrow range of temperatures, while eurythermal species are adapted to occupy a broad range of temperatures (Begon et al. Reference BEGON, TOWNSEND and HARPER2006). To ensure a conservative classification, ant species were classed as stenothermal when the standard deviation of their temperature preferences was less than 2.0 °C, whereas species with a larger standard deviation were classed as eurythermal. For this classification we chose the standard deviation instead of the absolute range in order to avoid an overestimation of outliers in larger sample sizes.
For analysing temperature preferences, we calculated ANOVAs to compare various groups. For comparisons of non-parametric data we used multiple U-tests and corrected their P-values with the false discovery rate (FDR), as proposed by Benjamini & Hochberg (Reference BENJAMINI and HOCHBERG1995). We analysed different datasets: (1) For comparing genera we used all genera with a sample size of n ≤ 4 and calculated mean temperature preferences for these. This approach was repeated to find differences among species. (2) To test for different temperature preferences of ants with different nest types we used the complete data set with all 119 tested nests, since single ant species quite often used several nest types. For this test, we separated four nest types depending on their structure: (a) mud nests attached to stems of saplings as described in Mezger & Pfeiffer (Reference MEZGER and PFEIFFER2008), (b) nests in small sticks, (c) larger dead wood used as a nesting site and (d) nests in leaf litter or topsoil. (3) Further, we compared the temperature preferences of the functional groups involved by using the scheme that Andersen (Reference ANDERSEN1997) developed for an ecological classification of ants. (4) For comparing temperature preferences of different forest types, we used one temperature for each species occurring in the respective forest type; in case we tested several colonies of one species from the same forest type, we used the mean value of their temperature preferences for these analyses.
To evaluate whether the preferred temperature of a species matched with its nest temperature in the field, we correlated the mean preferred temperature of ant colonies as obtained from experiments and the temperatures measured in the habitats in which the nests were collected. Nests in small sticks and leaf litter close to the ground, and in dead wood were probably more influenced by soil temperature; hence soil temperature was assigned to these colonies. Mud nests on saplings and very exposed nests in sticks were most likely influenced by air temperature rather than soil temperature, and hence we assigned the air temperature of the respective habitat to these colonies. Altogether we used eight combinations: air and soil temperature of each of the four forest types.
For calculation of assemblage preferences, we used occurrence data from our diversity study (Mezger & Pfeiffer, unpubl. data) that was conducted by sampling 98 1-m2 plots in the same four forest types. From each of these plots, we calculated a grand mean of temperature preferences for those species which occurred in the plots and which we had experimentally tested. Then we assessed the influence of canopy openness and vegetation density of the plots on the temperature preferences of the plot ant assemblages by regression analysis.
Null model analyses
The data consist of the temperature preferences of the species, arranged in five narrow classes. We used Ecosim 7.0 (downloadable from http://www.garyentsminger.com/ecosim.htm.) for analyses of niche overlap. This computer program calculates the significance of niche overlap patterns by comparing them with null models in which the observed data were randomized among species. In each run we calculated the mean Pianka index (Pianka Reference PIANKA1973) from 30 000 iterations. The two most important randomization algorithms (RAs) RA 3 and RA 4 are described in Winemiller & Pianka (Reference WINEMILLER and PIANKA1991) and Albrecht & Gotelli (Reference ALBRECHT and GOTELLI2001). While RA 3 retains the niche breadth it allows the use of any possible resource states. RA 4 also retains the niche breadth, but does not allow the use of zero-entries that account for temperature ranges not used by any observed species. As we could not test all species of litter ants occurring in the respective habitats, we used the RA3, which considers unoccupied niches as surrogates for missing species. On the other hand we also wanted to test whether our tested species alone showed any pattern by exclusion of the unoccupied niches (RA 4). Our niche categories were five temperature ranges from 17 to 32 °C. We tested several data (sub-)sets. First, we analysed the whole data set with all species from all forest types. A further calculation was performed separately for the 11 species of Pheidole since we were interested in niche partitioning in this highly diverse genus. Then we calculated separate data sets for each of the communities of the four forest types, for which we again analysed all species of the respective forest type as different ecological conditions in different forest types may result in different niche patterns.
RESULTS
Brood temperature preferences of ant species in an artificial set-up
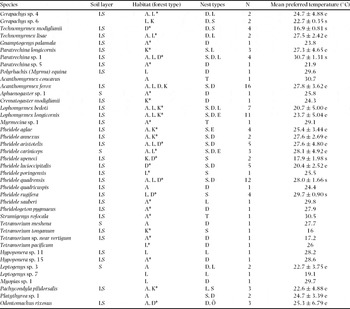
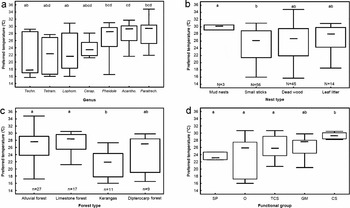
In order to explore the thermal preferences of soil- and leaf-litter-dwelling ants for their brood we tested 119 ant colonies from six subfamilies and 41 species for their temperature preferences in an artificial set-up (Table 1). The seven commonest genera (n ≥ 4, according to nest occurrences) showed significant temperature preferences (Figure 1a, multiple U-tests, P < 0.029, FDR: P < 0.035). The median of the temperatures for all species was 25.8 °C, ranging from 16.0 °C for Tetramorium tonganum (n = 1) to 30.7 °C for Acanthomyrmex concavus (n = 1) and Paratrechina sp. 1 (30.7 °C ± 1.3 °C, n = 4). We found the 10 commonest species (n ≥ 4) also differed significantly in their preferred temperatures (multiple U-tests, P < 0.02, FDR: P < 0.03). Among these species were five of Pheidole (P. lucioccipitalis, P. quadrensis, P. aristotelis, P. rugifera and P. aglae), which showed temperature preferences over a broad range, with P. lucioccipitalis at the lower (20.3 °C ± 2.5 °C, n = 5) and P. rugifera at the upper end (29.7 °C ± 0.9 °C, n = 4).
List of species used for experiments on temperature preference. Soil layer indicates the occurrence of a species either in leaf litter (L), top soil (S) or both (LS). These occurrences were assessed with Winkler bags, and so missing values indicate that the species was not found in Winkler samples. Abbreviations for habitat type: A = alluvial forest, L = limestone forest, K = kerangas, D = dipterocarp forest. * indicates that the respective species was collected in further habitats during further studies. Only species with two or more runs in the temperature gradient were classified as stenothermal or eurythermal ants using the following definitions: eurythermal (SD with temperature preferences > 2 °C) and stenothermal (SD with temperature preferences < 2 °C). Abbreviations for nest types: D = dead wood, L = leaves of leaf litter, S = small sticks, T = soil on tree sapling, E = mud nest. Species authorities and subfamilies are given in Appendix 2.

Several subsets of the studied species differed in their temperature preferences. Median, interquartiles and absolute range of preferred temperatures of the seven most common ant genera (Techn. = Technomyrmex; Tetram. = Tetramorium; Lophom. = Lophomyrmex; Cerap. = Cerapachys; Acanth. = Acanthomyrmex; Paratrech. = Paratrechina) used in this experiment (number of tested colonies ≥ 4) (a), of different nest types (exposed mud nests were attached to the stems of small saplings about 10 cm above the ground) (b), species assemblages of four different forest types (c) and five functional groups (SP = specialized predators, O = opportunists, TCS = tropical climate specialists, GM = generalized myrmicines, CS = cryptic species) (d). For sample size of (a) and (d), see Table 1. Similar letters mark groups that did not differ in statistical tests.

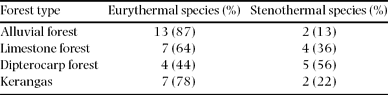
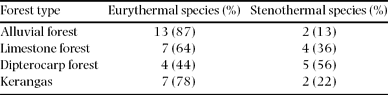
Only eight of the 41 tested species seemed to be restricted to one forest type; all other species were collected in the present study, or in additional studies, in at least one further habitat (Table 1). We classified six species as stenothermal and 15 as eurythermal (Table 1). In alluvial forest we found more eurythermal than stenothermal species, whereas in dipterocarp forests most classified ant species were stenothermal (Table 2).
Number and percentage of eurythermal (SD of temperature preferences > 2 °C) and stenothermal (SD of temperature preferences < 2 °C) ant species in the four forest types.
Ants from mud nests on tree saplings preferred significantly warmer temperatures (29.9 °C ± 0.7 °C, Figure 1b) than ants that nested in small sticks (24.9 °C ± 4.9 °C; multiple U-tests, P < 0.02, FDR: P < 0.05), whereas no differences were found between these two nest types and nests in dead wood (25.6 °C ± 4.7 °C) or in leaf litter or soil (26.3 °C ± 4.1 °C).
Experimentally obtained temperature preferences of species
Experimentally obtained temperature preferences of ant species from the various forest types differed significantly (ANOVA F3,65 = 5.3, P < 0.003). Mean preferred temperatures of ants from the alluvial forest (26.3 °C ± 3.8 °C, n = 27) and from the limestone forest (27.1 °C ± 3.4 °C, n = 19) were significantly higher than those from the kerangas (21.2 °C ± 4.1 °C, n = 9, HSD post hoc test, P < 0.05, Figure 1c). Temperature preferences of ant assemblages from the dipterocarp forest did not differ from all other types (23.9 °C ± 5.3 °C, n = 10). Three species, Acanthomyrmex ferox, Lophomyrmex longicornis and Pheidole quadrensis, were common in at least three forest types (total n ≥ 10 nests for each species). We tested whether these ant species showed special adaptations to their habitat type and checked whether colonies from the different forest types differed in their temperature preferences, but found no significant differences (multiple U-tests, P < 0.1).
The species we used for our experiments were attributed to five functional groups: opportunists, generalized myrmicines, tropical climate specialists, specialized predators and cryptic species. The preferred temperatures of these groups differed significantly (Figure 1d, multiple U-tests, P < 0.015, FDR: P < 0.04).
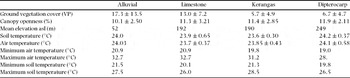
In order to explore temperature conditions in the natural habitats of the ant species we measured soil and air temperatures in all four forest types (Appendix 1). The correlation between the preferred temperature of the ant species (grand mean) and the temperature of the nest surroundings (soil or air temperature, depending on nest type) was significant (Spearman correlation test, n = 8, r = 0.84, t = 3.41, P < 0.02).
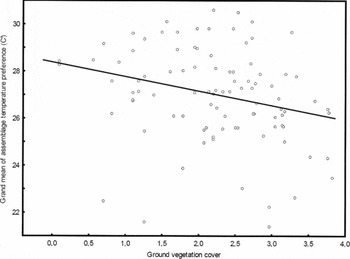
Vegetation cover is likely to influence ground temperature, and therefore this habitat parameter might affect the structure of ground ant communities with regard to their thermal preferences. Canopy openness differed non-significantly between the four types of forest (Kruskal–Wallis ANOVA, FG = 3, χ2 = 5.49, P = 0.14, Appendix 1), whereas ground vegetation cover measured as vegetation points differed significantly between the forest types (Kruskal–Wallis ANOVA, FG = 3, χ2 = 21.7, P < 0.001, Appendix 1). The mean preferred temperature of the plot-inhabiting ant species decreased slightly with rising plant cover (linear regression: F1,95 = 6.79, P < 0.02, r2 = 0.06, Figure 2); this relationship was somewhat clearer for the ant community in alluvial forest (linear regression, df1,28 = 9.55, P < 0.005, r2 = 0.23). Canopy cover had no influence on the assemblage preferences in sample plots (linear regression, df1,95 = 0.17, P = 0.7, ns, r2 = 0.002).
Influence of ground vegetation density (measurement: number of vegetation points, a small-scale classification of the three-dimensional plant structure on a 1-m2 plot) on the plots on the grand mean of preferred temperatures of the ant assemblages sampled on these plots (N = 98). Regression equation: y = 28.4−0.61x.

Niche differentiation by null model studies
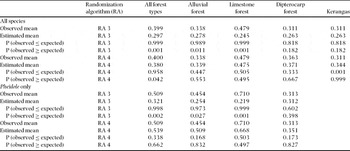
We analysed the experimentally obtained temperature preferences of all ant species with Ecosim for niche overlap (Table 3) and tested several subcommunities. When all species of the whole data set were used, the observed Pianka index for both randomization algorithms was significantly larger than the simulated index (RA 3, P < 0.001; RA 4, P < 0.042), suggesting aggregation of niches. We further tested the four forest types with all their species separately. When we used RA 3, we found for alluvial and limestone forest significant niche aggregation (alluvial P < 0.011; limestone P < 0.001), while other results were not significant. When calculated with RA 4, simulated index of the kerangas forest was significantly larger than the observed index (P < 0.001), thus indicating niche differentiation in this forest type.
Ecosim simulation of niche overlap. We tested with null models and 30 000 iterations whether the observed patterns of temperature preferences within ant communities were significantly different from any pattern produced by chance. We present the observed and simulated mean index values of the Pianka index and the P value (probability of observed and simulated index) and the observed and simulated variance including their P values. For all datasets and subsets we calculated two randomization algorithms: RA 3 and RA 4. In the first part, we present results from the whole dataset; in the second part we present results from a data subset containing only Pheidole data. Data for the kerangas comprised only one Pheidole species, thus could not be tested. Observed index values significantly larger than expected point towards niche aggregation, while observed values smaller than expected indicate niche separation within communities.

When we analysed all 11 Pheidole species used in this experiment for all plots together with RA 3, their calculated index was significantly larger than their simulated index (P < 0.002). By analysing the subsets of this genus for the single forest types, we found a similar result for alluvial forest (P < 0.027) and limestone forest (P < 0.001). When we analysed these Pheidole data sets with RA 4 we did not find any significant pattern.
DISCUSSION
Thermal preferences of ant species
We consider brood temperature to be especially important for ants since it affects all individuals of a colony during their development. The temperature requirements of larvae and pupae are, in many cases, similar to those of adults (Banschbach et al. Reference BANSCHBACH, LEVIT and HERBERS1997). Because of their small nest size and generally minute body size, ant species inhabiting the leaf litter of tropical rain forests cannot regulate nest temperature in the same way as those species from temperate regions with large colonies and large to medium-sized workers, such as ants of the genus Formica (Rosengren et al. Reference ROSENGREN, FORTELIUS, LINDSTRÖM and LUTHER1987). Hence leaf-litter ants have to choose a site with a suitable temperature. When the temperature of the nest site becomes unfavourable, the ant colony and its brood may move to a new nest site that better suits its thermal requirements, as was demonstrated by Roces & Núñez (Reference ROCES and NÚÑEZ1989) in their experiments with Camponotus mus. We have observed that many species of the leaf litter, viz. species of Pheidole, Tetramorium and Technomyrmex, have the ability to change their nest site rapidly when they escape flooding of the forest floor in alluvial forest by moving their whole colony to a higher location (Mezger & Pfeiffer, unpubl. data).
The observed temperature preferences in the artificial set-up range from 16 °C to almost 31 °C. This broad range of temperatures may be explained by the combination of species from lowland and montane areas which co-occur in the study area at the foot of Gunung Mulu. Low temperature preferences can be expected in species that live at higher altitudes. Indeed, two species with low temperature preferences, Technomyrmex modiglianii and Pheidole upeneci, only have been collected at the two sites with the highest altitudes. Both species may have their main distribution at higher elevations; P. upeneci is known to inhabit hill dipterocarp forests (Eguchi Reference EGUCHI2001), whereas T. modiglianii has been reported in both low-lying and hilly areas (Bolton Reference BOLTON2007). Lophomyrmex bedoti, with 20.1 °C, preferred a low temperature, which might be an adaptation to distribution along a very wide altitudinal range, since apart from the lowland in Gunung Mulu National Park this species has also been recorded at Gunung Kinabalu from the lowlands to altitudes of up to 1520 m (Malsch et al. Reference MALSCH, FIALA, MASCHWITZ, MOHAMED, NAIS and LINSENMAIR2008). The two Leptogenys species that chose low temperatures might have their peak activity at night, as is known from many other species within this genus that are nocturnal raiders (Maschwitz et al. Reference MASCHWITZ, STEGHAUS-KOVAC, GAUBE and HÄNEL1989).
On the other hand, some of the species that prefer higher temperatures might be restricted to lowland forests. Both species of Acanthomyrmex prefer high temperatures; this genus is classified as being a group of tropical climate specialists by Andersen (Reference ANDERSEN1997) and has been found at Mount Kinabalu only in forests below 850 m (Malsch et al. Reference MALSCH, FIALA, MASCHWITZ, MOHAMED, NAIS and LINSENMAIR2008). The four Pheidole species with the highest temperature preferences (P. cariniceps, P. quadrensis, P. rugifera and P. sauberi) have been reported from lowland forests and were absent from forests at higher elevations (Eguchi Reference EGUCHI2001).
Temperature preferences of species assemblages
Herbers (Reference HERBERS1988) found that in North American deciduous forests the availability of nesting places like suitable dead wood was an important factor for the ant communities: highly competitive colonies occupied the best nesting places in the soil, while less-strong colonies had to choose suboptimal places on the surface. We found in alluvial, limestone and dipterocarp forest comparable conditions. In these forest types, the ant density was high, both in species and in individuals, so there might be tight competition for nesting places. This assumption is strongly supported by the results of the simulations, which indicated for three forest types a significant aggregation of the temperature niches. So in these habitats ant colonies seem to compete heavily for those nesting places with the most suitable temperatures. Under these conditions, less strong ant colonies may be forced to choose nesting places with suboptimal thermal conditions, this leading to suboptimal breeding results and thus to a further reduction of the colony.
In our study the ant community of the kerangas showed the only significant niche separation. This forest type harboured the lowest numbers of ant species and individuals. The kerangas forest was characterized by a deep layer of peat-containing topsoil which was quite wet due to poor drainage (Proctor et al. Reference PROCTOR, ANDERSEN, CHAI and VALLACK1983). These ecological conditions might be too harsh for most ant species, so only a few species closely adapted to this environment could survive there (Mezger & Pfeiffer, unpubl. data).
Because of the lower colony density in this habitat, each colony has a better chance to choose among the many potential nesting places one with the most suitable temperature.
At the level of single ant species, no relationship was apparent between the temperature preferences of ant colonies from the different forest types. Since all of the forests lie in close proximity to each other, it is unlikely that ant species have been able to develop several ecotypes adapted to special forest types. However, preferred temperatures of ant assemblages correlated significantly with the temperature of the forest types in which they had been collected. Ground vegetation cover seemed to be a more important factor in structuring ant communities than canopy openness, because species with a low temperature preference were found on sites covered with extensive vegetation while species that preferred higher temperatures were present on sites with low ground vegetation cover. On this point, further studies should focus on small-scale patterns of temperature and vegetation cover directly around the nesting place. Extreme temperatures in a certain habitat can be more important than mean temperature, since extreme temperatures might exclude certain species altogether (Hartley et al. Reference HARTLEY, HARRIS and LESTER2006). The minimum temperature in the dipterocarp forest was only 19 °C, and this might exclude some thermophile species from this forest habitat. The higher percentage of stenothermal species at the more elevated sites in the dipterocarp forest might point towards an increased sensitivity of species inhabiting mountains to climate change.
The temperature niche
We have demonstrated that temperature is an important abiotic factor for ants in tropical forests, especially under low-density conditions. Pheidole as a hyper-diverse genus shows a broad range of temperature preferences with significant differences between species, even if the niche differentiation tested with a null model study was not significant. However, as we found by stable isotope analysis, several Pheidole species differ little in their trophic position, and food-choice experiments have revealed that these species choose almost the same mixed diet of dead insects and seeds (Mezger & Pfeiffer, unpubl. data). We showed that preferred temperature of several Pheidole species differed significantly; however, we were unable to demonstrate significant community-wide niche partitioning of species. This result indicates that species temperature preferences may have been overridden by their differing competitive abilities, which have higher impact on the structuring of communities, most notably in highly diverse ant assemblages.
Climate change with rising temperatures will certainly have a high impact on ant communities, as our study suggests that many species are adapted to particular temperatures. As ants act as ecosystem engineers, and some species may even be considered as keystone species (Vasconcelos Reference VASCONCELOS1999), a change in their community structure will not only have an impact on themselves (Tillberg et al. Reference TILLBERG, HOLWAY, LEBRUN and SUAREZ2007), but will also have a large effect on plant and animal communities (Zelikova & Breed Reference ZELIKOVA and BREED2008). Further research concerning niche separation along a thermal gradient on ants and other animals worldwide will be necessary in order to forecast, and perhaps to manage or mitigate these effects of global climate change. In particular, such studies should include those ant species restricted to higher elevations on tropical mountains (Thomas et al. Reference THOMAS, FRANCO and HILL2006), since such species might be most endangered by climate change.
ACKNOWLEDGEMENTS
We are grateful to the Sarawak Forestry Department for granting research permission and providing helpful contacts. We thank Brian Clark and his staff at Gunung Mulu National Park for their kind cooperation, Angelika Graiff, Manuela Parchem, Johannes Renninger and Janine Quaas for their assistance with experiments and observations, Barry Bolton for the identification of the Tetramorium species, and Elisabeth Kalko for her constant support in various aspects of this study. Theresa Jones and Brian Hillcoat are acknowledged for language correction. We thank three anonymous reviewers for their comments on an earlier version which improved the manuscript significantly. This study was partly funded by DFG grants to M.P. (Project PF 441/3–1 and PF 441/3–3) and two of our students were supported by DAAD travelling allowances and short-term scholarships.
Vegetation and temperature characteristics of the studied forest types, with ground vegetation cover (vegetation points, VP), canopy openness (%) per 1-m2 plot of the four forest types (mean ± SD), and mean elevation above sea level. Sample size for vegetation points and canopy openness: (nalluvial = 30; nlimestone = 30; nkerangas = 18; ndipterocarp = 20. Mean values of soil and air temperatures above leaf litter and minimum and maximum extreme temperatures. Sample size for soil temperature: nalluvial = 1; nlimestone = 5; nkerangas = 11; ndipterocarp = 3 and for air temperature nalluvial = 1; nlimestone = 3; nkerangas = 2; ndipterocarp = 2.

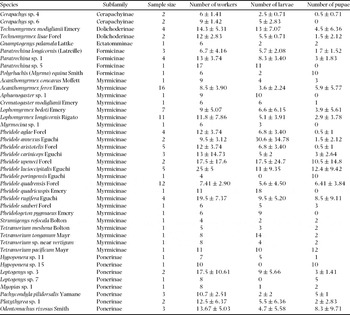
Sample size, number (mean ± SD) of worker ants, larvae and pupae of each species used in the experiments.