Introduction
Chronic fatigue syndrome (CFS) is a chronic disabling condition with an estimated population prevalence of 0.2–0.4% (National Institute for Health and Clinical Excellence, 2007). Opinions differ as to whether myalgic encephalomyelitis (ME) and CFS are the same condition (Prins et al. Reference Prins, van der Meer and Bleijenberg2006). In the absence of reliable biomarkers or clinical signs, diagnosis is based upon self-reported symptoms and the exclusion of alternative explanatory diagnoses. Several case definitions are commonly used for research (Sharpe et al. Reference Sharpe, Archard, Banatvala, Borysiewicz, Clare, David, Edwards, Hawton, Lambert and Lane1991; Fukuda et al. Reference Fukuda, Straus, Hickie, Sharpe, Dobbins and Komaroff1994; The National Task Force on Chronic Fatigue Syndrome, 1994), although of the 20 published to date, all assessments of reproducibility and validation are limited by the absence of a ‘gold standard’ (Brurberg et al. Reference Brurberg, Fønhus, Larun, Flottorp and Malterud2014).
The reliance upon self-reported symptoms has led to doubts about the validity of CFS as an aetiologically homogeneous diagnosis (Wakefield, Reference Wakefield2013; Komaroff, Reference Komaroff2015). As such, the last 20 years have seen much research examining the potential heterogeneity of CFS, with multiple attempts to empirically define cases and subgroups.
Initial work by Hickie and colleagues used symptoms and demographics to empirically define a core group and a smaller polysymptomatic subgroup (Hickie et al. Reference Hickie, Lloyd, Hadzi-Pavlovic, Parker, Bird and Wakefield1995; Wilson et al. Reference Wilson, Hickie, Hadzi-Pavlovic, Wakefield, Parker, Straus, Dale, McCluskey, Hinds, Brickman, Goldenberg, Demitrack, Blakely, Wessely, Sharpe and Lloyd2001). Further studies have suggested empirical subgroups of CFS resembling fibromyalgia (FM) (Hadzi-Pavlovic et al. Reference Hadzi-Pavlovic, Hickie, Wilson, Davenport, Lloyd and Wakefield2000), whilst others found that CFS and FM could not be empirically distinguished (Sullivan et al. Reference Sullivan, Smith and Buchwald2002).
The inclusion of biological variables in studies suggests these may also be important in defining illness subgroups. These include: body mass index (BMI); sleep-disordered breathing and insomnia; sympathetic nervous system activity; and endocrine features of metabolic strain (Vollmer-Conna et al. Reference Vollmer-Conna, Aslakson and White2006; Aslakson et al. Reference Aslakson, Vollmer-Conna, William and White2009). When such biological variables were combined with the variables of many symptoms and depression, they could empirically identify validated subgroups of CFS cases and separate them from well controls (Aslakson et al. Reference Aslakson, Vollmer-Conna and White2006).
The PACE trial (White et al. Reference White, Goldsmith, Johnson, Potts, Walwyn, DeCesare, Baber, Burgess, Clark, Cox, Bavinton, Angus, Murphy, Murphy, O'Dowd, Wilks, McCrone, Chalder and Sharpe2011) found that both cognitive–behaviour therapy (CBT) and graded exercise therapy (GET) improved both fatigue and physical function over 1 year when compared with standardized medical therapy alone. This study aimed to use the large database from the PACE trial baseline assessment to explore the heterogeneity of CFS, using not only self-reported measures of beliefs, behaviours, mood and co-morbidities, but also objective measures of activity, sleep and fitness.
Method
Data collection
Methods of participant recruitment and data collection for the trial have been described elsewhere (White et al. Reference White, Sharpe, Chalder, DeCesare and Walwyn2007, Reference White, Goldsmith, Johnson, Potts, Walwyn, DeCesare, Baber, Burgess, Clark, Cox, Bavinton, Angus, Murphy, Murphy, O'Dowd, Wilks, McCrone, Chalder and Sharpe2011). Briefly, 3158 new patients attending specialist CFS services at six centres in the UK were assessed for suitability. CFS was defined using the Oxford criteria (Sharpe et al. Reference Sharpe, Archard, Banatvala, Borysiewicz, Clare, David, Edwards, Hawton, Lambert and Lane1991), requiring disabling fatigue to be the primary complaint, with exclusion of alternative medical or psychiatric diagnoses. A total of 640 patients were recruited and gave informed consent to participate. Participants were subsequently randomly allocated to adaptive pacing therapy, CBT or GET as supplements to specialist medical care, or to specialist medical care alone.
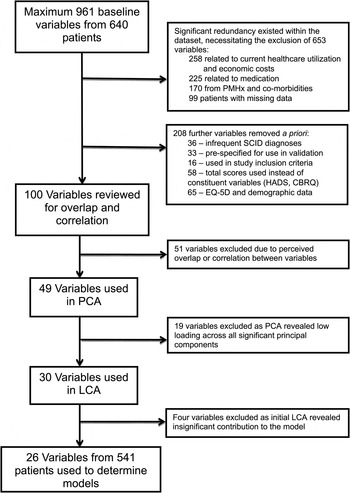
Only baseline data were used for this study. The data included a maximum dataset of 961 original or derived variables for each participant (see Table A1 in the Appendix for data sources), though the actual number of data points for each patient was far fewer than this. The participant with the most data determined the number of variables within each category; hence, for example, medications were listed from ‘medication 1’ to ‘medication 25’, since at least one participant was taking 25 medications. As separate variables documented dosage, frequency, duration, etc., of treatment, there were a total of 225 variables related to medication, most of which would not actually contain any data for any individual patient. Similar variable multiplication applied to healthcare utilization, previous medical history and co-morbidities. In accordance with previous literature, variable reduction was initially undertaken rationally, based upon previous research, clinical experience and logic (Fig. 1). For example, data on medication use were excluded in order to avoid defining subgroups by their treatment (Aslakson et al. Reference Aslakson, Vollmer-Conna and White2006), as were healthcare utilization data as these were felt to be influenced by many unrelated variables, such as availability of healthcare, geographical location and previous personal experiences of healthcare.
Summary of variable reduction. Variable reduction was initially undertaken in accordance with clinical knowledge and previous literature. Correlation matrices were then used to remove overlap. Principal component analysis (PCA) then identified variables minimally contributing to the overall variance, and four further variables were removed during latent component analysis (LCA) due to a lack of statistical contribution to the derived models. PMHx, Past medical history; SCID, Standardized Clinical Interview for DSM-IV; HADS, Hospital Anxiety and Depression Scale; CBRQ, Cognitive Behavioural Responses Questionnaire; EQ-5D, EuroQoL five items.

Despite the large number of variables attributed to previous medical history and co-morbidities, the majority of individual diagnoses, if present, were rare within the cohort. When present as co-morbid conditions, they were invariably also reported in past medical history, and the few more common co-morbidities displayed considerable overlap with other variables [e.g. mood or anxiety disorders covered in Structured Clinical Interview for DSM-IV (SCID) diagnoses, FM diagnoses overlapping with responses to questions on joint, muscle or back pain]. The resulting multicollinearity within the dataset prevented principal component analysis (PCA), and infrequent diagnoses could contribute little to the overall variability of the dataset. All items from past medical history were therefore removed, as were co-morbidities that we thought were better represented elsewhere within the data. Infrequent or absent SCID diagnostic variables were removed due to the same rationale. Many other variables were then removed, since they constituted single items from scales where we considered that the summary scale scores or subscale summary scores would be more useful [e.g. Hospital Anxiety and Depression Scale (HADS), Cognitive Behavioural Responses Questionnaire (CBRQ)], or because we felt the variables were either unlikely to relate to subgroups of CFS, or represented outcomes of the condition, rather than causal factors (e.g. EuroQOL five items; EQ-5D, further economic and demographic data).
Substantial overlap also existed between many of the remaining questionnaires employed. The exclusion of overlapping variables is important in order to prevent such predictable correlations from producing artificial classes during latent class analysis (LCA): for example, Centers for Disease Control (CDC) CFS criteria question 7 ‘Unrefreshing sleep’ v. Jenkins Sleep Scale question 4 ‘Wake up after your usual amount of sleep feeling tired or worn out?’. Similarly, some data were represented in multiple variables, such as the derived daytime activity subgroups and mean daytime activity. In both cases, correlation matrices were utilized to assist in the identification of such overlaps, and a decision was made on which variable to retain based upon which was believed to be the most clinically useful or significant. The removal of correlated pairs was again also necessary to reduce the multicollinearity of the dataset, a requirement for PCA.
PCA
PCA was employed to assist our decisions on variable reduction, as in previous studies (Hickie et al. Reference Hickie, Lloyd, Hadzi-Pavlovic, Parker, Bird and Wakefield1995; Vollmer-Conna et al. Reference Vollmer-Conna, Aslakson and White2006; Aslakson et al. Reference Aslakson, Vollmer-Conna, William and White2009). Patients with missing data were excluded from the analysis, and non-binary variables for the remaining 541 patients were then dichotomized via median split to produce a binary categorical dataset. PCA was then performed, using SPSS version 22, on the orthogonally rotated correlation coefficient matrix of variables. PCA describes the total variability of a dataset whilst reducing it into a number of independent principal components. Each principal component was created by the weighted sum of multiple correlated individual variables. The first PCA described the maximum variability of the dataset. Each subsequent analysis did the same for the remainder of the variance, whilst remaining uncorrelated with all preceding principal components. Each component was typically defined by a few highly loaded variables, followed by many other variables with low loading values and hence minimal contribution. The utility of the technique is in identifying variables that achieve only very low loading across all identified principal components. Such variables were therefore removed from the dataset with minimal loss of the overall variance. By using PCA we were able to reduce substantially the number of variables needed in the subsequent LCA.
LCA
In contrast to PCA, where the weighted variables are allocated to principal components, we used LCA (Latent Gold v5.0) to allocate each individual patient to a latent class. This was achieved based upon their responses to the variables included in the analysis, which are described in detail in Appendix Table A2. The assumption was that where there was an association between the responses of different patients to such observed variables, this was due to shared membership of an unobserved latent class. Class membership was then assigned to each patient in order to maximize the amount of variation of the dataset explained by class membership alone. The number of latent classes to be derived was specified prior to each analysis. In order to determine the optimum number of classes, the analysis was therefore repeated multiple times, each time requesting a higher number of classes. The derived models were then compared using statistical indices, together with an assessment of their perceived clinical utility. In keeping with previous work (Vollmer-Conna et al. Reference Vollmer-Conna, Aslakson and White2006; Aslakson et al. Reference Aslakson, Vollmer-Conna, William and White2009), we used the Akaike information criterion (with 3 as a penalizing factor) (AIC3) to determine the optimum number of classes; lower AIC3 values indicated a better fit.
Validation of latent classes
In the absence of a ‘gold standard’ for comparison, initial assessments of validity included comparisons with previous heterogeneity studies. Additionally, we sought to demonstrate discriminative validity of the empirically derived subgroups by comparing them across pre-specified measures of functional and symptomatic severity, not included in either the PCA or LCA. These variables were chosen a priori, in keeping with the assessments of validity successfully utilized in previous studies (Aslakson et al. Reference Aslakson, Vollmer-Conna and White2006, Reference Aslakson, Vollmer-Conna, William and White2009). The Chalder Fatigue Questionnaire (Chalder et al. Reference Chalder, Berelowitz, Pawlikowska, Watts, Wessely, Wright and Wallace1993), Likert scoring, the Work and Social Adjustment Scale (WSAS) and the 36-item Short Form Health Survey, physical function subscale (SF-36) were compared across subgroups using the Kruskal–Wallis test (Ware & Sherbourne, Reference Ware and Sherbourne1992; Mundt et al. Reference Mundt, Marks, Shear and Greist2002; Cella et al. Reference Cella, Sharpe and Chalder2011b ). The SF-36 provides a measure of physical function, whilst the WSAS captures a more global measure of impairment or participation in life. In addition, we explored the relationship of our empirically derived subgroups with CDC and London criteria for CFS and ME, respectively (The National Task Force on Chronic Fatigue Syndrome, 1994; Reeves et al. Reference Reeves, Lloyd, Vernon, Klimas, Jason, Bleijenberg, Evengard, White, Nisenbaum and Unger2003) as well as age, sex and illness duration, using χ2 tests.
Ethical standards
The PACE trial was approved by the West Midlands Multicentre Research Ethics Committee; reference number MREC 02/7/89; ISRCTN 54285094.
Results
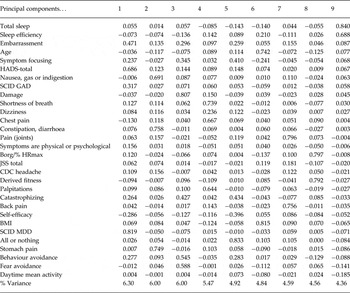
Following our initial review of the dataset, 100 variables were chosen for analysis; 51 were removed as they represented correlations and overlaps (Fig. 1), leaving 49 binary, categorical variables in the PCA. Scree plots were used to determine the number of principal components to analyse based upon the point of inflection. PCA was used iteratively, repeatedly removing low-loading variables and re-running the analysis until a final dataset of 30 variables was achieved, each of which contributed substantially to the overall variance of the dataset (Table 1; see Table A2 in the Appendix for explanation of these variables).
Principal component analysis: final rotated component matrix displaying the nine principal components and the loading of the 30 variables taken forward for use in the latent class analysis

HADS, Hospital Anxiety and Depression Scale; SCID, Structured Clinical Interview for DSM-IV; GAD, generalized anxiety disorder; Borg/%HRmax, Borg Rating of Perceived Exertion divided by percentage of maximum heart rate achieved; JSS, Jenkins Sleep Scale; CDC, Centers for Disease Control criteria for chronic fatigue syndrome; BMI, body mass index; MDD, major depressive disorder.
Initial LCA modelling revealed that four of the 30 variables [mean total sleep time, age, Borg Scale/% of maximum heart rate achieved (following step test), and BMI] were contributing insignificantly to the analysis, and these were removed (Fig. 1). Models were therefore derived using 26 variables. The minimum AIC3 value was reached for the six-class solution, but was only marginally higher for five classes (16 372 and 16 376, respectively). Both were therefore evaluated for perceived clinical utility.
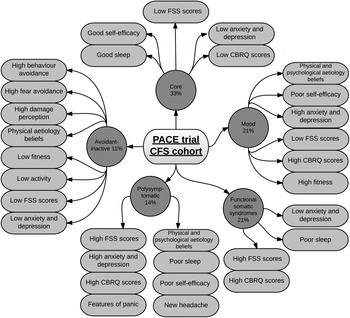
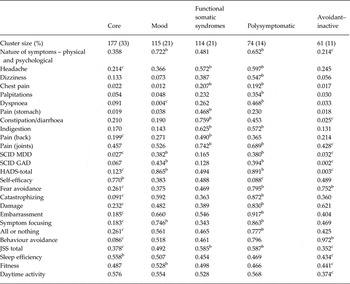
The five-class solution is shown in Table 2 and Fig. 2. The largest subgroup (‘core’, 33%) was determined by less severe scores across the majority of the variables, with an added association with good self-efficacy. This class had an absence of the features associated with functional somatic syndromes (FSS), which we define here as including the features of irritable bowel syndrome (IBS – stomach pain, constipation/diarrhoea, indigestion) or the features of FM (back pain, joint pain). There were also low scores for anxiety and depression. The quality of sleep was both subjectively and objectively good, with high daytime activity and low scores on the CBRQ.
Subgroups – five-class solution. Diagrammatic representation of the five-class solution, highlighting the key features used to identify each subgroup. FSS, Functional somatic syndromes; CBRQ, Cognitive Behavioural Responses Questionnaire; CFS, chronic fatigue syndrome.

Latent class analysis profile for five-class solutiona

SCID, Structured Clinical Interview for DSM-IV; MDD, major depressive disorder; GAD, generalized anxiety disorder; HADS, Hospital Anxiety and Depression Scale; JSS, Jenkins Sleep Scale.
a Values represent the conditional probabilities of each class responding positively to the conditional variable.
b Values greater than mean plus 0.8 × s.d.
c Values less than mean minus 0.8 × s.d.
The second largest group (‘mood affected’, 21%), was defined by low to moderate scores on features of FSS, but very high scores on co-morbid major depressive disorder (MDD), co-morbid generalized anxiety disorder (GAD) and total HADS scores. CBRQ scores were moderate to high, particularly embarrassment and symptom focusing, and self-efficacy scores were moderate to low. Interestingly, the majority of patients in this class believed their symptoms to be the results of both physical and psychological factors (as opposed to purely or predominantly physical), and they had the highest levels of fitness.
The third group (‘FSS’, 21%), in contrast, had the highest scores across features of FSS, whilst MDD, GAD and HADS-total were low to moderate. Sleep was subjectively poor with low sleep efficiency, and CBRQ scores were moderately elevated.
The fourth group (‘polysymptomatic’, 14%), had high scores on both features of FSS and mood. Physical symptoms of panic disorder, such as chest pain, palpitations and dyspnoea were also high, with a high proportion reporting new headache and dizziness. They had the highest responses to the CBRQ, very low self-efficacy, and largely believed their symptoms to be both physical and psychological in nature. Sleep was subjectively and objectively poor.
The smallest group (‘avoidant–inactive’, 11%), as for the core group, had low scores on features associated with FSS, anxiety and depression. In contrast, however, they had higher scores on the CBRQ, particularly for behaviour avoidance, fear avoidance and damage beliefs. In keeping with this, they were the most likely to believe their symptoms were physical in nature. Their sleep efficiency was low despite subjectively good-quality sleep, and they had poor fitness and low daytime activity.
The six-class solution (data not shown) produced broadly similar groups. The mood group, however, was split into two. The larger division (18%) had low scores for symptoms of panic disorder, moderate CBRQ scores and high sleep efficiency. The smaller division (12%) had moderate features of panic disorder, high CBRQ scores, low sleep efficiency and higher daytime activity.
We concluded that the subgroups of the five-class solution were most clinically useful, and hence this solution was taken forward for validation.
Validation
The initial inspection of the subgroups led to the consensus that they were consistent with the existing literature on CFS, particularly our ‘core’, ‘polysymptomatic’ and ‘mood’ subgroups described previously.
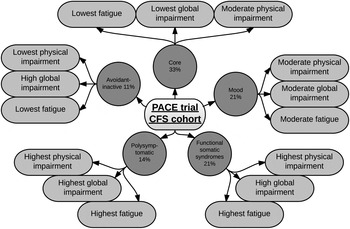
Comparison across the pre-specified measures of severity for the five-class solution is shown in Table 3 and summarized in Fig. 3. The differences were highly significant across the subgroups on all validating variables, providing support for discriminative validity. The polysymptomatic and FSS groups had the most fatigue, and the polysymptomatic group also reported the most severe functional impairment on both the WSAS and SF-36. Such functional impairment was matched by the FSS group when assessed by SF-36, though this was less severe on the WSAS. The core and avoidant–inactive groups demonstrated the least fatigue and the least functional impairment, although this differed between the SF-36 and WSAS: the core group had the least severe WSAS score, and avoidant–inactive the least severe SF-36.
Subgroups – validation of the five-class solution. Diagrammatic representation of the statistically significant comparisons used to provide support for discriminative validity. CFS, Chronic fatigue syndrome.

Validation of five-class solution

Data are given as median (quartiles) for each class.
CFQ, Chalder Fatigue Questionnaire, Likert scoring; SF-36, 36-item Short Form Health Survey, physical function subscale; WSAS, Work and Social Adjustment Scale.
a p Values were derived from the Kruskal–Wallis test of overall comparison across classes.
b Higher CFQ scores indicated greater fatigue; lower SF-36 scores and higher WSAS scores indicate greater functional impairment.
Further validation was undertaken comparing the groups using age, sex, illness duration and whether they met the CDC or London criteria for CFS (The National Task Force on Chronic Fatigue Syndrome, 1994; Reeves et al. Reference Reeves, Lloyd, Vernon, Klimas, Jason, Bleijenberg, Evengard, White, Nisenbaum and Unger2003) (Table 4).
Post-hoc comparison of CFS/ME criteria and sex between subgroups of the five-class solutiona

Data are given as percentage, rounded to the nearest integer.
CFS, Chronic fatigue syndrome; ME, myalgic encephalomyelitis; FSS, functional somatic syndrome; London ME, London criteria for ME; CDC, Centers for Disease Control criteria for CFS.
a Post-hoc comparisons between alternative CFS/ME criteria and patient sex were made with the subgroups of the five-class solution using cross-tabulation.
b p Values were determined via χ2 statistics.
Of the patients, 62% met the CDC criteria for CFS, but differences across subgroups were not statistically significant (p = 0.12). In contrast, 53% of all patients met the London criteria for ME, and differences across subgroups could not be explained by chance alone (p < 0.001). This relationship, however, appeared to be driven by the low proportion of patients in the mood and polysymptomatic groups. This was to be expected, given that the high levels of co-morbid anxiety and depression that characterized these subgroups would, by definition, result in exclusion from the London criteria (White et al. Reference White, Sharpe, Chalder, DeCesare and Walwyn2007).
There was a significant difference between subgroups for sex (p = 0.014), with the FSS group, and to a lesser extent avoidant–inactive, having a relatively greater proportion of women. Age and illness duration did not differ across subgroups (data not shown).
Discussion
Summary of classes and validation
This analysis provides further support for the heterogeneous nature of CFS in a large cohort of patients recruited from UK secondary care clinics. Five separate subgroups of CFS were defined based upon a combination of statistical likelihood and perceived clinical utility. The groups were predominantly defined by features of associated FSS, mood, self-efficacy ratings, cognitive–behavioural responses questionnaire scores and assessments of sleep. These groups had face validity and were consistent with previous publications. As in previous studies (Aslakson et al. Reference Aslakson, Vollmer-Conna and White2006, Reference Aslakson, Vollmer-Conna, William and White2009), discriminative validity was demonstrated by showing significant differences across the classes in the independent, a priori measures of fatigue and disability. The polysymptomatic and FSS group had the greatest levels of fatigue and functional impairment, whilst both the mood and polysymptomatic groups tended to regard their symptoms as both physical and psychological in nature.
Comment on validation
Given the features used to define the polysymptomatic group, it is no surprise that they reported the greatest levels of fatigue and functional impairment. It is also logical that the FSS group, which suffered from the highest levels of back, joint and stomach pain, had a similarly high level of disability when assessed by the SF-36, which measures physical impairment.
In contrast, the avoidant–inactive group had the lowest impairment on the SF-36 physical function scale, but greater impairment on the WSAS. This may relate to the more global measure of impairment or participation in life captured by the WSAS. The avoidant–inactive group commonly reported features of behavioural avoidance, fear avoidance and concerns regarding the potential damaging effects of activity, which may therefore result in greater impairment of their ability to work, socialize and maintain relationships (represented by the WSAS), despite relatively preserved physical functioning (represented by the SF-36).
Comparison with previous studies
Despite the unique combination of variables used to define our groups, comparisons can be drawn with previously published studies of the heterogeneity of CFS. In particular, our polysymptomatic and FSS subgroups show similarities to those defined previously. Hickie and colleagues found in multiple cohorts the presence of a polysymptomatic subgroup of CFS patients (Hickie et al. Reference Hickie, Lloyd, Hadzi-Pavlovic, Parker, Bird and Wakefield1995; Wilson et al. Reference Wilson, Hickie, Hadzi-Pavlovic, Wakefield, Parker, Straus, Dale, McCluskey, Hinds, Brickman, Goldenberg, Demitrack, Blakely, Wessely, Sharpe and Lloyd2001). The authors concluded that this subgroup was related to ‘somatization’ (a tendency to report multiple symptoms that were not related to established disease), and found in post-hoc comparisons that such patients had higher levels of psychiatric co-morbidity. This is consistent with our results. In further work an additional pain-predominant subgroup was identified in addition to the polysymptomatic and core groups (Hadzi-Pavlovic et al. Reference Hadzi-Pavlovic, Hickie, Wilson, Davenport, Lloyd and Wakefield2000), which may be more resistant to conventional treatments such as CBT (Cella et al. Reference Cella, Chalder and White2011a ). Subgroups defined by many symptoms and pain-predominance were also key features of a recent, large study including 8433 CFS patients from UK and Dutch specialist centres (Collin et al. Reference Collin, Nikolaus, Heron, Knoop, White and Crawley2016).
More recent work has focused on population-derived samples with increasing use of biological parameters. As such samples included patients with CFS (CDC criteria), uncategorized chronic fatigue and unfatigued controls, as well as different variables, the extent of available comparison is limited.
Vollmer-Conna et al. (Reference Vollmer-Conna, Aslakson and White2006) defined five classes in an American population-derived cohort, based upon the key features of obesity, sleep disturbance, metabolic strain, multiplicity of symptoms and depressed mood. In contrast to this, we did not find that BMI contributed to the subgroup model. It should be noted, however, that the BMI of our cohort was substantially lower than that of Vollmer-Conna's study (median BMI 24.7 v. 29 kg/m2, respectively), that BMI may vary significantly between nations, and that the authors of the American study concluded that this raised BMI is likely to be contributing to the fatigue and relative sleep hypnoea identified in their sample. Despite such differences, however, Vollmer-Conna's description of two highly symptomatic and depressed groups, which was replicated in a separate American cohort (Aslakson et al. Reference Aslakson, Vollmer-Conna, William and White2009), is reminiscent of the subgroups previously described and demonstrated again in this study.
There is support for the role of sleep in defining CFS subgroups, as identified by Vollmer-Conna et al. (Reference Vollmer-Conna, Aslakson and White2006) and again found in this study. In a sample of 343 CFS patients, polysomnography identified 30% with a primary sleep disorder that could explain their fatigue, and the remaining patients could be grouped in four polysomnography subtypes (Gotts et al. Reference Gotts, Deary, Newton, Van der Dussen, De Roy and Ellis2013). As we have found, sleep efficiency varied between these subgroups, together with aspects of total sleep and sleep stage duration.
Our finding of a separate mood disorder group is in keeping with the well-recognized role that mood disorders play in CFS (Wessely et al. Reference Wessely, Chalder, Hirsch, Wallace and Wright1996; Harvey et al. Reference Harvey, Wessely, Kuh and Hotopf2009). Previous studies using LCA have found that depression was an important contributing factor in their models (Aslakson et al. Reference Aslakson, Vollmer-Conna and White2006, Reference Aslakson, Vollmer-Conna, William and White2009). Similarly, it has been recognized that CFS, FM and IBS, which have been collectively referred to as FSS, often cluster together (Aaron & Buchwald, Reference Aaron and Buchwald2001; McBeth et al. Reference McBeth, Tomenson, Chew-Graham, MacFarlane, Jackson, Littlewood and Creed2015). It has been suggested that this may be due to shared predisposing factors, perhaps relating to mechanisms of chronic central nervous system sensitization (Kato et al. Reference Kato, Sullivan, Evengård and Pedersen2009; Bourke et al. Reference Bourke, Langford and White2015) or co-morbid mood disorders (McBeth et al. Reference McBeth, Tomenson, Chew-Graham, MacFarlane, Jackson, Littlewood and Creed2015), which, together with anxiety disorders, are common in patients with FSS (Janssens et al. Reference Janssens, Zijlema, Joustra and Rosmalen2015). Taken together, the delineation of a group characterized by predominant FSS features, a group with predominant mood features, and a polysymptomatic group with features of both is attractive in its simplicity, and could have clinical utility.
Critique
Strengths
The size and quality of the PACE trial database provide a number of strengths. The 640 patients were carefully screened to ensure accuracy of diagnosis, allowing 541 patients with complete datasets to be analysed. This large sample from six CFS clinics is representative of the CFS population attending secondary care facilities around the UK. The range of baseline variables incorporated into the analysis provided detailed characterization of this group, including measures of fitness, daytime activity, sleep quality, and illness beliefs and coping which have not previously been included in CFS heterogeneity studies.
Limitations
As with all trial samples, it is possible that systematic differences existed between the trial sample and the UK CFS population, limiting the external validity of our results. The use of the broad and widely used Oxford criteria (Sharpe et al. Reference Sharpe, Archard, Banatvala, Borysiewicz, Clare, David, Edwards, Hawton, Lambert and Lane1991) and the inclusion of Action for ME representatives on the trial management committee (with the resulting addition of the adaptive pacing therapy arm) may have aided recruitment of a representative patient cohort. The participants, who were still selected from secondary care facilities, had to be able to attend research and treatment sessions (and so were generally ambulant), and may be inherently more motivated to partake in treatment therapies than non-trial participants. The extent to which the results may be generalized to primary care patients, the severely disabled and patients with poor motivation to engage in therapies may therefore be limited.
Whilst we describe our subgroups as empirically derived, we acknowledge that the subgroups identified will be limited by the variables selected for inclusion, and that the majority of the decisions relating to variable reduction were undertaken post-hoc. A large number of redundant variables, such as 25 separate variables for different medications, were removed as they rarely contained patient data (most patients were taking far fewer than 25 medicines). Reference to published literature and clinical experience shaped further decisions to omit variables, aimed at maximizing retention of what we perceived to be clinically useful data whilst removing the substantial overlap between many other variables. Whilst such decisions are liable to a selection bias, the use of PCA as a variable reduction tool once an initial list of plausible variables was compiled should have minimized this.
Similarly a post-hoc decision was made when choosing the number of classes to include in the final latent class model. By using a combination of statistical indices and clinical experience, as in previous literature, however, we have been able to derive clinically recognizable and subsequently validated subgroups of CFS. Whereas a six-class solution was minimally more statistically plausible, we feel the added complexity would have detracted from its future clinical utility.
We did not include haematological or biochemical data and were unable to investigate the endocrine, metabolic and immunological abnormalities that have previously been reported. We may also have inadvertently excluded other measures that may have revealed different subgroups. Our assessments of sleep using actigraphy may also not be as detailed as the polysomnography that has been used in previous studies (Vollmer-Conna et al. Reference Vollmer-Conna, Aslakson and White2006; Gotts et al. Reference Gotts, Deary, Newton, Van der Dussen, De Roy and Ellis2013). The validity of actigraphy in assessing sleep has, however, been shown to be acceptable (Tryon, Reference Tryon2004). It is also clinically more practical, and has the advantage of being able to capture daytime activity. Clinicians might use alternative measures of activity, such as pedometers or Fitbit in clinical practice.
Conclusion
In conclusion, we have used a large, high-quality dataset of variables from participants in the PACE trial to empirically identify and validate five subgroups of CFS. These provide evidence for the clinical heterogeneity of CFS. We have replicated previous findings of subgroups defined by mood disorders, FSS, and having many symptoms. A novel finding is the avoidant–inactive subgroup. Future work should focus on the aetiology and pathophysiologies of these subgroups, as well as their specific treatment responses. For example, one could hypothesize that the mood disorder subgroup may preferentially benefit from interventions targeted at depression and anxiety, especially given the known increased risk of suicide in patients with CFS (Roberts et al. Reference Roberts, Wessely, Chalder, Chang and Hotopf2016). Similarly, the avoidant–inactive group may particularly benefit from CBT addressing their negative cognitions related to the damaging effects of exercise and subsequent activity avoidance.
Future studies of aetiology and response to treatment could use these subgroups in order to obtain more homogeneous groups. The identification of these subgroups in clinical practice may allow translation of such research into potentially improved treatments.
Supplementary material
The supplementary material for this article can be found at https://doi.org/10.1017/S0033291716003615
Acknowledgements
We acknowledge the help of the PACE Trial Management Group, which consisted of the authors of this paper, excluding T.E.W., plus (in alphabetical order): B Angus, H Baber, J Bavinton, M Burgess, LV Clark, DL Cox, JC DeCesare, E Feldman, P McCrone, G Murphy, M Murphy, H O'Dowd, T Peto, L Potts, R Walwyn and D Wilks.
Funding for the PACE trial was provided by the Medical Research Council, Department of Health (England), the Department for Work and Pensions, and the Chief Scientist Office (NHS Scotland).
Declaration of Interest
P.D.W. is an appointed member of the Independent Medical Experts Group, which advises the UK Ministry of Defence regarding the Armed Forces Compensation Scheme. He has done voluntary consultancy work for the UK government and paid consultancy work for a reinsurance company. T.C. has received royalties from Sheldon Press and Constable and Robinson. M.S. has received royalties from Oxford University Press.