Introduction
Age-related macular degeneration (AMD) is the main cause of visual impairment in the elderly population of industrialized countries (Vingerling et al., Reference Vingerling, Dielemans, Hofman, Grobbee, Hijmering, Kramer and de Jong1995; Klein et al., Reference Klein, Klein, Jensen and Meuer1997; Friedman et al., Reference Friedman, O’Colmain, Munoz, Tomany, McCarty, de Jong, Nemesure, Mitchell and Kempen2004; Delcourt et al., Reference Delcourt, Lacroux, Carriere and Group2005). AMD affects the macula, the central region of the retina where photoreceptor density is highest. The disease is characterized by a central scotoma and a decrease in visual acuity associated with metamorphopsia (Young, Reference Young1987). These affect all central vision functions, such as reading (Legge et al., Reference Legge, Ross, Isenberg and LaMay1992; Fine & Peli, Reference Fine and Peli1995; Fletcher et al., Reference Fletcher, Schuchard and Watson1999), face recognition (Bullimore et al., Reference Bullimore, Bailey and Wacker1991; Peli et al., Reference Peli, Lee, Trempe and Buzney1994; Tejeria et al., Reference Tejeria, Harper, Artes and Dickinson2002), and processing of facial emotions (Boucart et al., Reference Boucart, Dinon, Despretz, Desmettre, Hladiuk and Oliva2008b ). Visual functions involving the peripheral vision, such as object and scene perception (Boucart et al., Reference Boucart, Despretz, Hladiuk and Desmettre2008a ; Tran et al., Reference Tran, Guyader, Guerin, Despretz and Boucart2011), driving (Rovner & Casten, Reference Rovner and Casten2002), and mobility (Salive et al., Reference Salive, Guralnik, Glynn, Christen, Wallace and Ostfeld1994; Hassan et al., Reference Hassan, Lovie-Kitchin and Woods2002) are also affected. Furthermore, a few studies showed a specific behavioral impairment of AMD patients in processing fine details conveyed by high spatial frequencies (HSFs) in scenes, while the perception of global shapes conveyed by low spatial frequencies (LSFs) was relatively well preserved (Musel et al., Reference Musel, Hera, Chokron, Alleysson, Chiquet, Romanet, Guyader and Peyrin2011; Peyrin et al., Reference Peyrin, Ramanoël, Roux-Sibilon, Chokron and Hera2017).
From a functional point of view, these findings suggest some functional changes in the brain of AMD patients following the retinal damage. Functional adaptation to central vision loss in terms of cerebral changes remains understudied. To date, few fMRI studies have investigated the effects of retinal diseases on the topographic representation of the visual field in the occipital cortex. Given that organization of the visual cortex is retinotopic, retinal lesions caused by AMD induce a lack of stimulation in the visual cortex which is responsible for the processing of the central visual field. The presence of deafferented cortical tissue and the absence of stimulation may result in changes in the organization of the visual cortex (Martins Rosa et al., Reference Martins Rosa, Silva, Ferreira, Murta and Castelo-Branco2013). Several studies on cats, rats, and monkeys have demonstrated recovery of responses in part of the deprived visual cortex after retinal lesions (Kaas et al., Reference Kaas, Krubitzer, Chino, Langston, Polley and Blair1990; Heinen & Skavenski, Reference Heinen and Skavenski1991; Chino et al., Reference Chino, Smith, Kaas, Sasaki and Cheng1995; Botelho et al., Reference Botelho, Ceriatte, Soares, Gattass and Fiorani2014). However, a few studies on macaques have failed to demonstrate any functional recovery following retinal lesions (Murakami et al., Reference Murakami, Komatsu and Kinoshita1997; Horton & Hocking, Reference Horton and Hocking1998; Smirnakis et al., Reference Smirnakis, Brewer, Schmid, Tolias, Schuz, Augath, Inhoffen, Wandell and Logothetis2005). Reports on adult humans have yielded conflicting results, with some research teams reporting an absence of functional reorganization (Sunness et al., Reference Sunness, Liu and Yantis2004; Masuda et al., Reference Masuda, Dumoulin, Nakadomari and Wandell2008; Liu et al., Reference Liu, Cheung, Schuchard, Glielmi, Hu, He and Legge2010) and others reporting its presence (Baker et al., Reference Baker, Peli, Knouf and Kanwisher2005; Cheung & Legge, Reference Cheung and Legge2005; Baker et al., Reference Baker, Dilks, Peli and Kanwisher2008; Schumacher et al., Reference Schumacher, Jacko, Primo, Main, Moloney, Kinzel and Ginn2008; Dilks et al., Reference Dilks, Julian, Peli and Kanwisher2014). For example, Sunness et al. (Reference Sunness, Liu and Yantis2004) investigated retinotopic organization in terms of eccentricity in a single AMD patient using fMRI retinotopic mapping. They found that the cortical areas corresponding to the pericentral scotoma location of the patient were silent, whereas the same areas were activated in a healthy age-matched participant. However, in two AMD patients with extensive bilateral central retina regions, Baker et al. (Reference Baker, Peli, Knouf and Kanwisher2005) found that parts of visual cortex that normally respond only to central visual stimulation were strongly activated by peripheral visual stimulation, while no activation was observed for visual stimulation at the position of the former fovea. Neuroimaging studies also revealed changes in cortical gray matter density consecutive to AMD (Boucard et al., Reference Boucard, Hernowo, Maguire, Jansonius, Roerdink, Hooymans and Cornelissen2009; Burge et al., Reference Burge, Griffis, Nenert, Elkhetali, DeCarlo, ver Hoef, Rosse and Visscher2016; Prins et al., Reference Prins, Plank, Baseler, Gouws, Beer, Morland, Greenlee and Cornelissen2016). Visual field defects caused by long-standing AMD-related retinal pathology are associated with reductions in gray matter density in the posterior part of the occipital cortex, corresponding to the location of foveal representation in the visual cortex.
Overall, these studies mainly examine reorganization of visual field representation in the visual cortex in relation to the central retinal lesion. Very few studies have looked at the relationship between cerebral activity and the residual ability of AMD patients to recognize complex daily visual stimuli such as scene images (Baker et al., Reference Baker, Peli, Knouf and Kanwisher2005; Liu et al., Reference Liu, Cheung, Schuchard, Glielmi, Hu, He and Legge2010). Liu et al. (Reference Liu, Cheung, Schuchard, Glielmi, Hu, He and Legge2010) investigated fMRI brain activation in four AMD patients who viewed scene images in a one-back task and found that the posterior part of the occipital cortex was silent, whereas Baker et al. (Reference Baker, Peli, Knouf and Kanwisher2005) found that this part of the occipital cortex was strongly activated using a similar task. However, the residual abilities of AMD patients to recognize scenes were not directly tested. Furthermore, to our knowledge, no studies have been conducted on the effect of AMD on brain activation within the parahippocampal place area (PPA), a scene-selective brain region. This posterior region of the parahippocampal cortex that responds more strongly to real-world scene images than other meaningful stimuli (object or face images) has been linked to high-order functions during scene perception, such as navigation, spatial layout and scene recognition, navigation, and contextual association (Epstein & Kanwisher, Reference Epstein and Kanwisher1998; Epstein et al., Reference Epstein, Harris, Stanley and Kanwisher1999; Aminoff et al., Reference Aminoff, Gronau and Bar2007).
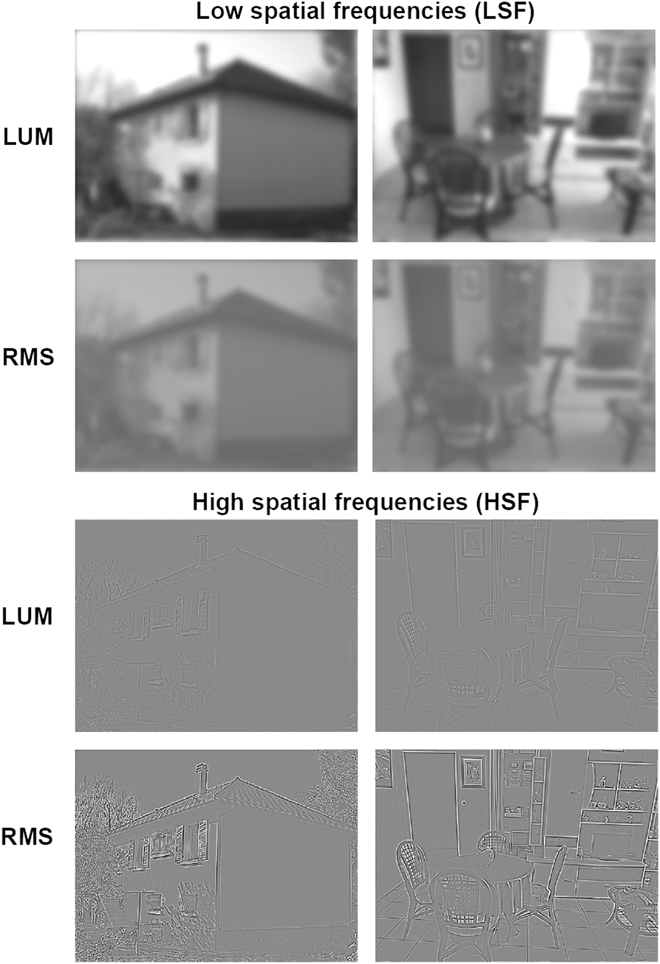
The present fMRI study therefore aimed to investigate the brain activation changes in AMD patients, compared to normally sighted elderly people, during the processing of spatial frequencies in scenes. We mainly investigated activation in the PPA and the posterior parts of the occipital cortex. In addition, given that vision in AMD patients is also affected by contrast reduction in scenes (Tran et al., Reference Tran, Despretz and Boucart2012; Peyrin et al., Reference Peyrin, Ramanoël, Roux-Sibilon, Chokron and Hera2017), we also examined the effects of luminance contrast increase on HSF processing and on cortical activation. AMD patients and controls had to categorize indoor and outdoor scenes filtered in LSF and HSF, and nonfiltered (NF) scenes. The contrast in scenes was either unmodified or equalized using root-mean-square (RMS) contrast normalization. This normalization reduces the contrast in LSF scenes and enhances it in HSF scenes (Fig. 1). The method was identical to that of a previous study designed to investigate the effect of normal aging on spatial frequency processing during scene categorization (Ramanoël et al., Reference Ramanoël, Kauffmann, Cousin, Dojat and Peyrin2015). In normally sighted young people, the density of photoreceptors is greatest in the foveal region of the retina and decreases rapidly with retinal eccentricity (Osterberg, Reference Osterberg1935). In addition, the receptive fields of the photoreceptors and ganglion cells become larger in the perifoveal region of the retina (Curcio et al., Reference Curcio, Sloan, Kalina and Hendrickson1990). Therefore, the sensitivity to HSF gratings is greatest in the fovea and fells rapidly relative to LSF gratings as eccentricity increases. At the level of the occipital cortex, fMRI studies showed a preference for HSF in the foveal representation of retinotopic areas that declines with increasing eccentricity (Sasaki et al., Reference Sasaki, Hadjikhani, Fischl, Liu, Marrett, Dale and Tootell2001; Henriksson et al., Reference Henriksson, Nurminen, Hyvarinen and Vanni2008). Using LSF and HSF scene photographs, Musel et al. (Reference Musel, Bordier, Dojat, Pichat, Chokron, Le Bas and Peyrin2013) showed that the categorization of HSF scenes, compared to LSF scenes, elicited greater activation in posterior parts of the occipital cortex in relation to the foveal representation, whereas the categorization of LSF scenes, compared to HSF, elicited activation in the anterior part of the occipital cortex in relation to the peripheral representation. Beyond the occipital cortex, Rajimehr et al. (Reference Rajimehr, Devaney, Bilenko, Young and Tootell2011) found that PPA responds preferentially to HSF in natural images. Therefore, in patients with AMD patients, we expected a reduction of activity in the posterior parts of the occipital cortex and the PPA for all visual stimuli but especially for HSF scenes. We also expected to observe an increase of activation in these brain regions when the contrast in HSF scenes was increased.
Example of low spatial frequency (LSF; low-pass cutoff of 12 cycles/image) and high spatial frequency (HSF; high-pass cutoff of 71 cycles/image) scenes belonging to the outdoor and indoor categories when luminance contrast of scenes was not modified (LUM condition) and when RMS contrast was normalized (RMS condition). The RMS normalization reduces contrast in LSF scenes and enhances it in HSF scenes. It should be noted that the perception of spatial frequencies could be affected by scene reduction for illustrative purposes.

Materials and methods
Participants
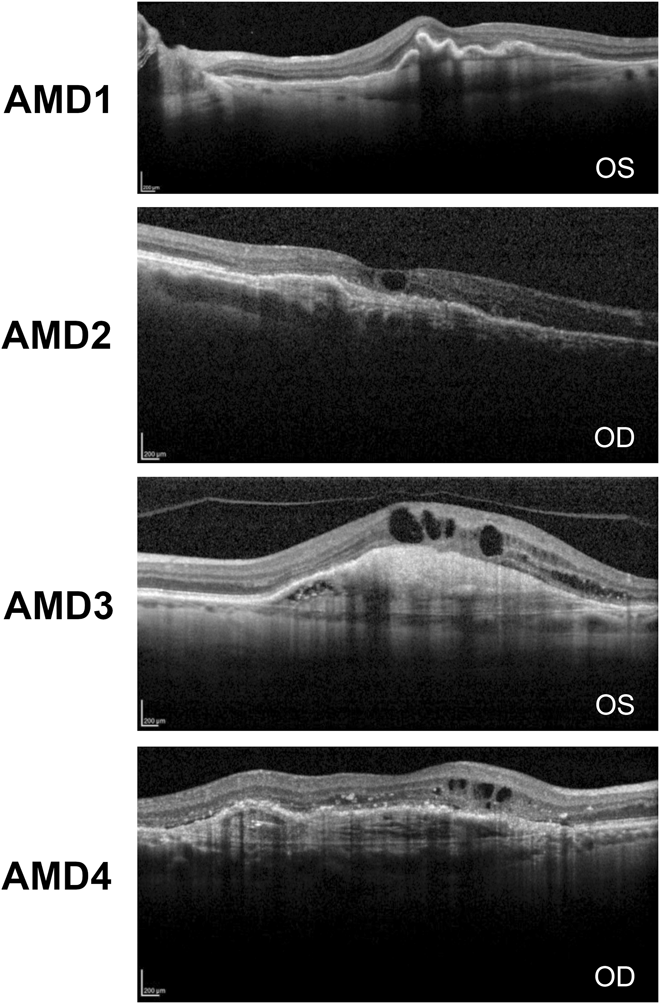
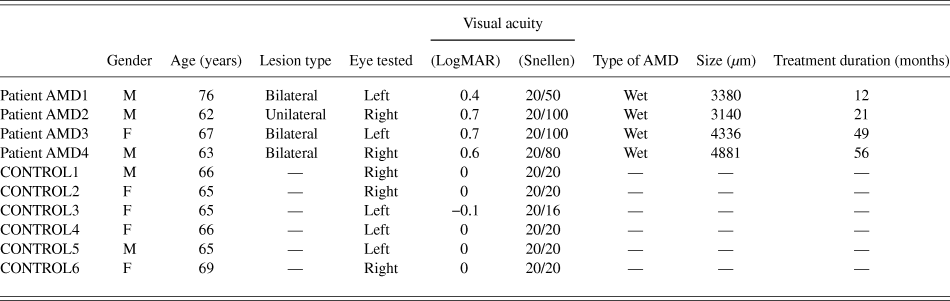
Four patients with exudative AMD without foveal sparing, diagnosed at the Ophthalmology Department of the University Hospital of Grenoble (Grenoble, France) for treatment with intravitreal antivascular endothelial growth factor injections, were recruited for the study. The inclusion criterion was a visual acuity between 1 and 0.2 logarithm of the minimum angle of resolution—LogMAR (corresponding Snellen visual acuity: 20/200 and 20/32). Patient AMD2 had unilateral AMD and was tested monocularly on the pathological eye. Patients AMD1, AMD3, and AMD4 had bilateral AMD and were tested monocularly on the eye that meets the inclusion criterion. Six age-matched normally sighted participants (controls) were also tested on only one eye. For control participants, the inclusion criterion was a visual acuity between −0.1 and 0 LogMAR (corresponding Snellen visual acuity: 20/16 and 20/20) on the selected eye. Patients’ optical coherence tomography (OCT) pictures of the tested eye are displayed in Fig. 2. Participants with psychiatric, neurological, and ocular disorders were not included in the study. Demographic and clinical data are presented in Table 1. Participants requiring visual correction wore the MediGoggle Adult Research Set (Cambridge Research Systems Ltd., England; http://www.crsltd.com/), interchangeable prescriptive goggles suitable for use in MR environments. Participants gave their informed written consent for this study, which was carried out in accordance with the Code of Ethics of the World Medical Association (Declaration of Helsinki) and approved by the local ethic committee (CPP ID RCB: 2011-A01551-40).
OCT pictures of the oculus sinister (OS, i.e., left eye) for patients AMD1 and AMD3 and of the oculus dexter (OD, i.e., right eye) for patients AMD2 and AMD4.

Demographic and clinical data for patients with AMD and control participants. Visual acuity is expressed in logarithm of the minimum angle of resolution (logMAR) and in the corresponding Snellen visual acuity. The approximate size of the retinal defect (µm) was evaluated by one ophthalmologist, who was blind to all clinical data

Stimuli and procedure
Stimuli, task, and fMRI paradigm were identical to that of Ramanoël et al. (Reference Ramanoël, Kauffmann, Cousin, Dojat and Peyrin2015). Stimuli consisted of 20 black and white photographs (256-level gray-scales) of indoor and outdoor scenes with a visual angle of 24 × 18° in order to stimulate both the fovea and the peripheral visual field. Exemplars from the two categories (outdoor and indoor) were chosen in order to have similar dominant orientations in the amplitude spectrum and to avoid categorization based on this type of visual cue. The spatial frequency content of scenes was not modified for NF scenes and filtered using low-pass cutoffs of 12, 24, and 49 cycles/image for LSF scenes and high-pass cutoffs of 71, 144, and 293 cycles/image for HSF scenes. Filtered images were created using the MATLAB image processing toolbox on (Mathworks, Inc., Sherborn, MA). The spatial frequency content of scenes was filtered by multiplying the Fourier transformation of original images by Gaussian filters. The standard deviation of the Gaussian filter is a function of the spatial frequency cutoff, for a standard attenuation of 3 dB. The resulting images were then normalized to obtain a mean luminance of 0.5 for luminance values of between 0 and 1 (corresponding to a mean luminance of 128 on a gray-level scale). In the LUM condition, the contrast of filtered scenes was not modified. In the RMS condition, scenes were normalized to obtain an RMS contrast of 0.1 (corresponding to 25.6 on a gray-level scale). We chose a value situated between LSF and HSF contrast values in natural conditions (i.e., 0.21 and 0.04, respectively, in the LUM condition), in order to avoid affecting one spatial frequency condition more than another. We used a backward mask to prevent retinal persistence of scenes. In the LUM condition, the mask was built using a 1/f amplitude spectrum and a random phase spectrum, to match the amplitude spectrum of NF scenes in which luminance decreases as spatial frequency increases following a 1/f function (Field, Reference Field1987). In the RMS condition, the mask was also built using a 1/f amplitude spectrum and a random phase spectrum. It was then normalized to match the mean luminance and RMS contrast of filtered scene stimuli in the RMS condition (i.e., mean luminance of 0.5 and RMS contrast of 0.1 for luminance values between 0 and 1).
Stimuli were displayed using E-prime software (E-prime Psychology Software Tools Inc., Pittsburgh, PA) and back-projected onto a translucent screen positioned at the rear of the magnet. Participants had to make a categorical choice. They had to decide whether the scene took place indoor or outdoor by pressing on two response buttons with the forefinger of each hand. The response button corresponding to each category was counterbalanced between participants. For each trial, reaction times were recorded to the nearest millisecond following the response as well as response accuracy. A block-designed paradigm with blocks of NF, LSF, and HSF scenes was preferred to an event-related paradigm due to its robustness for individual clinical applications. The experiment consisted of two functional runs for the LUM condition and two functional runs for the RMS condition, counterbalanced across participants. Each functional run lasted 5 min and was composed of nine 25-s task blocks (one block per spatial frequency cutoff and three blocks of NF scenes), including 10 scenes (5 indoors and 5 outdoors), interspersed with three 25-s blocks with a fixation dot in the center of the screen displayed against a gray background. Each scene stimulus was displayed for 100 ms followed by the mask for 30 ms to prevent retinal persistence of scenes, and a fixation dot in the center of the screen. Each scene was presented in all of the spatial frequency conditions within the experiment. The order of scene stimuli was randomized between spatial frequency blocks and runs across participants. The interval between the onsets of two successive stimuli was 2.5 s.
fMRI acquisition
Experiments were performed using a whole-body 3T Philips scanner (Achieva 3.0T TX Philips–Philips Medical Systems, Best, NL) with a 32-channel head coil at the Grenoble MRI facility IRMaGe in France. For all functional spatial frequency scans, the manufacturer-provided gradient-echo/T2* weighted EPI method was used. Forty-four adjacent axial slices parallel to the bicommissural plane were acquired in sequential mode. Slice thickness was 3 mm. The in-plane voxel size was 2.5 × 2.5 mm (220 × 220 mm field of view acquired with a 88 × 85 pixel data matrix; reconstructed with zero filling to 96 × 96 pixels). The main sequence parameters were as follows: TR = 2500 ms, TE = 30 ms, and flip angle = 80°. Finally, a T1-weighted high-resolution three-dimensional anatomical volume was acquired, by using a 3D modified driven equilibrium Fourier transform sequence (field of view = 256 × 224 × 175 mm; resolution: 1.33 × 1.70 s × 1.37 mm; acquisition matrix: 192 × 132 × 128 pixels; and reconstruction matrix: 288 × 288 × 128 pixels).
Data analysis
Data analysis was performed using the general linear model (Friston et al., Reference Friston, Holmes, Poline, Grasby, Williams, Frackowiak and Turner1995) for block designs in SPM12 (Wellcome Department of Imaging Neuroscience, London, UK, www.fil.ion.ucl.ac.uk/spm/) implemented in MATLAB 7 (Mathworks Inc., Sherborn, MA). Functional volumes were realigned to correct for head movements to the mean functional image using a rigid body transformation. The T1-weighted anatomical volume was realigned to mean images created and was normalized to the MNI space. A default fourth degree B-spline interpolation was applied. The anatomical normalization parameters were subsequently used for the normalization of functional volumes. Finally, each functional volume was smoothed by an 8-mm FWHM (Full Width at Half Maximum) Gaussian kernel. Times-series for each voxel were high-pass filtered (1/128 Hz cutoff) to remove low-frequency noise and signal drift.
Conditions of interest were modeled as regressors constructed as boxcar functions convolved with a canonical hemodynamic response function. Accuracy for each trial (either correct responses or error) and movement parameters derived from realignment corrections (three translations and three rotations) were also entered in the design matrix as additional factors of no interest to account for accuracy-related variance and head motion, respectively. For each participant, we identified the neural correlates of the processing of each spatial frequency content relative to the fixation with respect of the luminance contrast condition ([LUM-NF > fixation], [LUM-LSF > fixation], [LUM-HFS > fixation], [RMS-NF > fixation], [RMS-LSF > fixation], and [RMS-HSF > fixation]). Areas of activation were considered significant if they exceeded a voxel and cluster threshold of P < 0.05 family-wise error (FWE) corrected for multiple comparisons (T > 5.18, with a minimum cluster extent of 5 voxels). Considering this threshold, no significant activation was observed for patients AMD1 and AMD2 for either contrast in the occipital cortex, maybe due to the central blindness. A more lenient threshold was thus used for these two patients (P < 0.001 uncorrected for multiple comparisons, T > 3.11). We also performed an analysis based on the different spatial frequency cutoff for each spatial frequency band relative to fixation ([LSF-12cpi > fixation], [LSF-24cpi > fixation], [LSF-49cpi > fixation], [HSF-71cpi > fixation], [HSF-144pci > fixation], and [HSF-293cpi > fixation]). Unfortunately, the small number of trials for each spatial-frequency cutoff (only 20) did not allow a robust statistics.
fMRI localization of scene-selective areas
Next, we examine the response to NF and filtered scenes in high-level scene-selective areas: the left and right PPAs. Left and right PPAs were defined based on coordinates obtained in a group of 12 normally sighted elderly participants (8 males; mean age ±SD: 64 ± 3 years; range 61–71 years) who did not participate in the present experiment but in Ramanoël et al. (Reference Ramanoël, Kauffmann, Cousin, Dojat and Peyrin2015). This group performed a functional MRI experiment designed to functionally localize the left and right PPAs for each individual participant, based on the selective response of this region to scene stimuli. In this experiment, participants viewed in binocular conditions grayscale photographs of scenes, faces, and common objects in separate blocks of a block design paradigm. The functional run lasted 3 min and was composed of eight 15-s task blocks (four blocks of scenes, two blocks of faces, and two blocks of objects), including 15 different images of the same type, interspersed with four 15-s blocks with a fixation dot in the center of the screen displayed against a gray background. Participants were instructed to press a button whenever they saw two identical stimuli repeated (“one-back” repetition detection task). Left and right PPAs were identified independently for each participant by a [Scenes > Faces + Objects] contrast. Mean group peak coordinates of activation in each hemisphere were used to create small sphere ROIs (8 mm radius). These ROIs served as the structural constraint for the analysis of the data in patients with AMD and control participants.
Results
Behavioral results
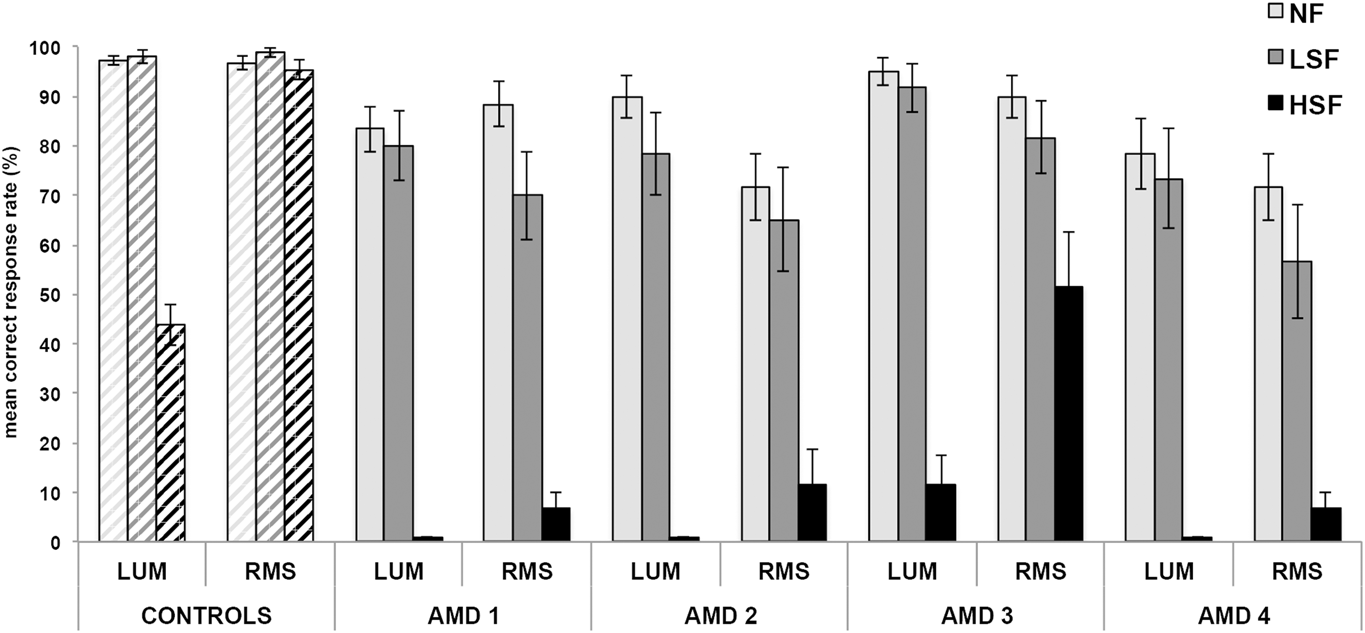
The mean correct response rate (mCR) for the categorization of HSF scenes was very low in patients (ranging from 0 to 100%), and the mean correct reaction time could not be calculated when the mCR was null. Therefore, analyses were only conducted on mCR. In order to compare the mCR of each patient with that of the control group (6 normally sighted elderly participants), we used a modified Crawford and Howell t-test (Reference Crawford and Howell1998), specifically designed to compare an individual’s performance to norms derived from a small control sample. In the categorization of NF scenes, mCR was significantly lower in patients AMD1, AMD2, and AMD4 than in controls in both the LUM and RMS conditions (all t 5 > 2.015, P < 0.05; see Fig. 3). Only AMD3 had an mCR within normal performance range in the LUM condition (t 5 = −0.96, P = 0.19; RMS condition: t 5 > 2.015, P < 0.05). Importantly, all four patients with AMD had significantly poorer performances than controls for both LSF and HSF scenes, and in LUM and RMS conditions (all t 5 > 2.015, P < 0.05; see Fig. 3). We then compared the difference between LSF and HSF in each patient with the same difference for the control group using a modified Crawford et al. (Reference Crawford, Garthwaite and Porter2010) t-test specifically designed to test differences in an individual’s performance in two conditions. Significant differences between the standardized mCR for LSF and HSF scenes in both the LUM and RMS conditions were seen for all four patients, suggesting a specific HSF deficit in patients with AMD, irrespective of luminance contrast (all t 5 > 2.015, P < 0.05).
mCRs (%) for the categorization of NF, LSF, and HSF scenes when luminance contrast of scenes was not modified (LUM condition) and when RMS contrast was normalized (RMS condition) in controls and patients with AMD. Error bars for controls correspond to the standard error due to the group and error bars for patients with AMD correspond to the standard error due to the items.

Finally, descriptive analyses showed higher mCRs for HSF scenes in the RMS condition than in the LUM condition for both controls and patients with AMD. In order to statistically test how luminance contrast influences spatial frequency processing in these four patients, an ANOVA was run for control participants as a group and for each patient on individual scenes (item analysis). It should be noted that an ANOVA could not be conducted with spatial frequency (LSF and HSF) as a within-items factor due to low accuracy rate (0% for HSF scene categorization when contrast was not normalized) and to the absence of variance. We therefore calculated a HSF deficit score for each indoor and outdoor scene by subtracting accuracy in HSF scenes from that of LSF scenes for each contrast condition (see Fig. 3). These values were entered into an ANOVA with contrast (LUM and RMS) as a within-items factor, and category (outdoor and indoor) as a between-items factor. Control participants and all four patients with AMD showed that differences between LSF and HSF mCRs were reduced in the RMS condition (Controls: F 1,18 = 210.53, P < 0.001; patient AMD1: F 1,18 = 10.98, P < 0.01; patient AMD2: F 1,18 = 9.51, P < 0.01; patient AMD3: F 1,18 = 35.53, P < 0.001; and patient AMD4: F 1,18 = 6.08, P < 0.05), suggesting that categorization of HSF scenes was improved by increasing contrast. The category did not interact with the contrast effect (all F < 1).
fMRI results
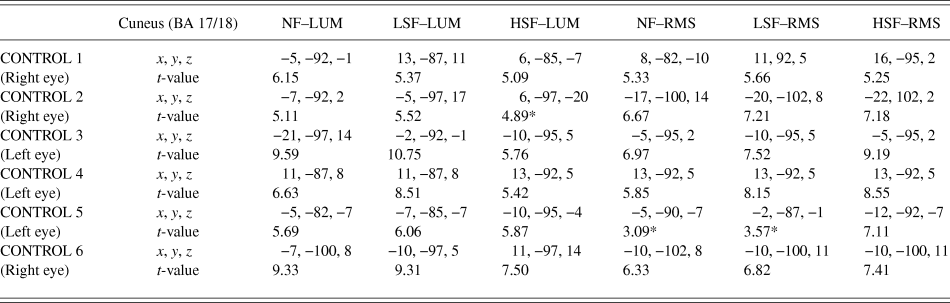
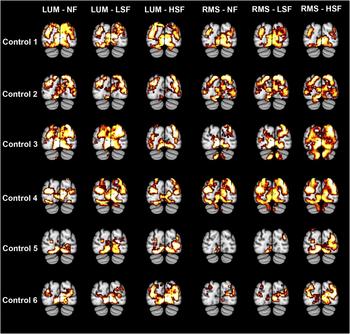
In control participants, we observed extensive recruitment of the left and right occipital cortex (including the cuneus and the inferior, middle and superior occipital gyri) extending to the middle and inferior temporal cortex for NF, LSF, and HSF scenes for both LUM and RMS conditions relative to fixation. Critically, the posterior part of the occipital cortex was activated bilaterally, i.e., in both hemispheres, in all control participants (at the level of the cuneus, BA 17/18; peak coordinates are summarized in Table 2) in all experimental conditions (Fig. 4). This bilateral activation of the posterior part of the occipital cortex is consistent with the retinotopic projection (Grill-Spector & Malach, Reference Grill-Spector and Malach2004; Wandell, Dumoulin, & Brewer, Reference Wandell, Dumoulin and Brewer2007) of visual information displayed both in the left and right visual fields, as it was the case with the large scenes used in the present study. Information from the left visual field projects to the occipital cortex in the right hemisphere, and information from the right visual field projects to the left hemisphere. In addition, patterns of activation are very similar for NF, LSF, and HSF conditions in both the LUM and RMS conditions. Contrasts between spatial frequencies were not significant in the LUM condition ([LSF > HSF] and [HSF > −LSF] contrasts). In the RMS condition, only Control 5 displayed significantly more activation bilaterally in the cuneus for HSF than LSF scenes.
Activations of the cuneus in control participants for the processing of each spatial frequency content (NF, LSF, and HSF) relative to the fixation with respect of the luminance contrast condition (LUM and RMS). The statistical significance threshold for individual voxels was set at P < 0.05 FWE corrected for multiple comparisons (t > 4.94). Brodmann areas (BAs), peak coordinates (x, y, z), and t-values are indicated. NF, nonfiltered; LSF, low spatial frequency; HSF, high spatial frequency; LUM, luminance normalization; RMS, luminance and root-mean-square contrast normalization

Cerebral regions activated by contrasting NF, LSF, and HSF scenes to fixation periods in control participants. Bilateral occipital activation was systematically observed. Activations are displayed at −85 mm on the y-axis. For illustrative purposes, statistical maps were generated with P < 0.001 uncorrected.

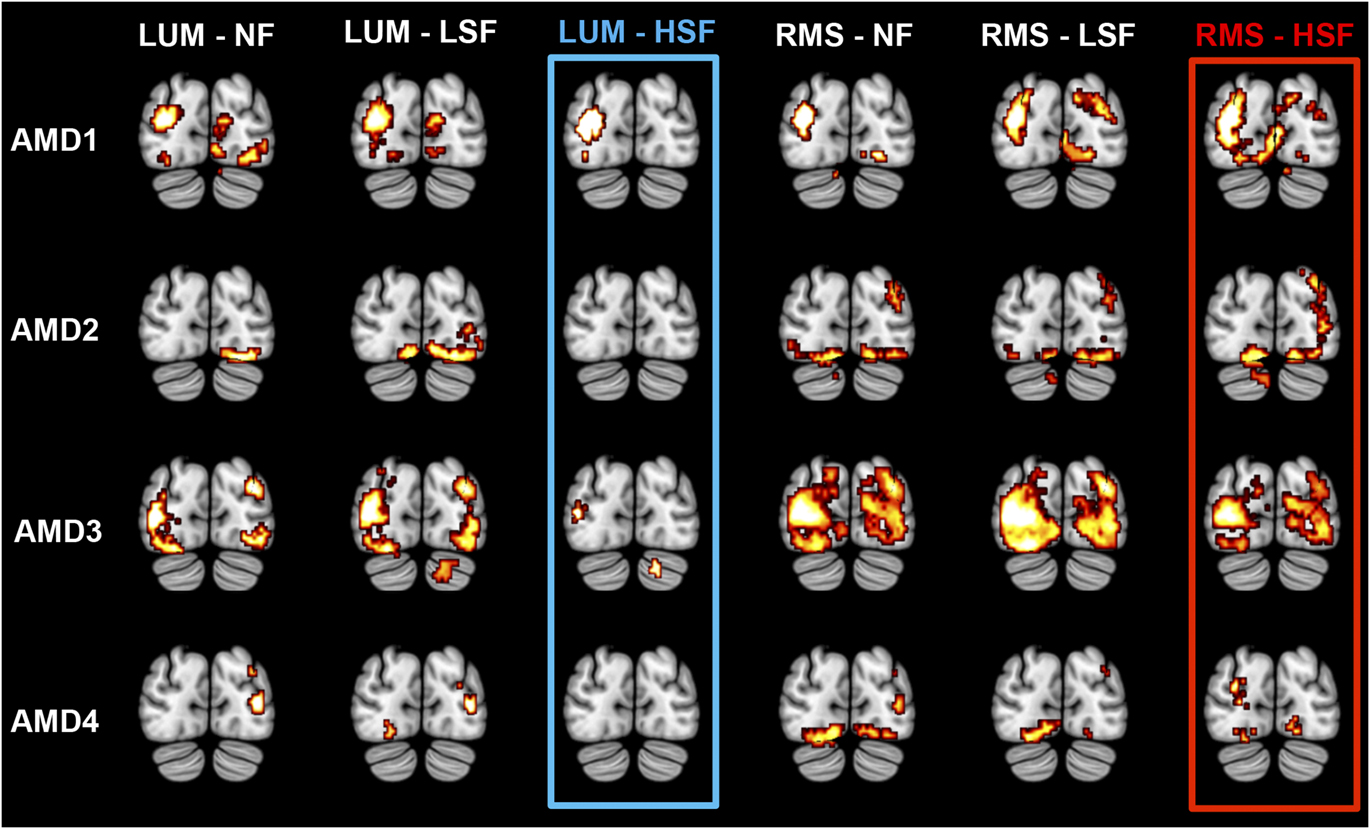
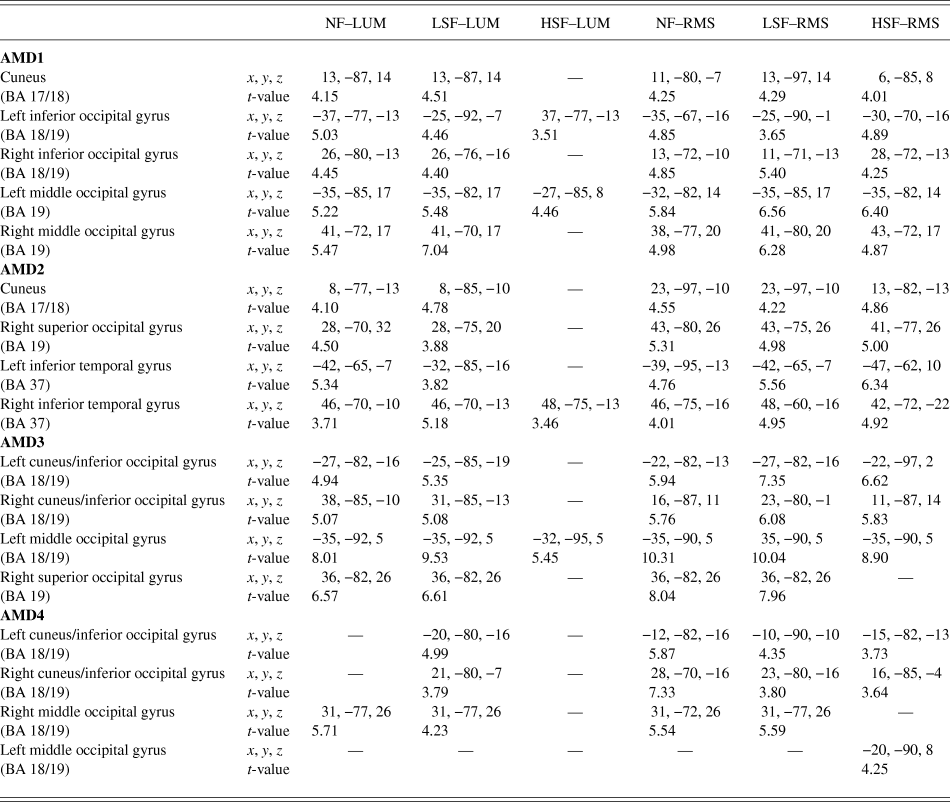
Overall, the occipital cortex was less activated for patients with AMD than controls. Occipital regions activated in patients with AMD during the categorization task according to the spatial frequency content and luminance contrast of scenes are illustrated in Fig. 5, and peak coordinates are summarized in Table 3. In patient AMD1, extensive activation was observed bilaterally in the occipital cortex (including the cuneus and the inferior and middle occipital gyri) for NF and LSF scenes in the LUM and RMS conditions. For HSF scenes, only the left inferior and middle occipital gyri were activated when luminance contrast of scenes was not modified (LUM condition), while additional activations in the posterior cuneus and the right inferior and middle occipital gyri were observed when RMS contrast was normalized between scenes (RMS condition). In patient AMD2, we also observed activation of the occipital cortex (including the cuneus bilaterally and the right superior occipital gyrus) extending to the inferior temporal gyrus for NF and LSF scenes in the LUM and RMS conditions. Critically, no significant activation of the occipital cortex was observed in the LUM condition for HSF scenes, but this did appear in the RMS condition. In the last condition, activations were similar to those of NF and LSF scenes. In patient AMD3, we noted activation of the occipital cortex (including the cuneus and inferior occipital gyrus bilaterally, the left middle occipital gyrus, and the right superior occipital gyrus) for NF and LSF scenes in the LUM and RMS conditions. For HSF scenes, only the left middle occipital cortex was activated in the LUM condition, while activation encompassed both the posterior cuneus and inferior occipital gyrus bilaterally in the RMS condition. Finally, in patient AMD4, the right middle occipital gyrus was constantly activated for NF and LSF scenes in the LUM and RMS conditions. No activation was observed for HSF scene in the LUM condition, whereas the cuneus was bilaterally activated in the RMS condition. For all patients with AMD, no activation was observed in the visual areas encoding the central visual field, irrespective of the experimental condition (see Supplementary material Fig. 1). The categorization of LSF scenes in the LUM and RMS conditions elicited activation systematically located in the visual areas corresponding to the peripheral visual field. For the categorization of the HSF scenes in the LUM condition, we observed a reduced activation for patient AMD1 and an absence of activation for patients AMD2, AMD3, and AMD4 in the visual areas dedicated to the peripheral visual field. However, for the categorization of HSF scenes in the RMS condition, we observed an increased activation in the visual areas encoding the peripheral visual field for all patients.
Cerebral regions activated by contrasting NF, LSF, and HSF scenes to fixation periods in patients with AMD. Critically, the cuneus was not activated for HSF scenes in the LUM condition (in blue), while increased contrast in HSF scenes in the RMS condition induced occipital activation (in red). Activations are displayed at −85 mm on the y-axis. For illustrative purposes, statistical maps were generated with P < 0.001 uncorrected.
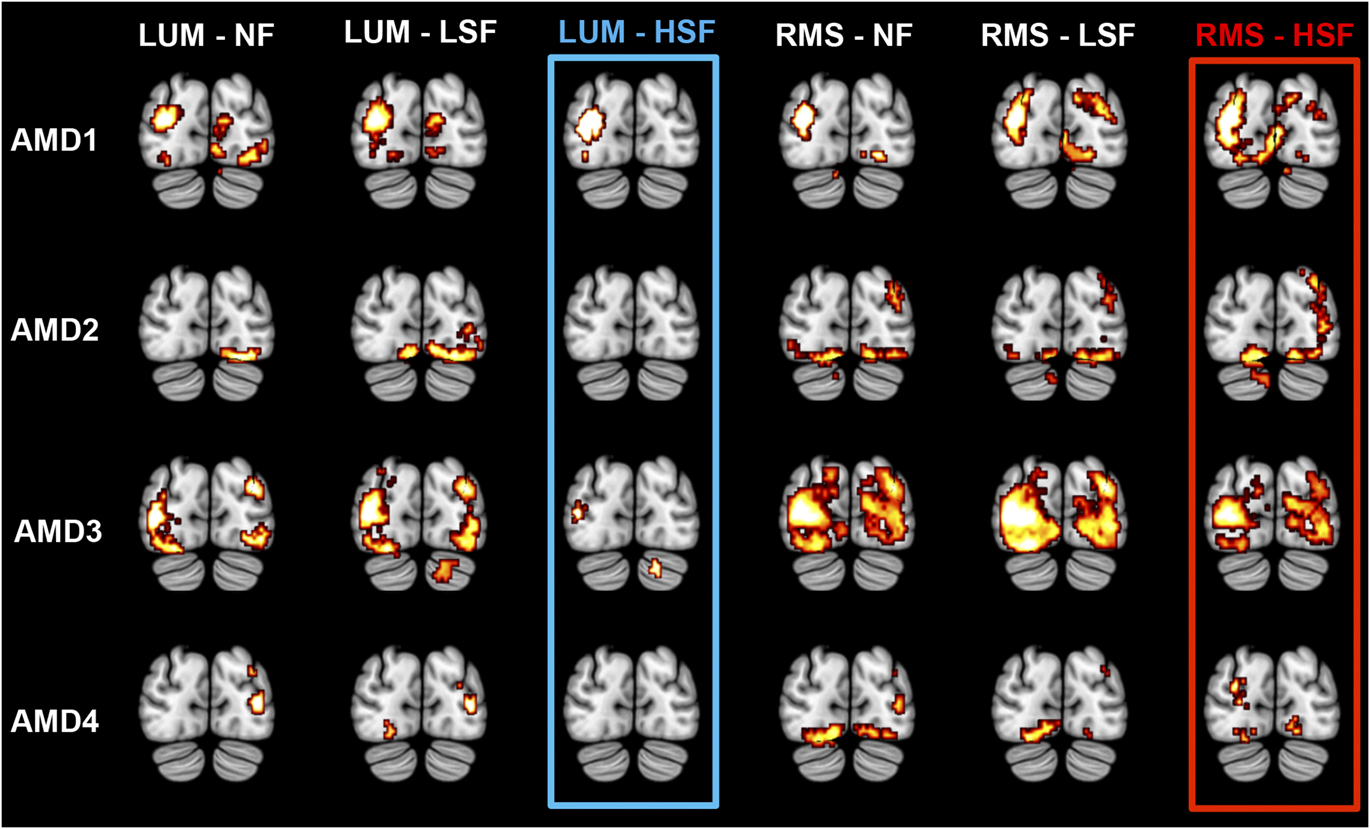
Regions of the occipital cortex activated in AMD patients for the processing of each spatial frequency content (NF, LSF, and HSF) relative to the fixation with respect of the luminance contrast condition (LUM and RMS). The statistical significance threshold for individual voxels was set at P < 0.05 FWE corrected for multiple comparisons for AMD2 and AMD3 (t > 4.94) and P < 0.001 uncorrected for AMD1 and AMD4 (t > 3.11). BAs, peak coordinates (x, y, z), and t-values are indicated. NF: nonfiltered; LSF, low spatial frequency; HSF, high spatial frequency; LUM, luminance normalization; RMS, luminance and root-mean-square contrast normalization

In view of the supplementary occipital activation in the patient with AMD for HSF scenes in the RMS condition, we directly assessed categorization of HSF scenes in the RMS condition in comparison to the LUM condition by calculating the following contrast: [(RMS-HSF > fixation) > (LUM-HSF > fixation)] masked inclusively by [RMS-HSF > fixation]. The inclusive masking was performed to avoid activations that could reflect “deactivations” induced by the [fixation > LUM-HSF] contrast. No significant activation was observed. It should also be noted that for all four patients, contrasts between spatial frequencies were not significant in either the LUM or RMS conditions ([LSF > HSF] and [HSF > LSF] contrasts).
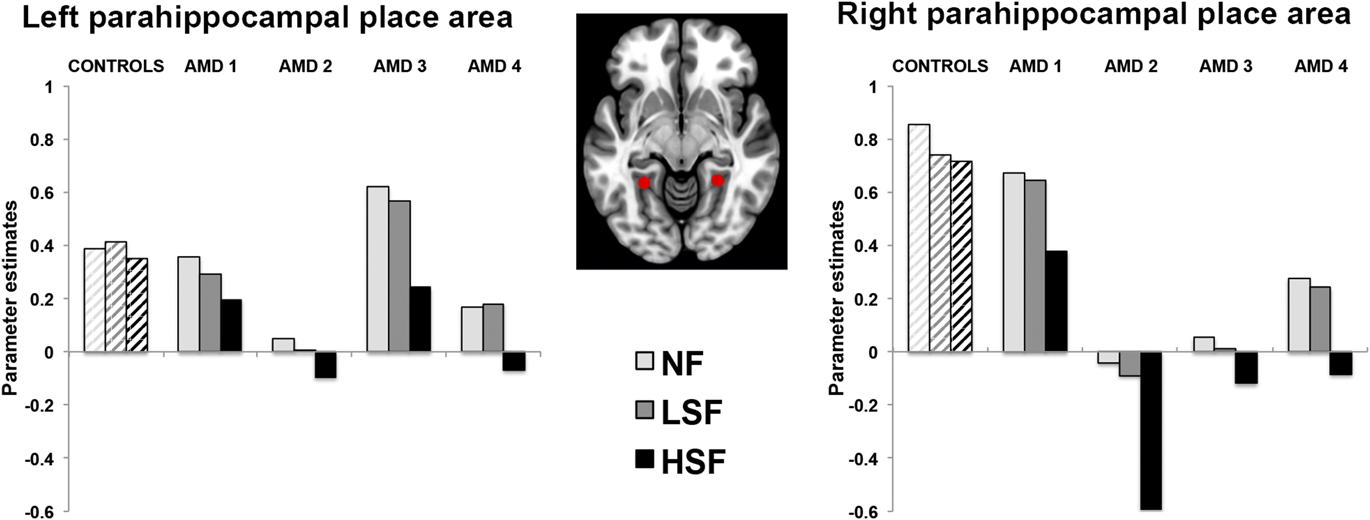
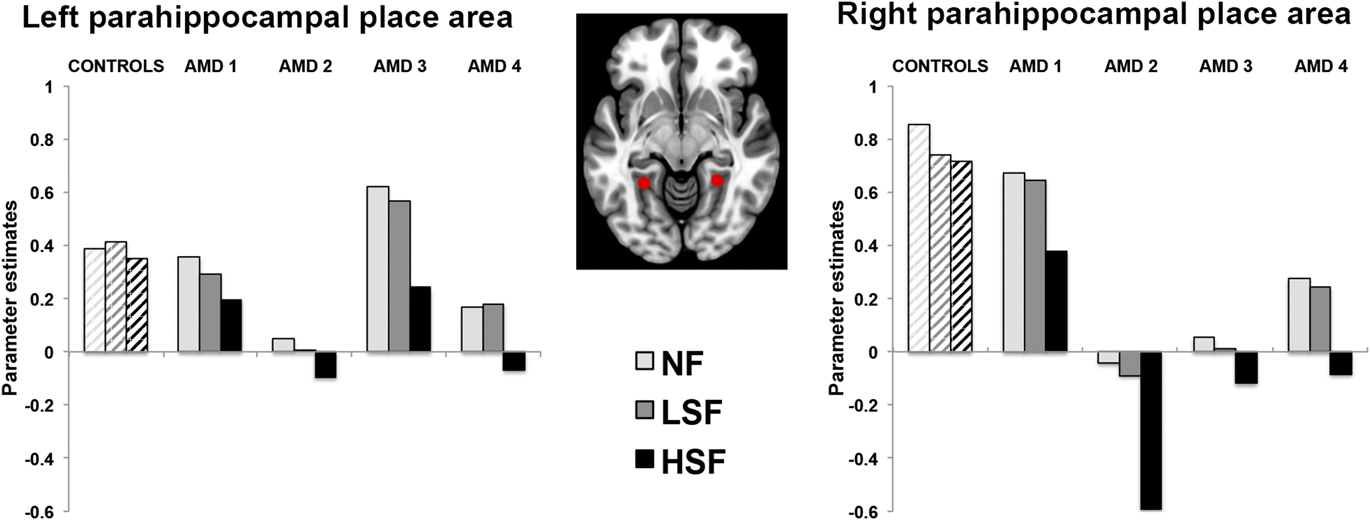
The left and right PPAs, i.e., brain areas specialized for scene processing, were functionally designed as ROIs, based on coordinates obtained with the independent fMRI experiment performed on normally sighted elderly participants to specifically localize the PPAs. For each patient and control participant, parameter estimates of block responses were extracted from two sphere PPA ROIs (8 mm radius) centered on these coordinates (left PPA: −27x, −47y, −7z; right PPA: 26x, −45y, −10z; Fig. 6). Using a modified Crawford and Howell t-test (1998), we found that the right but not left PPA was less activated in patients AMD2, AMD3, and AMD4 than controls for HSF scenes only and irrespective of contrast (all t 5 > 2.015, P < 0.05; Fig. 6).
Parameter estimates extracted from the left PPA (peak coordinates: −27x, −47y, −7z) and right PPA (peak coordinates: 26x, −45y, −10z) in controls and patients with AMD for the categorization of NF, LSF, and HSF scenes.
Discussion
The present study aimed to explore the relationship between the HSF deficit of patients with AMD and the brain activity during scene perception. The results indicate that the deficit in processing HSF in photographs of indoor and outdoor scenes occurs in association with an absence of activation in areas of the occipital cortex dedicated to both central and peripheral visual field processing, and also in the PPA. Increasing contrast improved the processing of HSF and spurred activations specifically in areas of the occipital cortex dedicated to peripheral visual field processing.
Spatial frequency processing in patients with AMD
First, behavioral results showed that for normally sighted elderly participants, correct responses were lower for HSF than NF and LSF scenes. Similar results were observed in a previous fMRI study conducted on normally sighted elderly participants (Ramanoël et al., Reference Ramanoël, Kauffmann, Cousin, Dojat and Peyrin2015). In this study, elderly participants gave more nonresponses when categorizing HSF than NF and LSF scenes, whereas no difference was observed between spatial frequencies in young participants. The selective deficit in the categorization of HSF scenes in elderly people is consistent with an age-related decline in visual acuity (Gittings & Fozard, Reference Gittings and Fozard1986; Brown & Lovie-Kitchin, Reference Brown and Lovie-Kitchin1993; Elliott et al., Reference Elliott, Yang and Whitaker1995; Rubin et al., Reference Rubin, West, Munoz, Bandeen-Roche, Zeger, Schein and Fried1997) and with the decrease in contrast sensitivity for HSF previously observed in studies using sinusoidal gratings (Owsley et al., Reference Owsley, Sekuler and Siemsen1983; Elliott, Reference Elliott1987; Higgins et al., Reference Higgins, Jaffe, Caruso and deMonasterio1988; Elliott et al., Reference Elliott, Whitaker and MacVeigh1990; Owsley, Reference Owsley2011; see however, Sekuler et al., Reference Sekuler, Hutman and Owsley1980). Given the parvocellular pathway’s sensitivity to HSF, these results could be linked to the functional decline of the parvocellular pathway in normal aging (Elliott & Werner, Reference Elliott and Werner2010).
Importantly, the present study indicates that the behavioral HSF deficit is more pronounced in patients with AMD than in normally sighted elderly participants. This result is consistent with previous studies using filtered visual scenes as stimuli (Musel et al., Reference Musel, Hera, Chokron, Alleysson, Chiquet, Romanet, Guyader and Peyrin2011; Peyrin et al., Reference Peyrin, Ramanoël, Roux-Sibilon, Chokron and Hera2017) and could be interpreted as the consequence of the central retinal lesion. Indeed, AMD is a retinal disease that leads to the loss of photoreceptors in the central area of the macula (fovea). The density of cones and midget ganglion cells, which are used for high acuity vision and to process HSF information, is greatest in the center of the retina. Furthermore, the distribution of retinal photoreceptors and ganglion cells is nonhomogeneous (Curcio et al., Reference Curcio, Sloan, Kalina and Hendrickson1990). The number of cones and midget ganglion cells decreases with retinal eccentricity. In the parafoveal retina, the receptive fields are larger. Because patients with central scotoma therefore have to use their parafoveal vision when spatial resolution is lower, this might result in the loss or misrepresentation of HSF information. The categorization of LSF scenes and of NF scenes, was, on the contrary, relatively well preserved in the residual vision of patients. Thibaut et al. (Reference Thibaut, Tran, Szaffarczyk and Boucart2014) observed that patients with AMD were able to categorize NF scenes in their peripheral vision at 12° of eccentricity, suggesting that scene categorization can be accomplished on the basis of only the low spatial resolution characteristic of the peripheral vision.
One way to compensate for an HSF deficit in patients’ parafoveal vision would be to increase contrast in HSF scenes. Peyrin et al. (Reference Peyrin, Ramanoël, Roux-Sibilon, Chokron and Hera2017) investigated the categorization of HSF scenes in patients with AMD using different levels of RMS contrast (0.05, 0.10, 0.15, and 0.20 for luminance values between 0 and 1). The perception of HSF scenes was notably improved by increasing contrast (until it reached the normal categorization). In the present study, categorization of HSF scenes improved in control participants and all four patients when contrast was enhanced. In sum, performance was lower for HSF than for NF and LSF scenes, for both AMD patients and controls, but the HSF deficit was more pronounced in AMD patients than in controls. Furthermore, increasing contrast improved the processing of HSF.
Neurobiological correlates of the HSF deficit
Visual processing is retinotopically organized in the primary cortex. Central (or macular) vision is represented in the posterior part of calcarine sulcus and covers a large cortical area relative to the small retinal area it occupies. Patients with a central scotoma are thus left with a large amount of deafferented visual cortex that previously responded to the central visual field. A number of studies have examined whether functional cerebral reorganization of the lesion projection zone accompanies retinal central lesions in AMD. To date, reports have presented conflicting results, with some research teams reporting an absence of response in a large region of the primary visual cortex deprived of retinal input (Sunness et al., Reference Sunness, Liu and Yantis2004; Masuda et al., Reference Masuda, Dumoulin, Nakadomari and Wandell2008; Liu et al., Reference Liu, Cheung, Schuchard, Glielmi, Hu, He and Legge2010), and others reporting its presence (Baker et al., Reference Baker, Peli, Knouf and Kanwisher2005; Cheung & Legge, Reference Cheung and Legge2005; Baker et al., Reference Baker, Dilks, Peli and Kanwisher2008; Schumacher et al., Reference Schumacher, Jacko, Primo, Main, Moloney, Kinzel and Ginn2008). Using fMRI retinotopic mapping in a single patient with AMD, Sunness et al. (Reference Sunness, Liu and Yantis2004) observed that the cortical areas corresponding to the pericentral scotoma location of the patient were silent. Similar results have been observed by Masuda et al. (Reference Masuda, Dumoulin, Nakadomari and Wandell2008) and Liu et al. (Reference Liu, Cheung, Schuchard, Glielmi, Hu, He and Legge2010). However, Baker et al. (Reference Baker, Peli, Knouf and Kanwisher2005) found that parts of visual cortex of two patients with AMD with extensive bilateral central retinal lesions that would normally respond only to central visual stimuli were strongly activated by large stimuli presented in the periphery, while no activation was observed for visual stimuli in the position of the former fovea. Baker et al. (Reference Baker, Dilks, Peli and Kanwisher2008) subsequently replicated their results in three new patients with AMD with extensive central retinal lesions, but not in patients with foveal sparing, suggesting that the foveal responses to peripheral stimuli only occur in patients with complete bilateral loss of functional foveal vision. The difference in findings has also been attributed to differences in the stimuli and tasks used in the various studies (Masuda et al., Reference Masuda, Dumoulin, Nakadomari and Wandell2008; Liu et al., Reference Liu, Cheung, Schuchard, Glielmi, Hu, He and Legge2010). During passive viewing or while performing tasks unrelated to the stimulus, the cortical areas corresponding to the lesion position were silent. Significant activation of the foveal cortex by peripheral stimuli was observed only when patients were performing a task (Masuda et al., Reference Masuda, Dumoulin, Nakadomari and Wandell2008). This observation was taken to suggest that activation of the lesion projection zone reflects unmasking of feedback connections from extrastriate visual cortex. Visual cortex responses, including those of the primary visual cortex, may also be modulated by attention. However, the vast majority of the studies focused on the cerebral reorganization of topographic representation in the occipital cortex induced by the central retinal lesion and activation in the lesion projection zone. Our present study has aimed instead to gain a better understanding of the visual deficits and brain changes in patients with AMD during the explicit recognition of complex visual stimuli. We investigated the residual abilities of patients with AMD during scene perception, an activity of daily life, paying particular interest to the processing of spatial frequencies and the HSF deficit.
In elderly control participants, the categorization of NF, LSF, and HSF scenes (relative to the fixation) activated the posterior part of the occipital lobe bilaterally, irrespective of whether or not luminance contrast was normalized, or of the eye tested. Patterns of activation were quite similar for NF, LSF, and HSF scenes in the LUM condition. Contrasts between spatial frequencies did not reveal significant activation for individuals or in the light of the statistical threshold used in the present study. Importantly, although behavioral results revealed a HSF deficit in controls, the low-contrast HSF scenes induced significant activation of the cuneus relative to the fixation. In the RMS condition, patterns of activation were again quite similar for NF and LSF scenes, as were HSF scenes in the LUM condition. In the case of Control 5 only, it should be noted that more high-contrast HSF scenes (RMS condition) induced significantly greater bilateral activation of the posterior occipital lobe than did lower-contrast LSF scenes. In all four patients, the categorization of large NF and LSF visual scenes in the LUM condition induced significant activation in disparate parts of the occipito-temporal cortex. Critically, these parts were not activated for HSF scenes. In the RMS condition, low-contrast NF and LSF scenes again activated the occipito-temporal cortex. Enhancing the contrast of HSF scenes could stimulate the occipital cortex and partially restore the deficit. Beyond the occipital cortex, an ROI analysis revealed that the right PPA was less activated for three of the four patients than controls. However, contrast enhancing did not restore the PPA’s response to HSF. The PPA is a cortical region particularly involved in scene perception and spatial frequency processing in scene (Rajimehr et al., Reference Rajimehr, Devaney, Bilenko, Young and Tootell2011; Kauffmann et al., Reference Kauffmann, Ramanoël, Guyader, Chauvin and Peyrin2015). Functional brain changes of high-level cortical regions may induce greater difficulty with details processing even in the residual vision of patients. Recent study conducted in patients with advanced glaucoma (an optical disease characterized by a progressive destruction of the optic nerve resulting in loss of peripheral vision) highlighted gray matter atrophy not only in visual cortex consistent with the visual field loss but also in other regions including the parahippocampal gyrus involved in scene perception, and a decrease in the functional connectivity between areas of the visual cortex (Frezzotti et al., Reference Frezzotti, Giorgio, Motolese, De Leucio, Lester, Motolese, Frederico and De Stefano2014). These defects can be thought as a result of transsynaptic degeneration affecting the ventral cortical stream in glaucoma following the optic nerve damage. Similarly, the retinal damage in AMD may induce a substantial degeneration of high-level areas of the cortical network involved in the processing of HSF, irrespective of contrast. Alternatively, results of a recent study in healthy young adults in which spatial frequency content and contrast of scenes were manipulated. (Kauffmann et al., Reference Kauffmann, Ramanoël, Guyader, Chauvin and Peyrin2015) suggest that the PPA would favor the spatial frequency content that provides the most useful information in a given context. Since HSF processing is impaired in AMD, this region would be in turn tuned to LSF information in which processing is preserved for patients. Finally, the study revealed one intriguing result. For patient AMD2 only, the lesion was unilateral. It means that this patient could use a healthy eye in daily life instead of both affected eyes for the other patients. Thus, the brain may normally process visual information from the healthy eye of patient AMD2. Here, this patient was tested monocularly on the pathological eye and the results showed a decrease of cerebral activation in the occipital cortex and the right PPA for processing HSF in scenes. This result suggests that the pathological eye abandons the processing of HSF to the healthy eye. To support this interpretation, we recently observed that patients with unilateral AMD showed a deficit for categorizing scenes filtered in HSF when they were tested on their pathological AMD eye but not on their healthy eye (Peyrin et al., Reference Peyrin, Ramanoël, Roux-Sibilon, Chokron and Hera2017). Furthermore, patients responded less often during the categorization of HSF scenes when they had to perform the task with their AMD than with their healthy eye. Further studies testing alternatively the pathological and healthy eye under fMRI would allow to provide further insight to brain adaptational process.
Conclusion
The present findings indicate again that a deficit in processing details (based on HSF) in photographs of natural scenes exists in patients with AMD, and that it can be partially restored by enhancing luminance contrast. Although the results need to be confirmed in additional patients, the study established a direct link between behavioral performances and brain changes. From a theoretical point of view, further research involving larger sample of patients is needed to examine the link between the functional brain changes induced by increasing contrast and the retinotopic processing of spatial frequencies (Musel et al., Reference Musel, Bordier, Dojat, Pichat, Chokron, Le Bas and Peyrin2013). From a clinical point of view, the present findings are of particular importance for rehabilitation of patients with AMD. Indeed, enhancing the contrast of scenes could be proposed in order to facilitate the processing of complex and detailed visual scenes. More effort should perhaps be made to propose low vision devices (e.g., video magnifiers, computer monitors) presenting stimuli in a high-contrast format (Moshtael et al., Reference Moshtael, Aslam, Underwood and Dhillon2015).
Supplementary material
To view supplementary material for this article, please visit https://doi.org/10.1017/S0952523817000372.
Acknowledgments
This work was supported by the SFR “Santé et Société” (Université Grenoble Alpes, France) and the RECOR “Agence Nationale pour la Recherche” Grant (ANR-12-JHS2-0002-01 RECOR). Grenoble MRI facility IRMaGE was partly funded by the French program “Investissement d’Avenir” run by the “Agence Nationale pour la Recherche”: Grant “Infrastructure d’Avenir en Biologie Santé” (ANR-11-INBS-0006). We thank Catherine Dal Molin for the English revision of the manuscript.