Implications
Starch-rich concentrates are often fed to performance horses, neglecting the fact that the horse has evolved a digestive system capable of fermenting fibre and that feeding large amounts of starch increases the risk of metabolic diseases. Alternatives to starch-rich concentrates are needed to improve and maintain nutritional health of horses. Sugar beet pulp (SBP), a co-product from the sugar industry, has a high content of highly fermentable fibre and it is a potential alternative to traditional concentrates. The present study demonstrated that SBP can be fed as a highly fermentable fibre source and partly replace barley, hence reducing starch intake.
Introduction
Carbohydrates are the most abundant components of feedstuffs fed to herbivores and omnivores and also the most important source of energy for these animals (Bach Knudsen, Reference Bach Knudsen1997). However, carbohydrate is a general term for a large group of complex molecules found in feedstuffs in various proportions (Bach Knudsen, Reference Bach Knudsen1997; Brøkner et al., Reference Brøkner, Bach Knudsen, Karaman, Eybye and Tauson2012a), and the site of digestion or fermentation of carbohydrates in the gastrointestinal tract of the horse depends on many factors, for example, carbohydrate composition and processing of a given feedstuff.
Performance horses are commonly fed starch-rich concentrates, but as a grazing non-ruminant herbivore, capable of fermenting fibrous feeds in its highly specialized hindgut, the horse needs fibre to maintain its health. It is well known that the risk of horses getting metabolic diseases (Hudson et al., Reference Hudson, Cohen, Gibbs and Thompson2001; Luthersson et al., Reference Luthersson, Nielsen, Harris and Parkin2009) and showing abnormal behaviour (Redbo et al., Reference Redbo, Redbo-Torstensson, Ödberg, Hedendahl and Holm1998) is higher when forage intake is reduced and starch-rich concentrate is increased in the daily ration. Therefore, research has focused on forage-only diets to be fed to performance horses (Ringmark et al., Reference Ringmark, Roepstorff, Essén-Gustavsson, Revold, Lindholm, Hedenström, Rundgren, Ögren and Jansson2013) or feeding of alternative highly fermentable fibre sources like soyabean hulls (Coverdale et al., Reference Coverdale, Moore, Tyler and Miller-Auwerda2004) and sugar beet pulp (SBP) (Karlsson et al., Reference Karlsson, Jansson, Essén-Gustavsson and Lindberg2002). The content of pectin-rich soluble fibre in SBP (~50%) can be analyzed with the dietary fibre (DF) analysis (Bach Knudsen, Reference Bach Knudsen2001). The soluble fibre fraction is interesting because it is highly fermentable and therefore, has a potentially higher digestible energy (DE) content than traditional forages (Murray et al., Reference Murray, Longland, Hastie, Moore-Colyer and Dunnett2008).
SBP has been proposed to have other beneficial effects than being a highly fermentable fibre source: for example, improving the water balance in horses (Warren et al., Reference Warren, Lawrence, Brewster-Barnes and Powell1999) and having a positive effect on the apparent digestibility of the cell wall fraction when lucerne hay or silage were partly substituted with SBP (Murray et al., Reference Murray, Longland, Hastie, Moore-Colyer and Dunnett2008). Furthermore, when SBP was included in a diet with barley, caecal pH did not decrease as much after feeding as when the same amount of barley was fed alone (Brøkner et al., Reference Brøkner, Austbø, Næsset, Bach Knudsen and Tauson2010). A possible cause of the altered pattern of pH change might be changes in the passage rate of the feed through the gastrointestinal tract. However, feeding lucerne partly substituted with SBP did not affect the total mean retention time (TMRT) of the feed (Murray et al., Reference Murray, Sanderson, Longland, Moore-Colyer, Hastie and Dunnett2009). Feeding level has been reported to affect TMRT (Pagan et al., Reference Pagan, Harris, Brewster-Barnes, Duren and Jackson1998; Drogoul et al., Reference Drogoul, De Fombelle and Julliand2001). Feeding iso-energetic diets with 100%, 70% or 50% of dry matter (DM) coming from hay resulted in a dry matter intake (DMI) of 25, 17 and 14 g/kg BW per day, respectively (Drogoul et al., 2001). These differences in DMI decreased the TMRT from 42 h on the 50% hay diet to 30 h on the 100% hay diet. However, it is not known how TMRT is affected when barley is partly substituted with SBP.
The aim of the present experiment was to study the effect of diet on TMRT when hay or barley was partly substituted with SBP. The diets were formulated to be iso-energetic, hence the forage to grain ratio and feed intake (kg DM/day) would be different. It was hypothesized that feed intake would affect TMRT more than partly substituting hay or barley with SBP.
Material and methods
Experimental design
The experiment was designed as a 4×4 Latin square with four horses measured in four experimental periods where each period consisted of 18 days of adaptation to a diet and 10 days of data collection. Feed passage rate was measured over 3 consecutive days followed by a 3-day interval and ending with 4 consecutive days of total faecal and urine collection. All horses remained healthy throughout the study, and they were cared for according to the laws and regulations concerning experiments on live animals in Norway (i.e. the Animal Protection Act of 20 December 1974 and the Animal Protection Ordinance concerning Experiments on Animals of 15 January 1996).
Animals, housing and management
In all, four caecum cannulated Norwegian Coldblooded trotter horse geldings (aged 6 to 15 years, initial BW 542±17 kg) were used. The horses were weighed at the same time each morning during total collection of faeces and urine. They were housed in an unheated barn in 3×3 m individual stalls with wood shavings as bedding material. Through the adaptation period and during the 3-day break between passage rate measurements and total collection of faeces and urine, the horses were allowed access to a dirt paddock for ~6 h after the morning feeding. The horses were exercised four to five times a week during the adaption period in an outdoor rotary exerciser. The exercise programme was automatized and started with 10 min of walk at a speed of 1.8 m/s followed by intervals of trot at speeds of 3.7 and 5.5 m/s for 20 min. Finally, the horses walked at a speed of 1.8 m/s for 5 to 15 min after the exercise programme. During the data collection period the horses were exercised once in the outdoor rotary exerciser in the 3-day break and once during the total collection of faeces and urine on an indoor treadmill. The exercise programme started 8 weeks before the start of the experiment. Just before the start of the experiment all horses had health inspection by a veterinarian, including floating of the teeth.
Feedstuffs, diets and feeding
The dietary treatments consisted of combinations of hay, pelleted barley and molassed SBP as described below. Hay (mainly mature timothy) was purchased from a local hay producer. It was cut with a mower conditioner and left for wilting for 2 days and the remaining of the drying process was done artificially at a drying facility (To Gode Naboer ANS, Trøgstad, Norway). The dried hay was stored loose, but delivered in bales weighing ~20 kg. An indicative analysis of the hay was done by a commercial laboratory (Eurofins, Moss, Norway) and the calculated value of its net energy content was used in the ration formulation. Pelleted barley (Felleskjoebet Agri, Gardermoen, Norway) was produced by grinding barley to pass a 3 mm screen, mixing with molasses (4% of the pellet) and a binding agent (0.7% of the pellet; PellTech 2; Borregaard Industries Ltd, Sarpsborg, Norway), and pelleting was done in an expander at 88°C. The molassed SBP (Betfor®; Nordic Sugar, Copenhagen, Denmark) was soaked in cold water in a 1 : 2.5 w/w ratio for 8 to 10 h before feeding and molassed SBP was chosen instead of SBP because of better palatability. The four dietary treatments (Table 1) were hay only (HAY), hay (85% of DMI) and molassed SBP (15% of DMI) (SBP), hay (68% of DMI) and barley (32% of DMI) (BAR), and hay (68% of DMI), barley (26% of DMI) and molassed SBP (6% of DMI) (BAR+SBP). The feeding level was 18.5, 17.3, 15.7 and 15.7 g DM/kg BW per day for the HAY, SBP, BAR and BAR+SBP diets, respectively. The horses were fed four times daily at 0600, 0700, 1600 and 2200 h. A vitamin−mineral blend (Champion Multitilskudd; Felleskjoebet Agri) and NaCl was included in the meal at 2200 h, at levels of 100 and 50 g, respectively. Barley (2 g starch/kg BW) and SBP (50% of the daily ration) were fed at 0600 h and the rest at 2200 h. The amount of hay was divided into three meals and fed at 0700, 1600 and 2200 h, except for the HAY diet where the morning meal was divided into two meals fed at 0600 and 0700 h. Hay was fed at 0700 h to ensure that all the concentrate fed at 0600 h was eaten first.
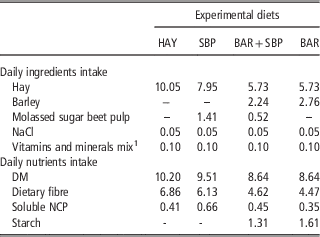
Composition of the four experimental diets (kg DM/day) when hay only (HAY), hay substituted with sugar beet pulp (SBP), barley and sugar beet pulp (BAR+SBP) or barley (BAR) was fed to horses

Soluble NCP=soluble non-cellulosic polysaccharides.
1 The vitamin–mineral mix provided per kg: Ca, 135 g; P, 30 g; Na, 38 g; Mg, 23 g; Zn, 3000 mg; Mn, 1500 mg; Fe, 1500 mg; Cu, 675 mg; Co, 8 mg; I, 41 mg; Se, 15 mg; vitamin A, 225 000 IU; vitamin D3, 22 500; vitamin E (α-tocopherol acetate), 7500 mg; vitamin B1, 188 mg; vitamin B2, 150 mg; vitamin B6, 150 mg; vitamin B12, 2 mg; d-pantothenic acid, 450 mg; nicotinic acid, 375 mg; folic acid, 150 mg; choline chloride, 1125 mg; biotin, 23 mg; vitamin C, 375 mg.
Marker preparation and dosing
The hay used in the feed passage rate study was labelled with ytterbium (Yb) by the immersion technique used by Austbø and Volden (Reference Austbø and Volden2006). A hay sample was mixed with water and heated to 45°C for 1.5 h before it was placed in nylon bags with a pore size of 1 mm and rinsed with tap water for 0.5 h. The bags were then emptied and the hay was soaked in Yb acetate (1.21 g Yb acetate/l) and stored at 45°C for 24 h. Thereafter, hay was placed in nylon bags again, rinsed with tap water for 1 h and soaked in a 0.01 M acetic acid solution at pH 4 for 1.5 h to remove loosely bound Yb. After a final rinse with tap water for 1 h the Yb-labelled hay was dried at 45°C for 48 h. The labelling was controlled by analysing a sample for Yb before feeding the labelled hay. The night before passage rate measurements the 2200 h meal was omitted, and the following morning at 0600 h 500 g of Yb-labelled hay was fed to each horse. The horses had access to the Yb-labelled hay for 1 h, before orts were removed and weighed. The normal morning meal of concentrate and hay (adjusted for the intake of Yb-labelled hay) was then fed at 0700 h.
Collection procedures
Samples of feedstuffs were collected regularly during the data collection period and stored in sealed plastic bags for later analyses. Total collection of faeces and urine were performed using a collection harness (Stablemaid, Melbourne, Australia). The collection harness was emptied every 6 h and faeces and urine were stored in plastic containers that were kept at a temperature below 10°C. In containers with urine 1 l of 10% sulphuric acid was added to decrease pH below 3 in order to avoid evaporative N loss. Daily faecal and urine excretion was weighed, homogenized and a subsample of 10% was stored in plastic containers and frozen at −20°C. The subsamples from each day were pooled for each horse, homogenized and new subsamples of 500 g of faeces and 50 g of urine were taken and stored for subsequent analysis. Water consumption was measured automatically for each horse and registered daily at 0600 h during the 4 days of total collection of faeces and urine. Rectal samples of faeces (~100 g) were collected 5, 6, 7, 8, 9, 10, 11, 12, 14, 16, 18, 20, 22, 24, 26, 28, 30, 32, 34, 36, 38, 48 and 53 h after administration of the Yb-labelled hay, and frozen for later analyses of Yb.
Chemical analyses
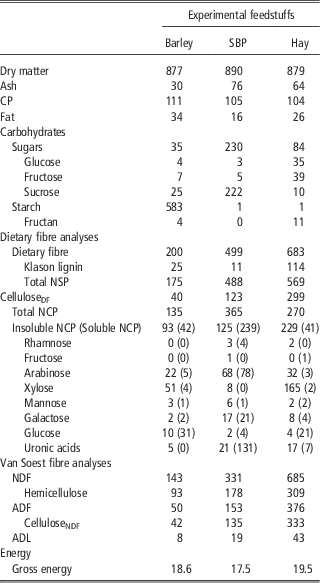
All samples of feeds, faeces and urine were analysed (Table 2) in duplicates except for DF. The DM content in feedstuffs, faeces and urine were determined by drying to constant weight (24 h at 105°C). Faecal samples were freeze-dried and analyses were performed after milling the samples to pass a 1 mm screen (gross energy (GE), fat, CP, NDF, ADF, DM and ash) or a 0.5 mm screen (DF, starch, sugars and fructan). The DM in freeze-dried samples was measured as described above, and samples were incinerated at 525°C for 6 h for determination of ash content. The feedstuffs fed in each period were analysed separately, except for DF, starch, sugars and fructan where a pooled sample of each feedstuff was made. Nitrogen was determined by the Kjeldahl technique (Tecator-Kjeltec system 1030; Tecator AB, Höganäs, Sweden) and CP calculated as N×6.25. Fat content of feedstuffs was determined by petroleum ether extraction in a Soxtec system after HCl hydrolysis (SoltexTM 2043; Foss, Hillerød, Denmark). GE was determined using an adiabatic bomb calorimeter (IKA Calorimeter system; IKA Gmbh and Co. KG, Staufen, Germany). Starch was analysed by an enzymatic colorimetric method according to Bach Knudsen (Reference Bach Knudsen1997) and sugars (glucose, fructose and sucrose) and fructan in feedstuffs by the enzymatic colorimetric method of Larsson and Bengtsson (Reference Larsson and Bengtsson1983).
Dry matter (g/kg), chemical composition (g/kg DM) and gross energy (MJ/kg DM) content of barley, molassed sugar beet pulp (SBP) and hay fed in the present experiment
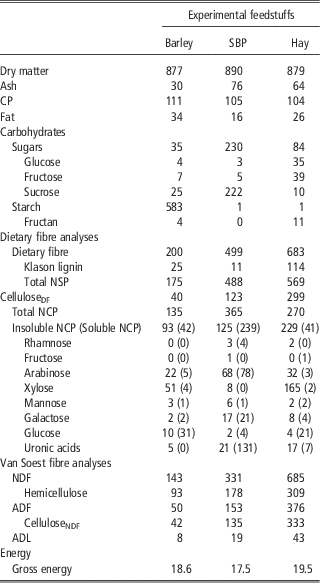
NSP=non-starch polysaccharides; NCP=non-cellulosic polysaccharides.
DF was analysed as described by Bach Knudsen (Reference Bach Knudsen1997). In three parallel runs total non-starch polysaccharides (T-NSP), insoluble NSP (I-NSP), and total non-cellulosic polysaccharides (T-NCP) and their constituent sugars were determined as alditol acetates by GLC for neutral sugars and by a colorimetric method for uronic acids. Klason lignin was measured as the sulphuric acid insoluble residue as described by Theander et al. (Reference Theander, Åman, Westerlund and Graham1994). From the analyses of T-NSP, I-NSP, T-NCP and Klason lignin the following parameters were calculated:
 $${\rm Cellulose}_{{{\rm DF}}} \,{\rm as}:\,{\rm Cellulose}_{{{\rm DF}}} ={\rm T{\hbox-}NSP}-{\rm T{\hbox-}NCP}$$
 $${\rm Insoluble{\hbox-}NCP \ as}: \quad \quad {\rm I{\hbox-}NCP}={\rm I{\hbox-}NSP}-{\rm cellulose}_{{{\rm DF}}} $$
 $${\rm Soluble{\hbox-}NCP \ as}:\quad \quad \quad {\rm S{\hbox-}NCP}={\rm T{\hbox-}NCP}-{\rm I{\hbox-}NCP}$$
 $${\rm DF \ as}: \quad \quad \quad \quad {\rm DF}={\rm T{\hbox-}NSP}{\plus}{\rm Klason\ lignin}$$
NDF and ADF were determined using the Ankom220 fibre analyzer (Ankom Technology, Macedon, NY, USA), following the methodology described by Van Soest et al. (Reference Van Soest, Robertson and Lewis1991). In the NDF analysis, heat-stable α-amylase was included but sulphite was omitted. Results are expressed on an ash-free basis. ADL was determined by soaking samples in 72% sulphuric acid for 3 h with gentle mixing in a DaisyII incubator (Ankom Technology). After removing the sulphuric acid, the filter bags were washed with cold deionized water. The filter bags were dried at 102°C for 24 h and incinerated at 525°C for 6 h for determination of ash content. Hemicellulose and celluloseNDF were estimated by subtracting ADF from NDF and ADL from ADF, respectively.
Faecal samples for passage rate measurements were dried at 60°C for 48 h and ground to pass a 1 mm screen. Samples of 500 mg were incinerated at 550°C for 16 h and Yb was analyzed with the procedure described by Siddons et al. (Reference Siddons, Paradine, Beever and Cornell1985).
Calculations and passage rate models
The apparent total tract digestibility (ATTD) of individual nutrients was calculated as:
 $${\rm ATTD}={{{\rm Intake (g) {\minus}\, Faecal \ excretion (g) }} \over {{\rm Intake (g)}}} \cdot 100\,\%\,$$
Water balance was calculated as water intake with feed+intake of drinking water−water excreted in faeces−water excreted in urine. The DE content of the four different diets was calculated as GE intake with feed−energy excreted in faeces, and the N balance was calculated as N intake−N excreted in faeces−N excreted in urine.
Faecal Yb excretion curves were fitted to different non-linear models describing a single age-dependent mixing compartment (Gamma distribution; Gn, n=2 to 4) and a two-compartment model with an age-dependent first compartment and an age-independent second compartment (G4G1) using the NLIN procedure in SAS® (Version 9.2, SAS Institute Inc., Cary, NC, USA) as described by Pond et al. (Reference Pond, Ellis, Matis, Ferreiro and Sutton1988) and Moore et al. (Reference Moore, Pond, Poore and Goodwin1992). The two-compartment G4G1 model has previously been proposed as the best model to describe faecal excretion of markers compared with one-compartment (Gn; n=1 to 4) and other two-compartment models (GnG1; n=1 to 3) (Moore-Colyer et al., Reference Moore-Colyer, Morrow and Longland2003; Rosenfeld et al., Reference Rosenfeld, Austbø and Volden2006), but in the present study the G4G1 model failed to converge in 6 out of the 16 faecal excretion data sets, and therefore only the one-compartment G2, G3 and G4 models were further evaluated. The following equations were used (Pond et al., Reference Pond, Ellis, Matis, Ferreiro and Sutton1988):
 $$F={{C \cdot \lambda \cdot t \cdot e^{{{\rm {\minus}}\lambda \cdot t}} } \over {{\rm 0}{\rm .59635}}}\quad \quad \quad ({\rm G}2\ \rm model})$$
 $$F={{C \cdot \lambda ^{2} \cdot t^{2} \cdot e^{{{\minus}\lambda \cdot t}} } \over {2{\rm } \cdot 0.47454}}\quad \quad \quad ({\rm G3}\,{\rm model})$$
 $$F={{C \cdot \lambda ^{{\rm 3}} \cdot t^{{\rm 3}} \cdot e^{{{\minus}\lambda \cdot t}} } \over {6{\rm } \cdot 0.40857}}\quad \quad \quad \quad ({\rm G4}\,{\rm model})$$
where F is the fractional concentration of Yb, C the initial concentration of Yb, λ the rate parameter for the gamma-distributed residence time, t the time after dose of marker and 0.59635, 0.47454 and 0.40857 are constants given for each model as described by Pond et al. (Reference Pond, Ellis, Matis, Ferreiro and Sutton1988). However, time delay (TD) was incorporated into the equations and t was substituted with (t−τ), where τ is the time post-dosing to the first appearance of Yb in faeces. The compartmental mean retention time (CMRT) and TMRT were then calculated as (Pond et al., Reference Pond, Ellis, Matis, Ferreiro and Sutton1988):
 $${\rm CMRT=}{n \over \lambda }\quad \quad \quad \quad ({\rm Gn}\,{\rm model})$$
 $${\rm TMRT}={n \over \lambda }{\plus}{\rm TD}\quad \quad \quad \quad ({\rm Gn}\,{\rm model})$$
where n=2 to 4 for a Gn model. Mean square error (MSE) was used to evaluate the goodness of fit for the non-linear models.
Statistical analyses
All statistical analyses of ATTD, water balance, energy metabolism data, nitrogen balance and passage rate parameters were performed using MIXED procedure in SAS® (Version 9.3). The model comprised the fixed effect of diet and the random effect of horse. As the effect of period was non-significant it was removed from the model (except for evaluation of BW changes). Results are presented as least square means with s.e.m. as a measure of variance. Effects were considered significant if P<0.05 and a tendency if P<0.10.
Results
Chemical composition of feedstuffs
The carbohydrate composition of the three feedstuffs varied to a large extent, and the differences in DM, ash, CP, fat and GE were smaller than the differences in the composition of the carbohydrate fractions. The highest content of sugars was found in molassed SBP (mainly sucrose) followed by hay (mainly glucose and fructose) and then barley (mainly sucrose). Starch was only found in considerable amounts in barley. Hay had the highest fibre content expressed as DF, T-NSP, celluloseDF, T-NCP, I-NCP, NDF, ADF, hemicellulose and celluloseNDF. However, S-NCP was highest in the molassed SBP. Lignin (both Klason lignin and ADL) was highest in hay and lowest in barley. The constituent sugars of the three feedstuffs were clearly different. The dominant sugars in the S-NCP fraction in molassed SBP were arabinose and uronic acids, but for barley and hay it was glucose. In the I-NCP fraction xylose was the dominant sugar in barley and hay, and arabinose was the dominant sugar in molassed SBP (Table 2).
The intake of DM was highest on the HAY diet intermediate on the SBP diet and lowest on the BAR+SBP and BAR diets, whereas the intake of DF was higher on the HAY and SBP than the BAR+SBP and BAR diets. Partly substituting hay or barley with SBP increased the amount of S-NCP in the ration, and when barley was partly substituted with SBP the starch intake was reduced to 300 g/day (Table 1).
ATTD of the diets
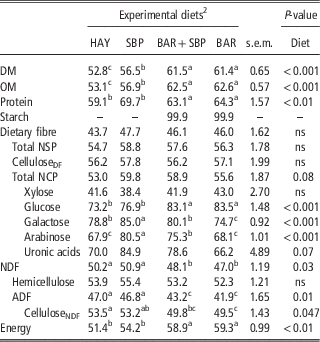
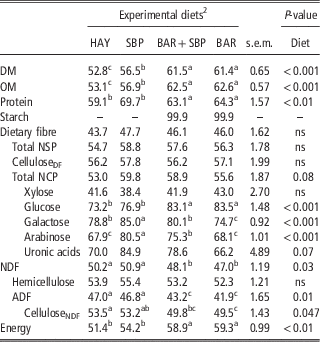
There was an effect of diet on the ATTD of DM and organic matter (OM) (P<0.001) as well as CP (P<0.01) with the two barley diets (BAR+SBP and BAR) having higher ATTD than the HAY and SBP diets. The ATTD of starch was almost complete when barley (BAR+SBP and BAR) was fed (ATTD=99%). There were no differences in the ATTD of DF, T-NSP and celluloseDF among diets. However, there was a tendency for a higher ATTD of T-NCP for the SBP and BAR+SBP diets (P=0.08) compared with the HAY and BAR diets. The DF analysis revealed that xylose, glucose, galactose, arabinose and uronic acids residues were the most abundant constituent sugars of the fibre fraction. There was no effect of diet on the ATTD of xylose, however, a higher digestibility (P<0.001) of glucose was found when barley (BAR+SBP and BAR) was fed compared with feeding the HAY or SBP diets. A higher (P<0.001) ATTD of galactose and arabinose and a tendency (P=0.07) for a higher ATTD of uronic acids were found for the SBP and BAR+SBP diets compared with the HAY and BAR diets, reflecting the differences found in ATTD of T-NCP (Table 3).
The apparent total tract digestibility of nutrients (%) when hay only (HAY), hay substituted with sugar beet pulp (SBP), barley and sugar beet pulp (BAR+SBP) or barley (BAR) was fed to horsesFootnote 1
DM=dry matter; OM=organic matter; total NSP=total non-starch polysaccharides; total NCP=total non-cellulosic polysaccharides.
a,b,cValues in the same row without common superscripts differ significantly (P<0.05).
1 Values are presented as least square means with s.e.m.
2 Number of observations per treatment: n=4.
The ATTD of NDF and ADF were higher (P=0.03 and 0.01) for the HAY and SBP diets compared with the BAR+SBP and BAR diets. There was no difference in ATTD of hemicellulose, but celluloseNDF was higher (P=0.047) on the HAY diet compared with the two barley diets (BAR+SBP and BAR). The ATTD of GE was higher (P<0.01) for the BAR+SBP and BAR diets than when feeding the HAY and SBP diets (Table 3).
Water balance
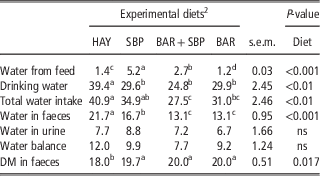
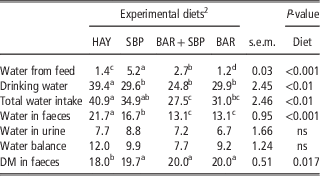
Diets including molassed SBP soaked in water before feeding increased water intake from feed (SBP and BAR+SBP; P<0.001), whereas feeding the HAY diet resulted in a higher drinking water intake (P<0.001) than the other diets. Water intake from feed and drinking water resulted in higher total water intake (P<0.01) when the HAY diet was fed compared with the two barley diets (BAR+SBP and BAR). More water was excreted in faeces (P<0.001) on the HAY and SBP diets than on the two barley diets, but there was no effect of diet on water excretion in urine. As a result of this there was no effect of diet on the water balance. However, faecal DM was (P=0.02) lower when the HAY diet was fed compared with the other diets (Table 4).
Water intake, excretion and balance (l/day) as well as faecal dry matter (%) when hay only (HAY), hay substituted with sugar beet pulp (SBP), barley and sugar beet pulp (BAR+SBP) or barley (BAR) was fed to horsesFootnote 1
a,b,cValues in the same row without common superscripts differ significantly (P<0.05).
1 Values are presented as least square means with s.e.m.
2 Number of observations per treatment: n=4.
DE intake and nitrogen balance
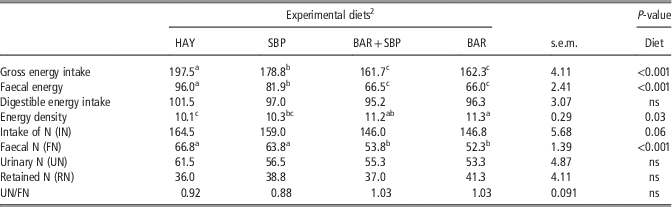
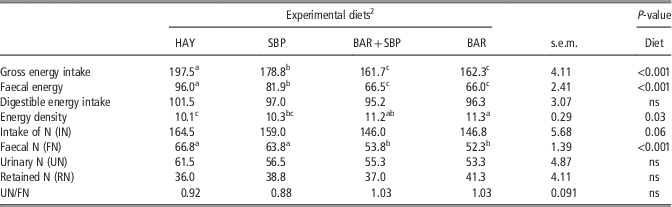
The average BW increased (P=0.01) from 542±12 kg in period 1 to 558±12 kg in period 4 indicating that the energy intake was higher than energy required for maintenance and exercise. It was not possible to document any effect of diet on BW. The energy intake and nitrogen balance are shown in Table 5. The GE intake and energy excreted in faeces were higher (P<0.001) on the HAY diet followed by the SBP compared with the two barley diets (BAR+SBP and BAR). As a result there was no effect of diet on DE intake, fulfilling the aim of feeding iso-energetic diets. The energy density of the diets differed (P=0.03) with the BAR diet having the highest and the HAY diet the lowest.
Digestible energy intake (MJ/day), energy density of the diet (MJ DE/kg dry matter) and nitrogen balance (g N/day) when hay only (HAY), hay substituted with sugar beet pulp (SBP), barley and sugar beet pulp (BAR+SBP) or barley (BAR) was fed to horsesFootnote 1
a,b,cValues in the same row without common superscripts differ significantly (P<0.05).
1 Values are presented as least square means with s.e.m.
2 Number of observations per treatment: n=4.
There was a tendency (P<0.06) for a higher N intake when the HAY diet was fed compared with the other diets. More N (P<0.001) was excreted in faeces from the HAY and SBP diets than from the BAR+SBP and BAR diets. There was no effect of diet on the urinary N excretion, retained N or the urinary N to the faecal N (UN/FN) ratio (Table 5).
Passage rate of feed
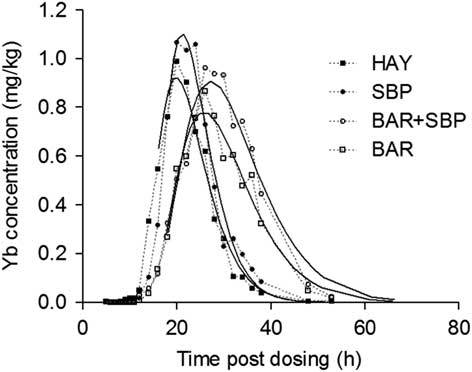
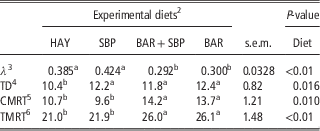
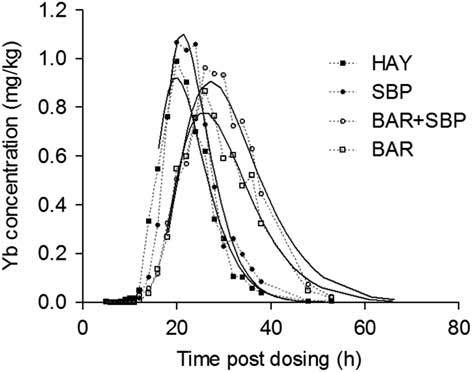
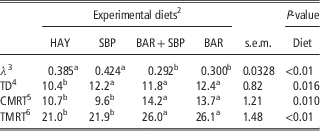
The 2200 h meal was omitted the night before passage rate measurements as an attempt to get the horses to eat the Yb-labelled hay. However, the acceptability of the Yb-labelled hay differed. In all, two of the horses did not consume all the Yb-labelled hay and approximately half of the hay was left after 1 h. Excretion curves of Yb was obtained from all horses and an example of the excretion curves of the four different diets fed to one of the horses is shown in Figure 1. The evaluation of the goodness of fit for the different one-compartment Gn (n=2, 3 or 4) models showed that the MSE was 0.0045 for the G2, 0.0023 for the G3 and 0.0020 for the G4 model, and the G4 model was selected for the calculations of the passage rate parameters presented in Table 6. The λ value (fractional passage rate) was higher (P<0.01) for the HAY and SBP diets than the BAR+SBP and BAR diets, resulting in similar differences (P=0.01) for the CMRT. The TD was lower (P<0.02) for the HAY diet than the other diets. The TMRT was lower (P<0.01) for the HAY and SBP diets than for the BAR+SBP and BAR diets.
Excretion curves of ytterbium (Yb)-labelled hay and modelling of the data points to the G4 model (solid lines) when hay only (HAY), hay substituted with sugar beet pulp (SBP), barley and sugar beet pulp (BAR+SBP) or barley (BAR) was fed to horses.
Fractional rate of passage (λ, h−1)3, time delay (TD, h)4, compartmental mean retention time (CMRT, h)5 and total mean retention time (TMRT, h)6 when hay only (HAY), hay substituted with sugar beet pulp (SBP), barley and sugar beet pulp (BAR+SBP) or barley (BAR) was fed to horsesFootnote 1
a,bValues in the same row without common superscripts differ significantly (P<0.05).
1 Values are presented as least square means with s.e.m.
2 Number of observations per treatment: n=4.
Discussion
Hay, molassed SBP and barley were chosen for the present experiment because of the different composition of their carbohydrate fractions. The DF analysis is superior to the traditional NDF analysis in giving a detailed description of the fibre fraction of feedstuffs, especially for feedstuffs with a high content of S-NCP like SBP. However, the results from the DF analysis cannot be directly compared with the NDF analysis, as the two methods are measuring different fractions. There were no differences when evaluating the ATTD of DF of the four different diets. However, fractionation of the fibre into its specific components revealed, as expected, that the ATTD of T-NSP was higher than the ATTD of DF, because T-NSP does not include the indigestible lignin. Differences in the ATTD of the fibre fraction were indicated, when T-NSP was divided into celluloseDF and T-NCP with a tendency for a higher ATTD of T-NCP for the diets containing SBP. This became even more evident when the ATTD of the constituent sugars was evaluated, and relatively high ATTD values of galactose, arabinose and uronic acids residues deriving from pectin in SBP (Serena and Bach Knudsen, Reference Serena and Bach Knudsen2007) and glucose from mixed linked β-glucan in barley (Bach Knudsen, Reference Bach Knudsen1997) were found.
It is well known that starch has an ATTD close to 100% (Julliand et al., Reference Julliand, De Fombelle and Varloud2006), and starch accounted for 15% to 18% of DM on the two barley diets. This partly explains why the ATTD of DM and OM for these two diets were higher than for the two fibre-based diets as has also been found by Drogoul et al. (2001). It has been recommended that the maximum starch intake per meal is 1 g/kg BW (Luthersson et al., Reference Luthersson, Nielsen, Harris and Parkin2009; Coenen et al., Reference Coenen, Kienzle, Vervuert and Zeyner2011) and replacing grain with SBP could be one way to meet these recommendations. In the present study, the daily starch intake was reduced from 3 to 2.4 g/kg BW when barley (BAR) was substituted with SBP (BAR+SBP). It is likely that starch intake could have been reduced even more if a larger proportion of barley was substituted with SBP.
The time-dependent one-compartment G4 model used in the present experiment has been described to fit excretion data well in other experiments, where different compartmental models have been discussed in detail (Moore-Colyer et al., Reference Moore-Colyer, Morrow and Longland2003; Austbø and Volden, Reference Austbø and Volden2006; Rosenfeld et al., Reference Rosenfeld, Austbø and Volden2006). Many factors influence the passage rate (van Weyenberg et al., Reference Van Weyenberg, Sales and Janssens2006), and diet had an effect on TMRT in the present study with the HAY and SBP diets having a ~5 h shorter TMRT than the BAR+SBP and BAR diets. The TMRT of the two barley diets were in accordance with previous studies (Austbø and Volden, Reference Austbø and Volden2006; Rosenfeld et al., Reference Rosenfeld, Austbø and Volden2006). There was no effect of partly substituting hay or barley with SBP on the TMRT, and similar results were found when lucerne silage was partly substituted with SBP (Murray et al., Reference Murray, Sanderson, Longland, Moore-Colyer, Hastie and Dunnett2009). The fact that partial substitution of hay or barley with SBP did not affect TMRT does not exclude possible differences in passage rate through specific segments of the digestive tract (e.g. gastric emptying rate and small intestine passage rate). Similar differences in TMRT between a forage only and mixed forage and concentrate diet have been explained with differences in DM intake (Pagan et al., Reference Pagan, Harris, Brewster-Barnes, Duren and Jackson1998), which is in agreement with the higher DM and DF intake (Table 1). DF intake might explain the differences in TMRT better than DM intake, as the differences in DF intake between the two fibre-based diets and the two barley-based diets were more distinct than the differences in DM intake.
The horses drank more water when fed the hay-only diet (HAY) compared with the concentrate diets (BAR+SBP and BAR) in agreement with previous studies where forage-only diets have been compared with mixed rations (Fonnesbeck, Reference Fonnesbeck1968; Warren et al., Reference Warren, Lawrence, Brewster-Barnes and Powell1999). It has been suggested that the hindgut can act as a fluid reservoir when fibre-based diets are fed (Meyer, Reference Meyer1987), but also that fibre composition might affect water binding and reduce its availability (Cuddeford et al., Reference Cuddeford, Woodhead and Muirhead1992). This was probably the case in the present study as total water intake did not differ between the HAY and SBP diets. However, faecal DM was lower for the HAY diet compared with the SBP diet and the concentrate diets in agreement with Zeyner et al. (Reference Zeyner, Geissler and Dittrich2004). A feedstuffs ability to interact with water can be expressed as its swelling or water-binding capacity (Bach Knudsen, Reference Bach Knudsen2001). Brøkner et al. (Reference Brøkner, Bach Knudsen, Karaman, Eybye and Tauson2012a) measured swelling properties in SBP (high in soluble fibre) to be higher than in timothy hay (low in soluble fibre) (13 v. 10 ml/g DM), whereas the water-binding capacity was lower for SBP than timothy hay (5.3 v. 6.1 ml/g DM). This means that SBP swells and potentially releases more water than timothy hay. SBP is highly fermentable, as discussed above, and water bound to the fibre fraction is released when SBP is fermented. This might explain the lower DM content in faeces, when feeding the HAY diet compared with the SBP diet. In endurance horses where water replenishment might limit performance it might be beneficial to substitute hay with SBP (Harris, Reference Harris2009).
The daily evaporative fluid losses at rest (respiratory and sweating) have been estimated to be 23 ml/kg BW (Groenendyk et al., Reference Groenendyk, English and Abetz1988), which equals ~12.6 l/day in the present study. The water balance was on average 9.7 l/day, but the impact of metabolic water from the oxidation of nutrients was not included. Metabolic water would contribute 2.7±0.1 l/day for the four diets, if estimated according to Faichney and Boston (Reference Faichney and Boston1985), resulting in a water balance of 12.4 l/day, which corresponds very well to the estimated evaporative water losses.
The diets were formulated to be iso-energetic and provided on average 97.5 MJ DE/day, which corresponds to 128% of the requirements for maintenance according to NRC (2007). The estimated N balance (retained N) was 35 to 38 g/day in agreement with others (e.g. Woodward et al., Reference Woodward, Nielsen, Liesman, Lavin and Trottier2011; Brøkner et al., Reference Brøkner, Austbø, Næsset, Bach Knudsen and Tauson2012b), but it is unlikely that this would correspond to a daily deposition of ~200 g protein in mature horses. It was suggested that for high protein forage diets evaporative N losses might be underestimated that then leads to overestimating N retention (Woodward et al., Reference Woodward, Nielsen, Liesman, Lavin and Trottier2011), which might be the case in the present experiment. The four diets provided an average of 964 g CP/day (N×6.25), which is above the requirement for a horse working at moderate exercise level (840 g CP/day; NRC, 2007). There was a tendency for a higher N intake on the HAY and SBP diets, but more N was excreted via faeces on these diets and this might be explained by a lower small intestinal digestibility of N from forages than concentrates (Vermorel and Martin-Rosset, Reference Vermorel and Martin-Rosset1997).
Feeding diets with high fibre content has been suggested to affect performance negatively, as it might increase BW owing to an increased gut fill (Ellis et al., Reference Ellis, Hollands and Allen2002). It was expected that BW was highest when feeding the HAY diet as DM intake was higher when feeding the HAY diet compared with feeding the SBP diet, and the ATTD of DM was lowest on the HAY diet. However, it was not possible to document any effects of diet on BW. BW was measured in the morning before feeding, and time of the day in relation to feeding might have affected the BW as suggested by others (Connysson et al., Reference Connysson, Essén-Gustavsson, Lindberg and Jansson2010; Jansson and Lindberg, Reference Jansson and Lindberg2012).
Conclusion
The present experiment showed that intake of DF (kg DF/day) had a larger effect on TMRT than partly substituting hay or barley with SBP. The S-NCP fraction of SBP is highly fermentable as shown by high ATTD values for the sugar residues of the DF fraction. Collectively, our results showed that SBP can potentially substitute barley in the total ration allowing for reduced starch intake with maintained high nutrient utilization.
Acknowledgements
The authors are very grateful to Mette Henne for technical assistance during the practical part of the experiment and Harald Volden for modelling the passage rate data. This research was financially supported by the Swedish-Norwegian Foundation for Equine Research that the authors gratefully acknowledge.