





Introduction
Since 1995, conservation agriculture (CA) has been promoted in Zambia as a sustainable alternative to conventional tillage, which increases runoff and soil erosion, gradually leads to a decline in soil organic carbon and reduces long-term productivity (Baudron et al., Reference Baudron, Mwanza, Triomphe and Bwalya2007; Thierfelder and Wall, Reference Thierfelder and Wall2009; Arslan et al., Reference Arslan, McCarthy, Lipper, Asfaw and Cattaneo2014; Montgomery and Biklé, Reference Montgomery and Biklé2021; Aćin et al., Reference Aćin, Mirosavljević, Živančev, Jocković, Brbaklić and Jaćimović2023). CA is increasingly recognized as a viable pathway to sustainable agricultural intensification (SAI) due to its dual capacity to increase productivity while preserving the environment (Pretty, Williams and Toulmin, Reference Pretty, Williams and Toulmin2012; Pretty and Bharucha, Reference Pretty and Bharucha2014). SAI seeks to increase agricultural productivity per unit of input (e.g., capital, labor, and land) without adverse impacts on the environment (Pretty et al., Reference Pretty, Williams and Toulmin2012; Mockshell and Kamanda, Reference Mockshell and Kamanda2018; Helfenstein et al., Reference Helfenstein, Diogo, Bürgi, Verburg, Swart, Mohr, Debonne, Levers and Herzog2020). CA improves soil structure, enhances water conservation, and increases resilience to climatic variability, while increasing agricultural productivity (Thierfelder and Wall, Reference Thierfelder and Wall2009; Mafongoya et al., Reference Mafongoya, Rusinamhodzi, Siziba, Thierfelder, Mvumi, Nhau, Hove and Chivenge2016; Thierfelder et al., Reference Thierfelder, Chivenge, Mupangwa, Rosenstock, Lamanna and Eyre2017). This makes CA a sustainable agricultural intensification practice (SAIP) and a strategic component of SAI efforts in sub-Saharan Africa, particularly in Zambia, where achieving food security within ecological limits remains urgent. For example, about 5 million people, representing 30% of Zambia’s population, faced high acute food insecurity between April and September 2024 (IPC, 2024). This was largely due to climatic conditions, including prolonged dry spells that led to drought. Recognizing its potential, CA is part of the Zambian government’s second National Agriculture Investment Plan (NAIP) aimed at increasing productivity and sustaining income (GRZ, 2016). CA promotion in Zambia has focused on addressing land degradation, rising input costs, food insecurity due to increased production, agricultural emissions, and deforestation, and on empowering marginalized people, especially women, through labor-intensive land preparation (Whitfield et al., Reference Whitfield, Dougill, Dyer, Kalaba, Leventon and Stringer2015).
Studies have shown that CA improves crop productivity and mitigates heat stress impacts on yield (Komarek, Thierfelder and Steward, Reference Komarek, Thierfelder and Steward2021; Mhlanga and Thierfelder, Reference Mhlanga and Thierfelder2021; Ansari et al., Reference Ansari, Ravisankar, Ansari, Babu, Layek and Panwar2023). Other studies have also shown CA impacts on livelihoods by increasing profitability, crop and household income (Simutowe, Ngoma and Thierfelder, Reference Simutowe, Ngoma and Thierfelder2025) and reducing farm household poverty (Nafeo Abdulai and Abdul-Rahaman, Reference Nafeo Abdulai and Abdul-Rahaman2019). Corbeels et al. (Reference Corbeels, Naudin, Whitbread, Kühne and Letourmy2020) found that CA demonstrates greater resilience in low-rainfall environments, outperforming conventional practices. This advantage arises from crop residue mulching and diversified cropping systems, which enhance soil processes such as rainfall infiltration, aggregation, biological activity, and nutrient cycling. Further, other studies highlight CA’s potential to reduce labor and erosion (Andersson and D’Souza, Reference Andersson and D’souza2014; Rodenburg, Büchi and Haggar, Reference Rodenburg, Büchi and Haggar2020). The yield benefits of CA are further supported by Phiri et al. (Reference Phiri, Martinsen, Simusokwe, Smebye, Obia, Shitumbanuma, Selby, Cornelissen, Makate and Mulder2025), who found that yield performance under CA was better than that under conventional systems. On the economics side, studies have also shown that CA practices are more profitable than conventional systems (Lorenzetti and Fiorini, Reference Lorenzetti and Fiorini2024; Thierfelder et al., Reference Thierfelder, Mhlanga, Nyagumbo, Kalala, Simutowe, Chiduwa, Maclaren, Silva and Ngoma2024b).
Despite these well-documented benefits, the uptake of full CA (the combined use of minimum tillage, residue retention, and crop rotation/intercropping) among smallholder farmers in sub-Saharan Africa remains low. For example, smallholders make up over 85% of the farming population and more than 90% of Zambia’s rural population (Mubanga and Ferguson, Reference Mubanga and Ferguson2017), yet CA adoption rates remain low (Tufa et al., Reference Tufa, Kanyamuka, Alene, Ngoma, Marenya, Thierfelder, Banda and Chikoye2023). Further, Pangapanga-Phiri, Ngoma and Thierfelder (Reference Pangapanga-Phiri, Ngoma and Thierfelder2024) found that only about 7% of farmers practiced CA in the Mtosa extension planning area (EPA) of Nkhotakota District, compared to about 57% in Mwansambo and Zidyana EPAs. The difference arises because CIMMYT and Total LandCare (TLC) have implemented CA projects in Mwansambo and Zidyana since 2005, whereas no such projects have been implemented in Mtosa. Further, Tufa et al. (Reference Tufa, Kanyamuka, Alene, Ngoma, Marenya, Thierfelder, Banda and Chikoye2023) found that 33% of farmers adopted full CA in Zambia compared to 21% in Zimbabwe. Similarly, Araya et al. (Reference Araya, Ochsner, Mnkeni, Hounkpatin and Amelung2024) note that CA is only practiced on less than 2% of cultivated land in sub-Saharan Africa.
Low adoption of CA is attributed to various factors. For example, it has been documented that limited technical knowledge of CA negatively affects its adoption (Tufa et al., Reference Tufa, Kanyamuka, Alene, Ngoma, Marenya, Thierfelder, Banda and Chikoye2023; Araya et al., Reference Araya, Ochsner, Mnkeni, Hounkpatin and Amelung2024; Pangapanga-Phiri et al., Reference Pangapanga-Phiri, Ngoma and Thierfelder2024). As already established, residue retention is a key component of CA. However, the shortage of crop residues for mulching makes it difficult for farmers to practice CA (Kashe et al., Reference Kashe, Sindel, Kristiansen and Jessop2023; Thierfelder et al., Reference Thierfelder, Mhlanga, Ngoma, Marenya, Matin, Tufa, Alene and Chikoye2024a). Crop residues have competing uses in farming households, as they are also used as fuel or animal feed and grazed by animals when left in the field (Araya et al., Reference Araya, Ochsner, Mnkeni, Hounkpatin and Amelung2024). The other challenge to increased CA adoption in sub-Saharan Africa is the lack of inputs, such as herbicides. Giller et al. (Reference Giller, Witter, Corbeels and Tittonell2009) argued that CA is labor-intensive during weeding when herbicides are unavailable, increasing the need for hired labor. Michler et al. (Reference Michler, Baylis, Arends-Kuenning and Mazvimavi2019) posit that the benefits of CA are more pronounced only in times of less rainfall. This means most farmers do not adopt or dis-adopt CA, as such times do not occur often (every farming season). In addition, Simutowe et al. (Reference Simutowe, Ngoma, Manyanga, Silva, Baudron, Nyagumbo, Kalala, Habeenzu and Thierfelder2024) found that behavioral factors such as risk aversion and impatience are negatively associated with the adoption of CA practices. Despite the farmer input support program (FISP) representing a large portion of Zambia’s agriculture budget (Teschemacher et al., Reference Teschemacher, Ng’ombe, Fajardo-Steinhäuser and Wani2024), a study by Tufa et al. (Reference Tufa, Kanyamuka, Alene, Ngoma, Marenya, Thierfelder, Banda and Chikoye2023) found that more than 60% of farmers who did not adopt or dis-adopted CA attributed their decision to limited support from public input distribution programs.
On the other hand, research has shown that different scaling approaches affect the adoption of climate-smart agricultural practices. Makate (Reference Makate2019) highlighted that participatory approaches, such as peer learning, can improve the adoption of climate-smart agricultural practices by enabling farmers to interact and learn from one another. Evidence also shows that scaling CA adoption requires approaches such as farmer-hosted demonstration plots, farmer field schools, regular extension visits, and digital advisory services (Ngoma et al., Reference Ngoma, Manyanga, Mulungu, Simutowe, Kazekula, Subakanya, Mhlanga, Krupnik, Marenya, Thierfelder and Program2025a, Reference Ngoma, Simutowe, Silva, Nyagumbo, Kalala, Habeenzu and Thierfelder2025b).
Climate change further exacerbates the challenges faced by smallholders in Zambia who rely on rain-fed agricultural production, with rising temperatures threatening food security and livelihoods, leading to serious challenges in poverty reduction and inequality (Ngoma et al., Reference Ngoma, Lupiya, Kabisa and Hartley2021; IPCC, 2022). Projections by Ngoma et al. (Reference Ngoma, Lupiya, Kabisa and Hartley2021) indicate significant declines in crop yields and production, with maize expected to be the most adversely affected by 2050. These impacts are projected to vary by agroecological zone (Mulungu et al., Reference Mulungu, Tembo, Bett and Ngoma2021). While CA’s potential to mitigate these risks is well documented, empirical evidence on its profitability, particularly profit efficiency, a key factor in farmer decisions, remains a subject of ongoing debate. For example, Jaleta et al. (Reference Jaleta, Kassie, Tesfaye, Teklewold, Jena, Marenya and Erenstein2016) found that the benefits of minimum tillage may not offset the short-term costs of adoption because of rising input costs (e.g., herbicides, seed, and fertilizer). Further, transitioning to CA requires investments in alternative weed management strategies, such as herbicides, due to increased weed pressure (Thierfelder et al., Reference Thierfelder, Mhlanga, Ngoma, Marenya, Matin, Tufa, Alene and Chikoye2024a), and can increase labor demands for smallholder farmers who might not be able to afford herbicides (Giller et al., Reference Giller, Andersson, Corbeels, Kirkegaard, Mortensen, Erenstein and Vanlauwe2015).
Despite these benefits, questions remain about CA’s economic viability for smallholder farmers because of short-term yield trade-offs and reliance on herbicides (Giller et al., Reference Giller, Andersson, Corbeels, Kirkegaard, Mortensen, Erenstein and Vanlauwe2015). Furthermore, Phiri et al. (Reference Phiri, Martinsen, Simusokwe, Smebye, Obia, Shitumbanuma, Selby, Cornelissen, Makate and Mulder2025) found insignificant differences in soil fertility levels between CA and non-CA farming systems. Critics of CA, such Giller et al. (Reference Giller, Witter, Corbeels and Tittonell2009), argue that CA increases labor demands for weeding when herbicides are not used, thereby shifting the labor burden to women. Makate and Hanyani-Mlambo (Reference Makate and Hanyani-Mlambo2025) further highlighted that while CA with herbicides reduces family labor, it relies on hired/exchanged labor, and its ability to control soil erosion under high rainfall is limited. Therefore, in Zambia, where smallholder farmers heavily depend on maize production (Thurlow, Zhu and Diao, Reference Thurlow, Zhu and Diao2012; Siatwiinda et al., Reference Siatwiinda, Supit, Van Hove, Yerokun, Ros and De Vries2021) and small- and medium-scale farmers produce more than 90% of the country’s maize (ZamStats, 2025), the profitability of CA and CT hinges on context-specific factors such as agroecological and socioeconomic conditions, institutional and behavioral factors, input access, and market linkages.
Although previous studies have examined the agronomic and economic benefits of CA (Thierfelder, Cheesman and Rusinamhodzi, Reference Thierfelder, Cheesman and Rusinamhodzi2012; Mupangwa et al., Reference Mupangwa, Mutenje, Thierfelder, Mwila, Malumo, Mujeyi and Setimela2017; Mutenje et al., Reference Mutenje, Farnworth, Stirling, Thierfelder, Mupangwa and Nyagumbo2019) and highlighted its cost implications, such as higher weeding labor and herbicide use if the weeds are not well controlled (Giller et al., Reference Giller, Witter, Corbeels and Tittonell2009; Erenstein et al., Reference Erenstein, Sayre, Wall, Hellin and Dixon2012), research on the profit efficiency of maize-based systems among smallholder farmers in Zambia remains limited. Profit efficiency refers to a farm’s capacity to realize the maximum attainable profit, conditional on prevailing output and input prices and the fixed factor endowments available to the production unit (Shrestha, Bhandari and Pandey, Reference Shrestha, Bhandari and Pandey2022). It is expressed as a ratio of actual profit to maximum possible profit (0–1) and can also be expressed as a percentage (1 = 100). This is methodologically different from other widely published studies on farm economics, which used net present value (NPV) and net income (Pannell, Llewellyn and Corbeels, Reference Pannell, Llewellyn and Corbeels2014; Lalani, Dorward and Holloway, Reference Lalani, Dorward and Holloway2017; Mutenje et al., Reference Mutenje, Farnworth, Stirling, Thierfelder, Mupangwa and Nyagumbo2019; FAO and UNDP, 2020), returns to labor, inputs, and investments, and gross and net benefits (Komarek et al., Reference Komarek, Kwon, Haile, Thierfelder, Mutenje and Azzarri2019; Omulo et al., Reference Omulo, Birner, Köller, Simunji and Daum2022; Thierfelder et al., Reference Thierfelder, Mhlanga, Nyagumbo, Kalala, Simutowe, Chiduwa, Maclaren, Silva and Ngoma2024b; Makate et al., Reference Makate, Cornelissen, Simusokwe, Smebye, Handberg, Phiri, Mulder and Martinsen2025). These studies support the notion that CA yields higher economic returns than conventional systems. However, this still limits understanding of how farmers effectively translate available resources into maximum attainable profits. This study is particularly important because previous studies on maize-based systems in Zambia have predominantly focused on technical efficiency (Chiona, Kalinda and Tembo, Reference Chiona, Kalinda and Tembo2014; Musaba and Bwacha, Reference Musaba and Bwacha2014; Ng’ombe and Kalinda, Reference Ng’ombe and Kalinda2015; Abdulai and Abdulai, Reference Abdulai and Abdulai2016; Ng’ombe, Reference Ng’ombe2017) and to our knowledge, the only one on profit efficiency focused on groundnut production (Chikobola, Reference Chikobola2016), leaving a gap in the literature on profit efficiency in maize-based systems. This study also uses a three-wave panel household survey dataset, unlike the cross-sectional and trial data used in previous studies.
This study addresses these knowledge, methodological, and context-specific (crop and farmer) gaps by evaluating the maize profitability and profit efficiency of CA and CT maize-based practices among smallholder farmers in Zambia, using farmer typologies. The methods section details three farmer typologies: asset- and income-poor, asset- and income-rich, and asset- and income-moderate. The paper makes three important contributions to the CA literature. First, it offers a comprehensive assessment of maize economic performance under both CA and CT practices, using gross margins disaggregated by farmer typologies. Second, it employs panel data stochastic frontier analysis (SFA) and tobit econometric models to estimate profit efficiency and identify factors influencing it across different CA and CT maize-based practices. Lastly, it enhances understanding of how adopting CA affects profitability and efficiency among diverse smallholder farmers across different typologies in Zambia.
The findings have important implications for policymakers, agricultural extension services, and development programs aimed at scaling CA among smallholder farmers in Zambia. By quantifying farmer-specific differences in profitability and profit efficiency, this study offers actionable insights to prioritize CA promotion among farmer segments where it shows clear economic advantages over CT practices, address context-specific constraints that limit efficiency gains, and design targeted incentives or training programs to improve the financial viability of CA adoption.
Conceptual framework
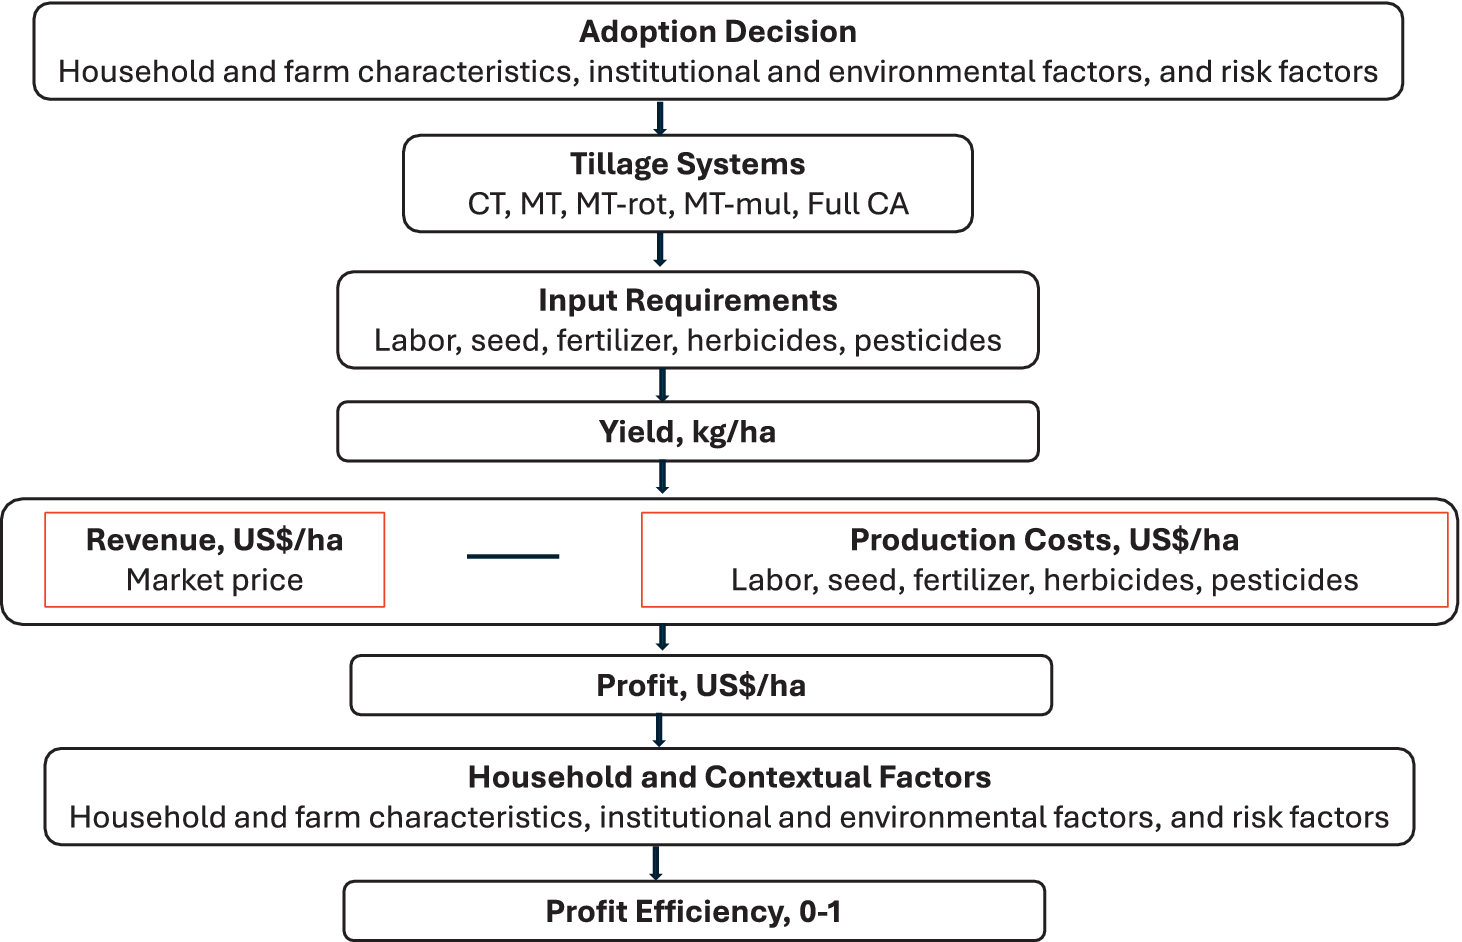
Conservation agriculture is mostly promoted for its yield benefits and climate resilience. However, this study focuses on profit and profit efficiency of CA and conventional practices. While profit analysis looks at how much money a farmer makes after subtracting production costs from revenue, profit efficiency is complex and is less studied. Profit efficiency looks at how much profit a farmer is making from the maximum possible profit using the same resources. Fig. 1 shows the pathways to profit efficiency of different maize-based practices: conventional tillage (CT), minimum tillage (MT), minimum tillage with crop rotation (MT-rot), minimum tillage with mulching (MT-mul), and minimum tillage with crop rotation and mulching (full CA).
Conceptual framework on pathways to profit efficiency.

Figure 1. Long description
The flowchart shows the linkages of CA adoption and profit efficiency.
A farmer’s decision about which farming practice to use during the farming season is motivated by the desire to optimize utility by considering profitability, yield, and soil health benefits (Ogieriakhi and Woodward, Reference Ogieriakhi and Woodward2022). However, this decision is also influenced by several factors. These include household and farm characteristics, institutional and environmental factors, and risk factors (Mulimbi et al., Reference Mulimbi, Nalley, Dixon, Snell and Huang2019; Simutowe et al., Reference Simutowe, Ngoma, Manyanga, Silva, Baudron, Nyagumbo, Kalala, Habeenzu and Thierfelder2024). Studies have shown that input requirements (seed, labor, fertilizer, herbicides, and pesticides) differ based on the choice of the farming system (see Thierfelder et al., Reference Thierfelder, Mhlanga, Nyagumbo, Kalala, Simutowe, Chiduwa, Maclaren, Silva and Ngoma2024b). For example, Montt and Luu (Reference Montt and Luu2019) found that labor requirements were lower under CA compared to CT.
A combination of farming system choice, input requirements, and other external factors such as climate determines the yield. The inputs are grouped under a production costs bracket (US$/ha). The product of maize yield and the market price per kg forms the revenue component. In line with the profit function approach in agriculture, profit is determined by the revenue minus production costs (Adnan et al., Reference Adnan, Sarker, Tama and Pooja2021). The inclusion of specific CA and CT practices reflects empirical evidence that differentiated practices have heterogeneous effects on costs and yields (Adam and Abdulai, Reference Adam and Abdulai2024). For example, CA could lower fertilizer expenses through improved soil health and nutrient recycling and improve farm revenues through increased and sustained yields (Devkota, Devkota and Kumar, Reference Devkota, Devkota and Kumar2022; Teng et al., Reference Teng, Hou, Dungait, Zhou, Kuzyakov, Zhang, Tian, Cui, Zhang and Delgado-Baquerizo2024).
A key contribution of this study is to go beyond profitability in maize-based smallholder farming systems and extend to profit efficiency and its determinants across different farm types. The conceptual framework provides a comprehensive foundation for developing the following hypotheses: H1: Adoption of CA practices increases profitability (gross margins) and profit efficiency of maize relative to CT; H2: Household and farm characteristics, institutional and environmental factors, and risk factors influence profit efficiency; and H3: Profit efficiency varies across different farm types.
The variables used as determinants of profit efficiency were chosen based on theory and previous studies on CA adoption and technical and profit efficiency in agriculture (e.g., Wongnaa, Awunyo-Vitor and Mensah (Reference Wongnaa, Awunyo-Vitor and Mensah2018), Simutowe et al. (Reference Simutowe, Ngoma, Manyanga, Silva, Baudron, Nyagumbo, Kalala, Habeenzu and Thierfelder2024), and (Ngeno, Reference Ngeno2024)).
Data and methods
Data sources and sampling strategy
We used household panel survey data from 1,938 household-level observations collected between 2021 and 2023 as part of the Sustainable Intensification of Smallholder Farming Systems (SIFAZ) project, implemented jointly by CIMMYT, the Food and Agriculture Organization of the United Nations (FAO), and the Ministry of Agriculture, Zambia. The survey covered districts in Eastern (Chipata, Lundazi, Sinda), Northern (Kasama, Mbala, Senga Hill), and Southern (Choma, Mazabuka, Monze) provinces, corresponding to Zambia’s three agro-ecological zones (AEZs) (Fig. 2). AEZ I covers some parts of the study areas in Southern province, and receives 600–800 mm of annual rainfall and has a growing season of 80–120 days. AEZ IIB covers all the study areas in Eastern province and some study areas in the Southern province, and receives 800–1,000 mm of annual rainfall, with a growing season lasting 100–140 days. AEZ III covers all the study areas in Northern province, and receives over 1,000 mm of annual rainfall, and enjoys a growing season of 120–160 days.
Interviewed households across all three waves.

Figure 2. Long description
The map uses a coordinate system with Latitude on the Y axis from 8 degrees South to 18 degrees South and Longitude on the X axis from 22 degrees East to 34 degrees East. A scale bar at the bottom indicates 600 kilometers. Red dots representing households are concentrated in four main regional clusters.In the North, clusters are located in Mbala, Senga Hill, and Kasama within the Northern Province.In the East, clusters are found along the border with Malawi at Lundazi, Chipata, and Sinda within the Eastern Province.In the South, a dense group of clusters is located in Mazabuka, Monze, and Choma within the Southern Province.A North arrow is located in the top-left corner, and a legend in the bottom-right identifies the red dots as Households.
Data collection followed a multistage sampling approach. First, 18 agricultural camps that hosted SIFAZ baby-and-mother trials were purposively selected. Within each camp, farm households were randomly selected from the Ministry of Agriculture registers, covering a 10–20 km radius around the trial sites. Equal proportions of trial and non-trial host farmers were included.
The same households were tracked across three waves of data collection. In wave 1, conducted between June and July 2021, a total of 678 households were interviewed. Wave 2 followed in May to June 2022, with 646 households reinterviewed. The final round took place from May to June 2023, with 614 households reinterviewed.
The household panel survey collected detailed data on a wide range of topics relevant to smallholder agricultural production and livelihoods. These included plot-level crop production and input use (e.g., seed, fertilizer, pesticide, herbicide, labor), technology adoption, access to extension services, and mechanization, as well as household demographics, income sources, livestock ownership, asset holdings, nutrition, and food security. The panel structure enables tracking changes in household behavior and performance over time, facilitating longitudinal analysis of adoption and profitability dynamics across different agroecological contexts. The analysis is restricted to farm plots that were not used as trial or demonstration sites under any project.
Assessment of profit efficiency
Profit efficiency is commonly assessed using Deterministic Frontier Analysis (DFA), Data Envelopment Analysis (DEA), and SFA (Knox Lovell, Reference Knox Lovell1996). DFA assumes all deviations from the efficiency frontier are due to inefficiency, making it simple to apply but unable to account for statistical noise (Ondrich and Ruggiero, Reference Ondrich and Ruggiero2001). This is a major drawback in agriculture, where external shocks like weather and pests are common (Shah et al., Reference Shah, Modi, Pandey, Subedi, Aryal, Pandey, Shrestha and Fahad2021; Mihrete and Mihretu, Reference Mihrete and Mihretu2025), potentially leading to overestimated inefficiency.
DEA, a nonparametric method using linear programming, is effective for benchmarking across farms without requiring a specific functional form (Mergoni, Emrouznejad and De Witte, Reference Mergoni, Emrouznejad and De Witte2025). However, like DFA, it cannot distinguish inefficiency from random shocks, limiting its reliability in volatile environments (Jordá, Cascajo and Monzón, Reference Jordá, Cascajo and Monzón2012). DEA is also sensitive to data quality and outliers, especially in small samples (Hughes and Yaisawarng, Reference Hughes and Yaisawarng2004; Chen and Johnson, Reference Chen and Johnson2010).
SFA, a parametric approach, separates deviations into inefficiency and random noise (Aigner, Lovell and Schmidt, Reference Aigner, Lovell and Schmidt1977; Campos et al., Reference Campos, Costa, Gontijo and Lopes-Ahn2022), making it well-suited for agriculture. It supports statistical inference and incorporates environmental and farmer-specific variables, enhancing policy relevance (Bala et al., Reference Bala, Shamsudin, Radam and Latif2018). Despite requiring assumptions about functional form and error distribution, its realism has made it the preferred method in agricultural efficiency studies (Kolawole, Reference Kolawole2006; Hyuha et al., Reference Hyuha, Bashaasha, Nkonya and Kraybill2007; Ansah, Oduro and Osae, Reference Ansah, Oduro and Osae2014; Wongnaa et al., Reference Wongnaa, Awunyo-Vitor, Mensah and Adams2019; Adnan et al., Reference Adnan, Sarker, Tama and Pooja2021; Akite et al., Reference Akite, Okello, Kasharu and Mugonola2022; Ngeno, Reference Ngeno2024; Mamashila and Antwi, Reference Mamashila and Antwi2025). In CA, SFA helps evaluate how well farmers convert inputs into profits, accounting for both prices and technical efficiency.
In Zambia, farm profitability varies due to differences in land quality, access to inputs, and market access. This underscores the need to assess how systems like CA and CT affect profit efficiency. Yet, most Zambian studies focus on technical rather than profit efficiency, leaving a gap in understanding returns on resource use (Chiona et al., Reference Chiona, Kalinda and Tembo2014; Musaba and Bwacha, Reference Musaba and Bwacha2014; Ng’ombe and Kalinda, Reference Ng’ombe and Kalinda2015; Abdulai and Abdulai, Reference Abdulai and Abdulai2016; Ng’ombe, Reference Ng’ombe2017).
Variables
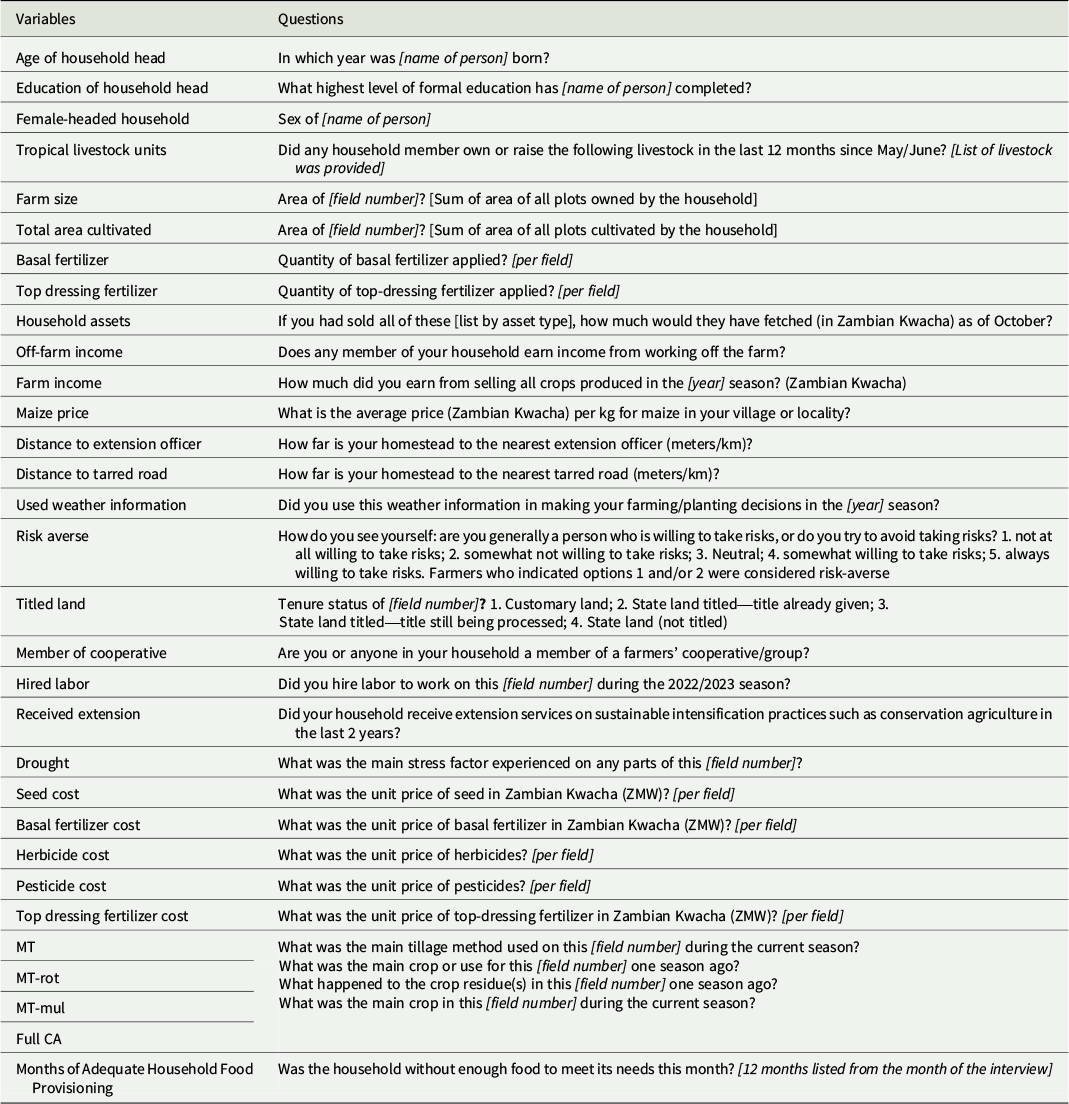
Table 1 shows the variables used in the study and their definitions, and Table A1 in the annex presents the variables and how the questions were framed in the questionnaire. All monetary values in this study are expressed in real terms (constant US$) using World Bank purchasing power parity (PPP) exchange rates.
Definitions of variables

Table 1. Long description
The table consists of two columns: Variables and Definitions.Key variables and their definitions include:* Age of household head: Age in years.* Education of household head: Total years of formal education.* Female-headed household: Binary (1 = yes).* Household size: Number of members.* Dependency ratio: Ratio of dependents (under 15 and over 64) to working-age members (15 to 64).* Tropical livestock units: Livestock converted to units where 1 T L U equals a 250 kg ruminant.* Farm size and Total area cultivated: Measured in hectares.* Crop diversification index: Simpson Diversity Index (S D I) from 0 to 1.* Total fertilizer: Sum of basal and top-dressing in kg/ha.* Maize yield: Average per plot in kg/ha.* Household assets: Total value in U S $.* Off-farm income: Binary (1 = yes).* Farm income: Total value of crops sold in U S $.* Commercialization index: Ratio of sales to production (0 to 1).* Maize price: Local price in U S $ per kg.* Distance to extension officer and tarred road: Measured in kilometers.* Used weather information: Binary (1 = yes).* Rainfall: Millimeters during agricultural season (October to May) from C H I R P S.* Risk averse: Binary (1 = yes) based on a five-point Likert scale.* Titled land, Member of cooperative, and Hired labor: Binary (1 = yes).* Received extension and Drought: Binary (1 = yes).* Economic metrics: Gross revenue, Seed cost, Basal fertilizer cost, Herbicide cost, Pesticide cost, Top dressing fertilizer cost, Labor cost, Total costs, and Gross margin, all measured in U S $ per hectare.* Conservation Agriculture practices: M T (minimum tillage), M T-rot (minimum tillage with rotation), M T-mul (minimum tillage with residue retention), and Full C A (all three practices combined), all binary (1 = yes).* Log: Natural logarithm transformation.* Months of Adequate Household Food Provisioning: Scale from 0 to 12 months.
* Variables used in the development of farmer typologies.
Empirical strategy
We adopted an integrated analytical framework that combines a panel probit model, gross margin analysis, panel SFA, and a panel tobit model. This sequential approach first identifies factors associated with CA adoption, then compares profitability between CT and CA systems, measures profit efficiency, and finally identifies the socioeconomic and farm-level factors driving efficiency differences. CA adoption in this paper refers to the use of MT with crop rotation and mulching (full CA) on non-trial/demonstration plots not supported by any external project. Because full CA adoption remains very low in Zambia, we also include minimum tillage alone (MT) and minimum tillage with either crop rotation (MT-rot) or mulching (MT-mul) as partial CA. We approach this as follows.
To determine the factors associated with adoption of CA, we used a panel probit model, which is ideal for estimating binary outcomes because it accounts for the nonlinear relationship between explanatory variables and the probability of CA adoption (Greene, Reference Greene2004).

where β are parameters to be estimated using maximum likelihood, ɸ is the standard normal cumulative distribution function, X is a vector of regressors that influence adoption,
 is the response variable at time t, and t is the time period. The probit model can be motivated by a latent-variable framework (Equation 2).

where
$ \varepsilon \sim N\left(0,1\right) $
 and
$ {Y}_i $
 is the dependent variable. Equation 3 shows an estimable econometric specification of Equation 2.

where
$ {CA}_{ijt} $
 is the dependent variable measuring adoption of CA (MT, MT-rot, MT-mul, and full CA) (yes = 1) for household i, practice j, at time t.
To evaluate the economic performance of these two systems, we conducted a gross margin analysis, which monetizes and aggregates all relevant costs and benefits per hectare. We calculated average per-hectare input costs for each plot/field at the price farmers paid for the inputs. Where inputs were gifts or received through government subsidies, we used local/village prices. For revenue, we used local/village crop prices at which farmers sold the crops. This ensured our analysis aligned with local conditions. We also used average labor prices for each system based on data collected from on-farm trials in the same study sites. This approach follows established methodologies from previous studies on farming system profitability (CIMMYT, Reference Mexico1988; Mutenje et al., Reference Mutenje, Farnworth, Stirling, Thierfelder, Mupangwa and Nyagumbo2019). The gross margins (GM) were calculated for 2020/2021, 2021/2022, and 2022/2023 farming seasons by aggregating the total revenue (TR) and subtracting the corresponding total costs (TC), as shown in Equation (4):

where
$ {GM}_{it} $
 is the gross margin from maize production by CT and CA practice per hectare for farmer
$ i $
 at time
$ t $
 ,
$ {TR}_{ijt} $
 is total revenue from maize by CT and CA practice per hectare (product of total yield by unit prices (US$/ha)), and
$ {TC}_{ijt} $
 is the total cost of maize production per hectare under CT and CA practices (seed, fertilizers, labor, herbicides, and pesticides).
We used a panel SFA to assess the profit efficiency of CT- and CA-maize-based systems (Equation 5). The SFA has been used to determine the technical and profitability efficiency of farming systems (Belete, Reference Belete2020; Yasin et al., Reference Yasin, Ullah, Ali and Munir2024). The stochastic frontier model provides a method to estimate efficiency scores while accounting for random shocks and inefficiencies in production (Kumbhakar, Wang and Horncastle, Reference Kumbhakar, Wang and Horncastle2015; Abdulai and Abdulai, Reference Abdulai and Abdulai2016).

where
$ {\pi}_{it} $
 is the profit of household i in period t,
$ {v}_{ii}\sim N+\left(0,{\sigma}_{{\mathrm{v}}_{it}}^2\right) $
 and
$ {u}_{it} $
 is the profit inefficiency term (
$ {u}_{it} $
 ≥
$ 0 $
 ). The inefficiency model explains how farm and household characteristics influence the variance of the profit inefficiency term (Equation 6).

Profit efficiency is derived from Equation 7.

where
$ {PE}_{it} $
 is the profit efficiency of farm i (ranges from 0 to 1) at time t,
$ {\pi}_{it} $
 is the observed profit of farm i,
$ {\pi}_{it}^{\ast } $
 is the frontier (maximum attainable) profit, and
$ {u}_{it} $
 is a nonnegative inefficiency term (
$ {u}_{it}\ge 0\Big) $
 .
We used a panel tobit model to identify the determinants of profit efficiency intensity across CT and CA maize-based farming practices (Equation 8).

where
$ {PE}_{it} $
 is profit efficiency.
Farmer typologies
We conducted a farmer typology grouping to help classify farmers into distinct groups based on their socioeconomic, production, and resource characteristics using Principal Component Analysis (PCA) with 19 variables (Table 1, with asterisk). We first constructed a pairwise correlation matrix to examine associations among variables. The results show that no pairwise correlation exceeded 0.8, indicating that multicollinearity was not a concern (Fig. 3). Therefore, the observed correlation structure supported using PCA.
Pairwise correlation matrix.

Figure 3. Long description
A triangular pairwise correlation matrix with 19 variables listed on both the vertical Y axis and the top diagonal X axis. A vertical color bar on the right scales from negative 1 in dark red to 0 in white and positive 1 in dark blue.
However, the pairwise correlation matrix alone is not enough to justify using PCA. We further conducted Kaiser–Meyer–Olkin (KMO) and Bartlett’s tests to assess the appropriateness of the data for dimensionality reduction. We found the KMO statistic of 0.65, suggesting acceptable sampling adequacy. KMO uses different scales for assessing sampling adequacy. Further, Bartlett’s test of sphericity was highly significant (χ2 = 3723.08, p-value = 0.00, df = 190.00), rejecting the null hypothesis that the correlation matrix is an identity matrix. These results confirmed that PCA was appropriate for identifying farmer typologies.
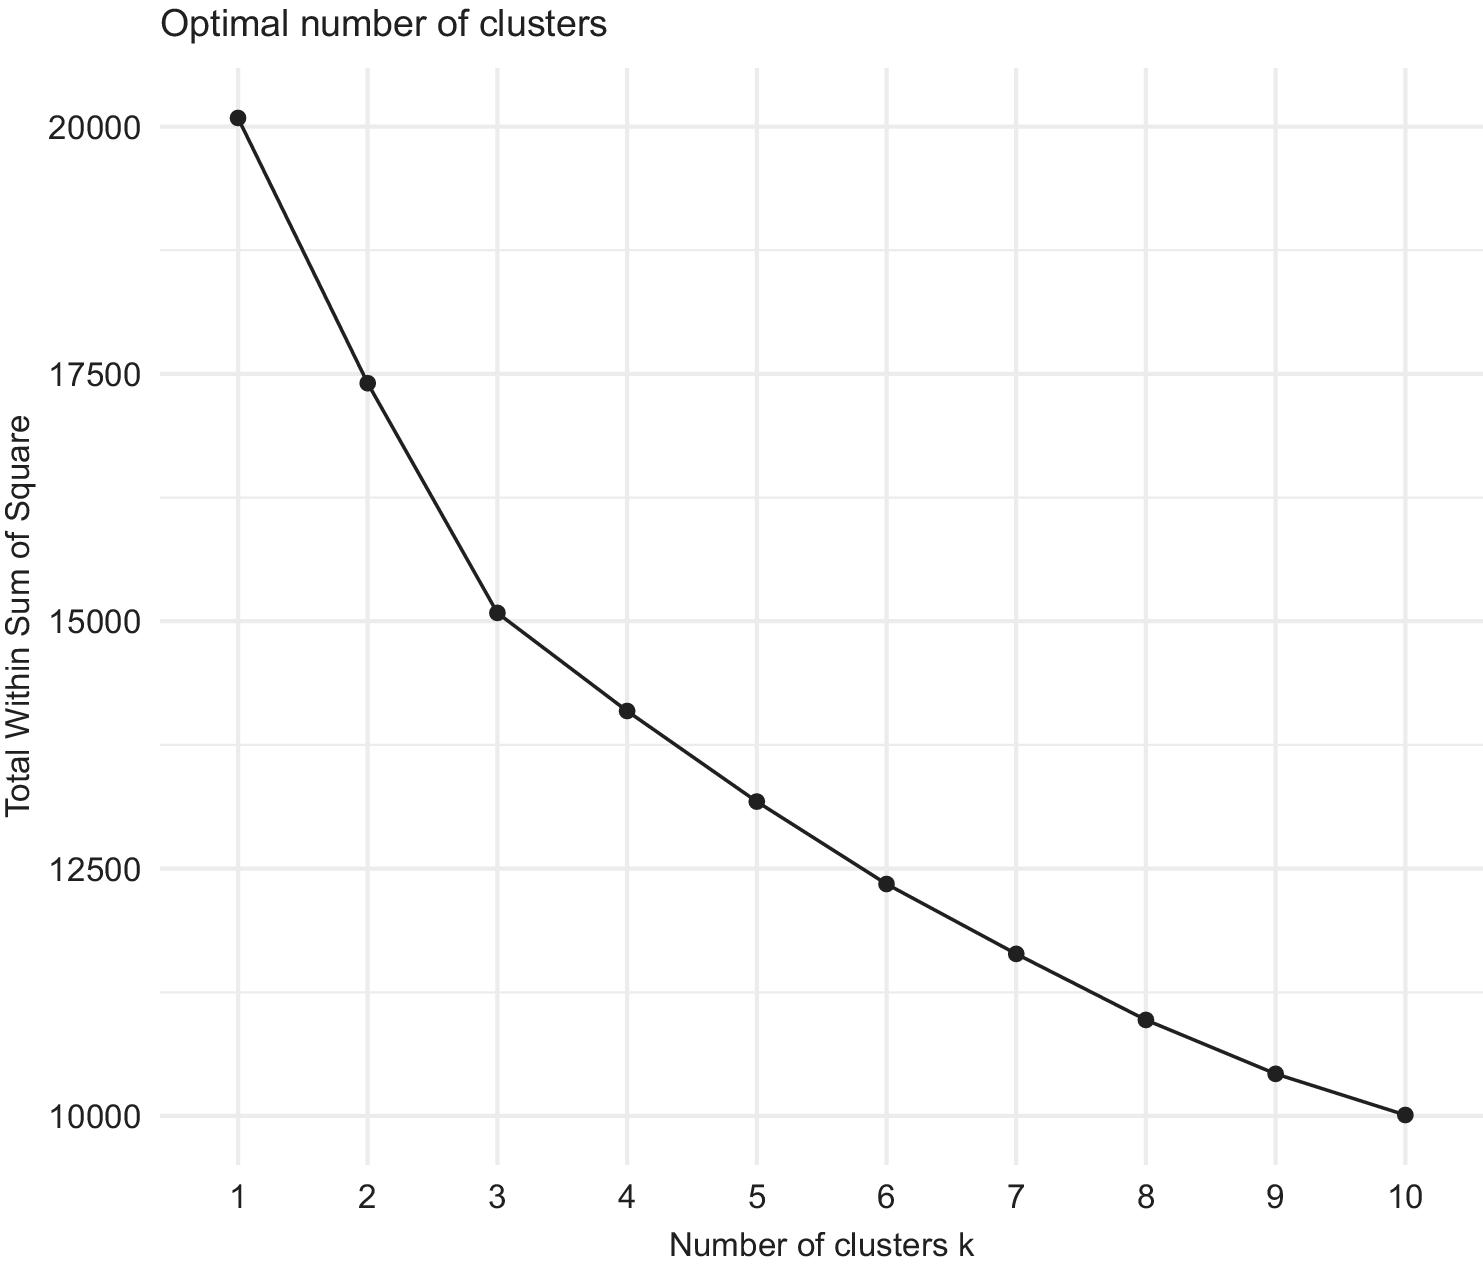
We selected three clusters using the elbow method (Fig. 4) and then conducted K-means clustering on the PCA-transformed data (Permadi, Tahalea and Agusdin, Reference Permadi, Tahalea and Agusdin2023). The elbow point is where the curve begins to flatten out, 3 in our case. The clusters represent the three different farmer typologies used in this study: Types 1, 2, and 3. Farmer typologies are important for developing tailored agricultural interventions. They allow grouping of farmers with similar characteristics to help reduce the complexity of farmer characteristics by describing heterogeneity in farmers concisely (Huber et al., Reference Huber, Bartkowski, Brown, El Benni, Feil, Grohmann, Joormann, Leonhardt, Mitter and Müller2024; Václavík et al., Reference Václavík, Beckmann, Bednář, Brdar, Breckenridge, Cord, Domingo-Marimon, Gosal, Langerwisch, Paulus, Roilo, Šarapatka, Ziv and Čejka2024).
Elbow method for optimal number of clusters.

This categorization helps explain different farming profiles and their economic viability, informing policies and support programs tailored to each farmer typology. Table 2 shows the sample characteristics by farmer type. Type 1 farmers comprised 34.16% of the sample. They had small farms and the lowest yields. This type was also characterized by low household asset values, low farm income, and a low household commercialization index. Type 1 farmers were more risk-averse, less educated, less productive, and had the highest number of female-headed households (24.47%). Type 2 farmers (20.43% of the sample) were productive, wealthy, educated, and market-oriented. These farmers owned large farms and sold 74% of their produce. Meanwhile, Type 3 farmers were a bridge between Type 1 and Type 2 farmers. These farmers had moderate household assets and farm income and sold three-quarters of their crop production.
Summary statistics of the sample

Table 2. Long description
The table presents summary statistics of the sample divided into farmer typologies.
Household heads under Type 2 (50 years) were older than those under Type 1 (43 years) and Type 3 (48 years), respectively. On average, household heads were 46 years old (Table 2). Male-headed households accounted for 83.80% of households, and the average household size was seven members. However, 94.19% of Type 2 households were male-headed, compared with 75.53% and 85.34% in Type 1 and Type 3 households, respectively (Table 2). Type 2 farmers had larger families with an average household size of 10 members. On average, household heads had at least completed primary education (7 years).
Farm size averaged 4.95 hectares (3.07 hectares among Type 1 farmers, 8.48 hectares among Type 2 farmers, and 4.78 hectares among Type 3 farmers). Only 10.22% of the households owned titled land. Low ownership of titled land, especially among Type 1 and 3 farmers, may explain the low adoption of CA practices. For example, Nkomoki, Bavorová and Banout (Reference Nkomoki, Bavorová and Banout2018) found that farmers with secure land tenure adopt sustainable agricultural practices more than those with customary land tenure. Type 2 farmers had the highest ownership of titled land. Specifically, 26.52% of Type 2 farmers owned titled land, compared to 8.16% of Type 1 and 4.43% of Type 3 farmers. In addition, Type 2 farmers had more assets (US$6,230.19) and livestock than Type 1 and Type 3 farmers. Almost all sampled households (98.35%) grew maize, with an average yield of 2515.67 kg/ha.
About 70% of sampled households used weather-related information. Usage was lower among Type 1 and Type 3 farmers (61.93% and 68.41%, respectively) and highest among Type 2 farmers (85.61%). In addition, 80% of the farmers belonged to farmer cooperatives. The high number of farmers being members of cooperatives could be driven by the requirement for farmers to be members of cooperatives to access government input support (subsidy) through the FISP (Mason, Jayne and Mofya-Mukuka, Reference Mason, Jayne and Mofya-Mukuka2013; Blekking et al., Reference Blekking, Gatti, Waldman, Evans and Baylis2021). This may also explain why cooperative membership has increased over the years, from 75.96% in 2021 to 83.71% in 2023, as more farmers seek access to FISP.
These characteristics enabled us to classify farmers into three types: Type 1 (asset- and income-poor), Type 2 (asset- and income-rich), and Type 3 (asset- and income-moderate). We largely defined farmer types by tropical livestock units, farm size, household assets, and both farm and non-farm income.
Results and discussion
Adoption of CA practices and maize yields
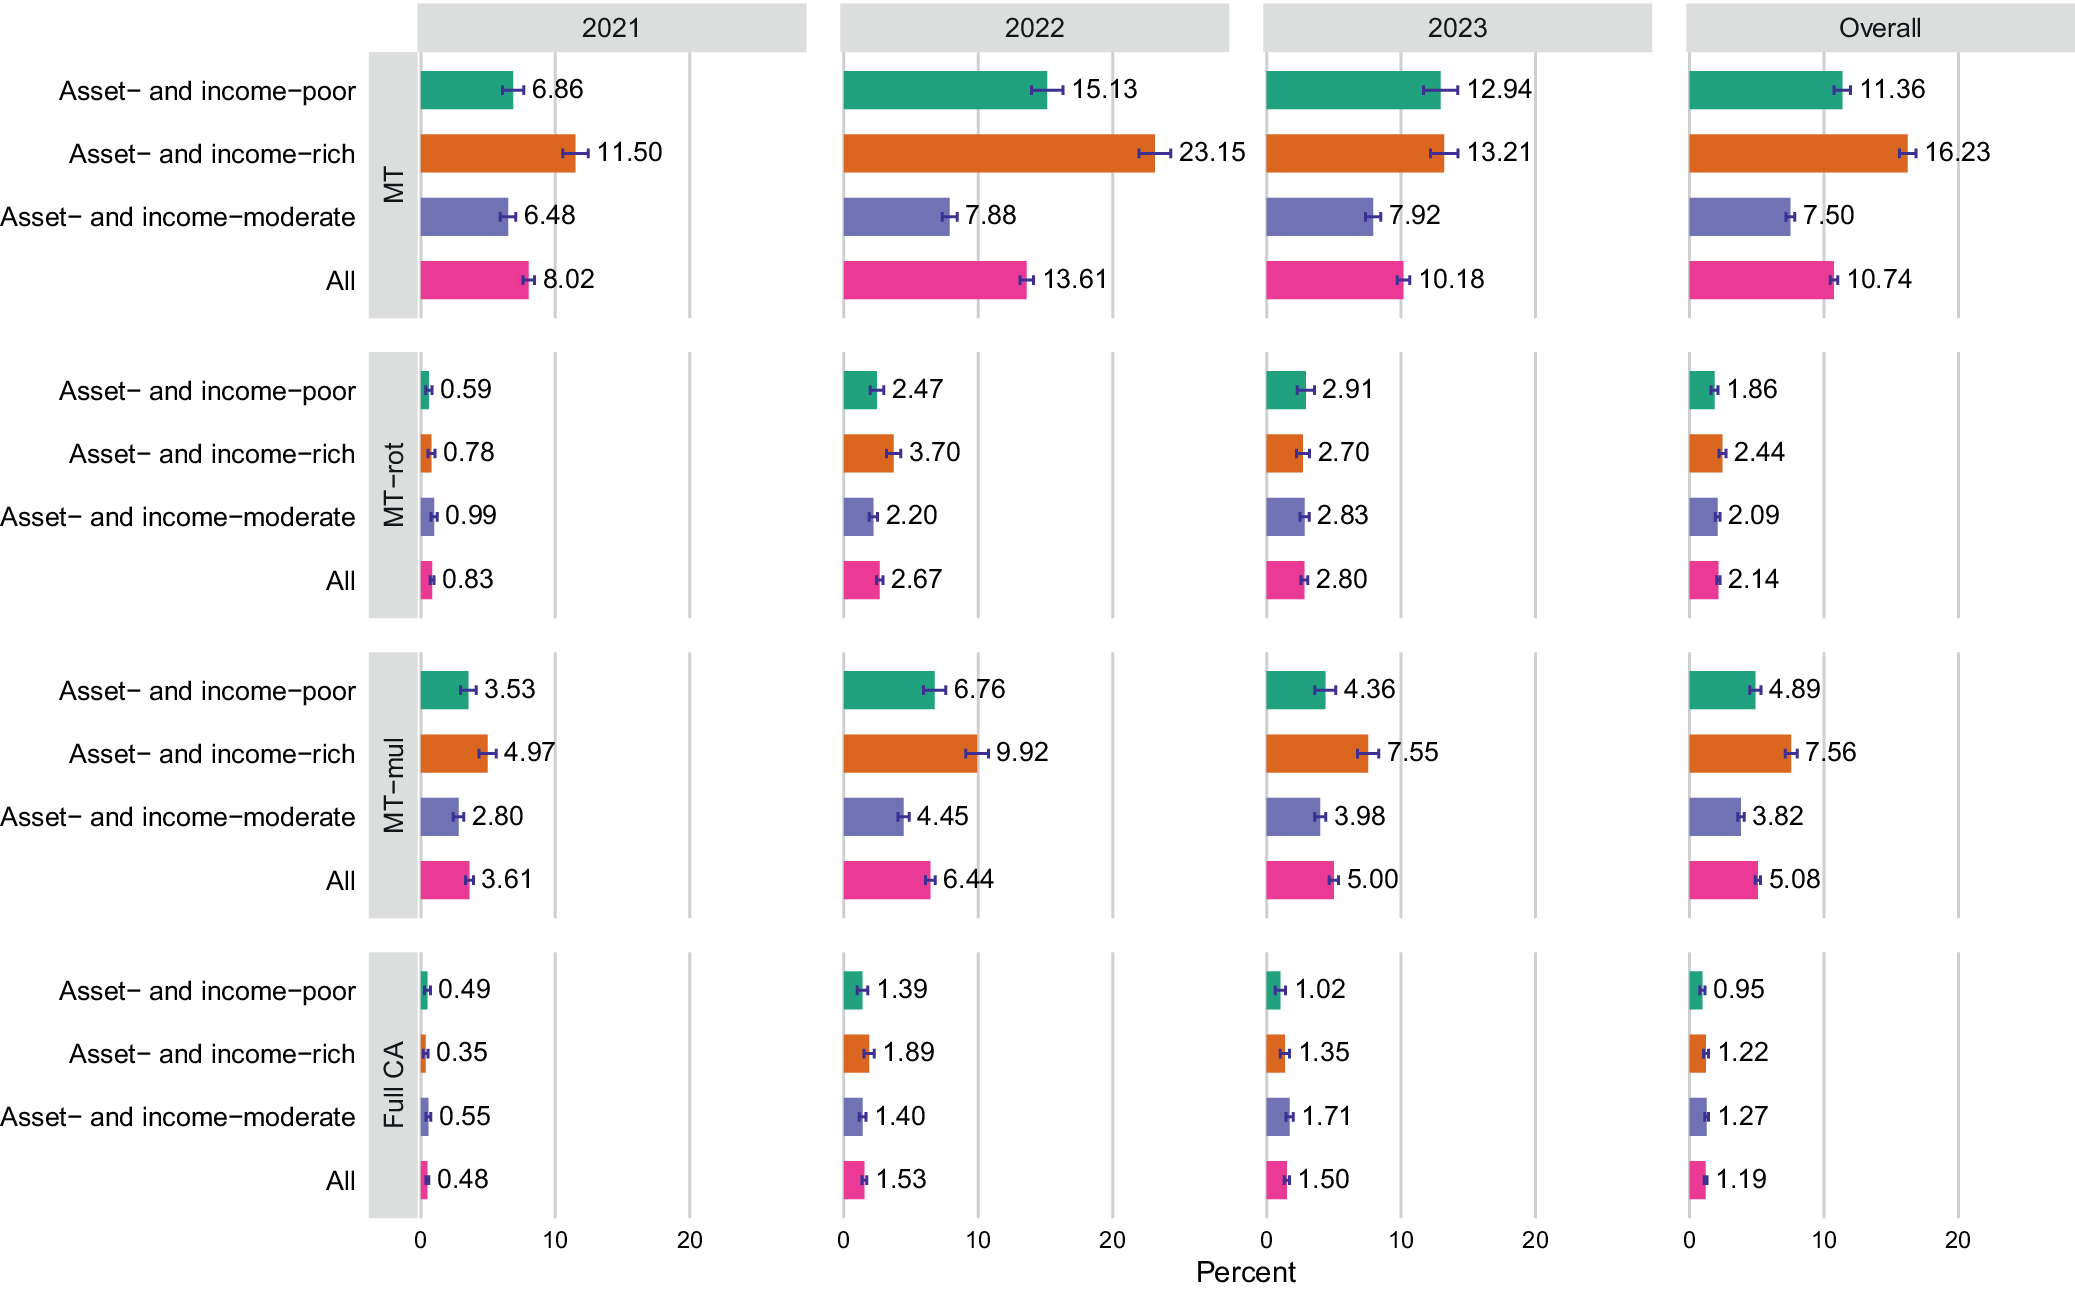
Asset- and income-rich farmers adopted all four CA practices at higher rates than asset- and income-poor and asset- and income-moderate farmers (Fig. 5). The low adoption rate by asset- and income-poor farmers, who are also more risk-averse, is supported by findings from studies which show that risk aversion negatively affects adoption of agricultural technologies (Nainggolan, Moeis and Termansen, Reference Nainggolan, Moeis and Termansen2023; Simutowe et al., Reference Simutowe, Ngoma, Manyanga, Silva, Baudron, Nyagumbo, Kalala, Habeenzu and Thierfelder2024). These findings indicate that targeted strategies could play a pivotal role in reducing perceived risks and promoting wider adoption of CA practices.
Adoption of CA practices by farmer typology, 2021–2023.

Figure 5. Long description
The graph shows CA practice adoption rates for 2021, 2022, and 2023. The adoption rates are also disaggregated by farmer typologies.
We used a panel-data probit model to analyze the determinants of CA adoption. Results in Table 3 suggest that the household head’s education level was associated with a 0.9 percentage-point increase in the likelihood of adopting MT. Access to extension services was associated with a 9.1 percentage-point increase in the likelihood of adopting MT, a 4.4 percentage-point increase in MT-rot, a 10.3 percentage-point increase in MT-mul, and a 3.5 percentage-point increase in full CA. Previous literature has also found that access to extension services is associated with an increased likelihood of CA adoption (Simutowe et al., Reference Simutowe, Ngoma, Manyanga, Silva, Baudron, Nyagumbo, Kalala, Habeenzu and Thierfelder2024; Qange et al., Reference Qange, Mdoda, Nontu, Mabitsela and Gidi2025). These results strengthen the assertion that access to agricultural extension services is key to increasing CA adoption. Usage of weather information was associated with a 5.0 percentage-point increase in the likelihood of adopting MT, a 5.6 percentage-point increase in MT-rot, a 6.8 percentage-point increase in MT-mul, and a 4.0 percentage-point increase in full CA. This confirms findings by Ngoma et al., (Reference Ngoma, Manyanga, Mulungu, Simutowe, Kazekula, Subakanya, Mhlanga, Krupnik, Marenya, Thierfelder and Program2025a, Reference Ngoma, Simutowe, Silva, Nyagumbo, Kalala, Habeenzu and Thierfelder2025b), who found that rainfall forecasts predicting low rainfall are associated with an increased likelihood of farmers adopting CA. Furthermore, household asset value was associated with an increased likelihood of adopting MT, MT-rot, and MT-mul, though the percentage points are small. Other factors associated with adoption of CA practices were household size (+), farm size (−), cooperative membership (−), and ownership of titled land (+). The results in Table 3 underscore the importance of considering social, economic, and institutional factors in promoting CA.
Factors associated with adoption of CA practices

Table 3. Long description
The table shows the results of the probit model outlining factors associated with the adoption of CA.
Note: t-statistics in parentheses.
***p < 0.01; **p < 0.05; *p < 0.1.
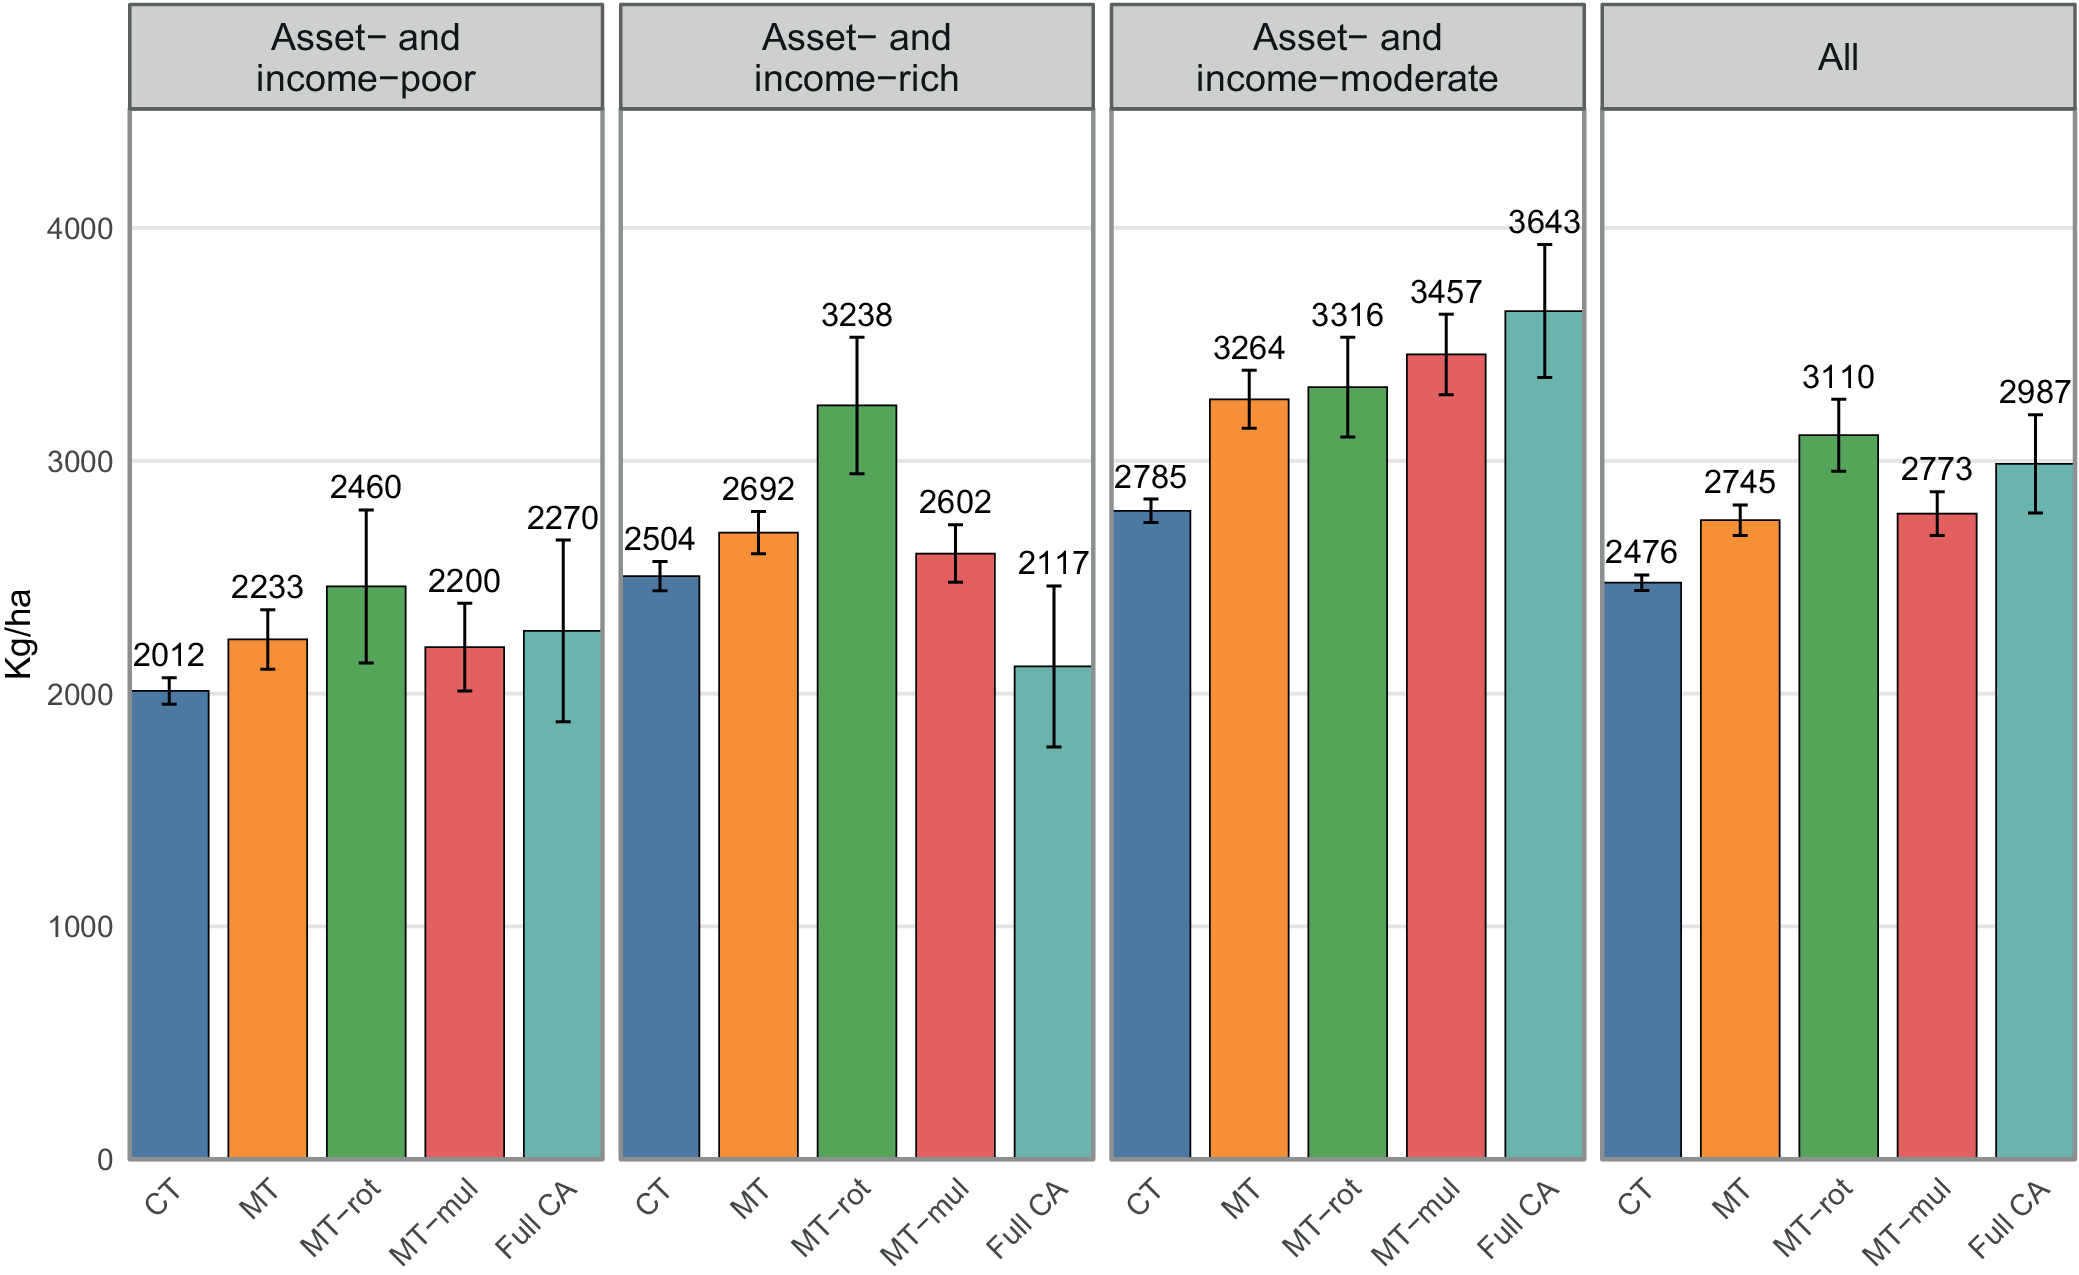
The results show that all CA practices had higher maize yield than CT (Fig. 6). MT-rot produced the highest average maize yield (3,110 kg/ha), while CT had the lowest (2,476 kg/ha). Similar results were reported by Mwila et al. (Reference Mwila, Silva, Kalala, Simutowe, Ngoma, Nyagumbo, Mataa and Thierfelder2024), indicating higher maize yields from diversified cropping systems with legume rotation. The increase in maize yield can be attributed to increased soil nutrient availability (especially nitrogen) from legumes (Zhang et al., Reference Zhang, Baoyin, Cui, Ma, Zhao, Wang, Duan and Li2025). This positions CA practices as viable instruments of soil and environmental sustainability among smallholders. Results also show that asset- and income-moderate farmers had the highest maize yields, while asset- and income-poor farmers had the lowest (Fig. 6). Maize yield results by farmer type also correspond with fertilizer usage, i.e., asset- and income-moderate farmers used more fertilizer, followed by asset- and income-rich farmers. Asset- and income-poor farmers used the least fertilizer. These results demonstrate that fertilizer plays a major role in maize yields among smallholders in Zambia. Further, they underscore the need for soil nutrient-enhancing practices, such as CA, to sustain yields.
Maize yields by farmer typology, kg/ha.

Figure 6. Long description
The chart shows maize yields (kg/ha) across different farmer typologies and practices.
Gross margins of conventional and conservation maize-based practices
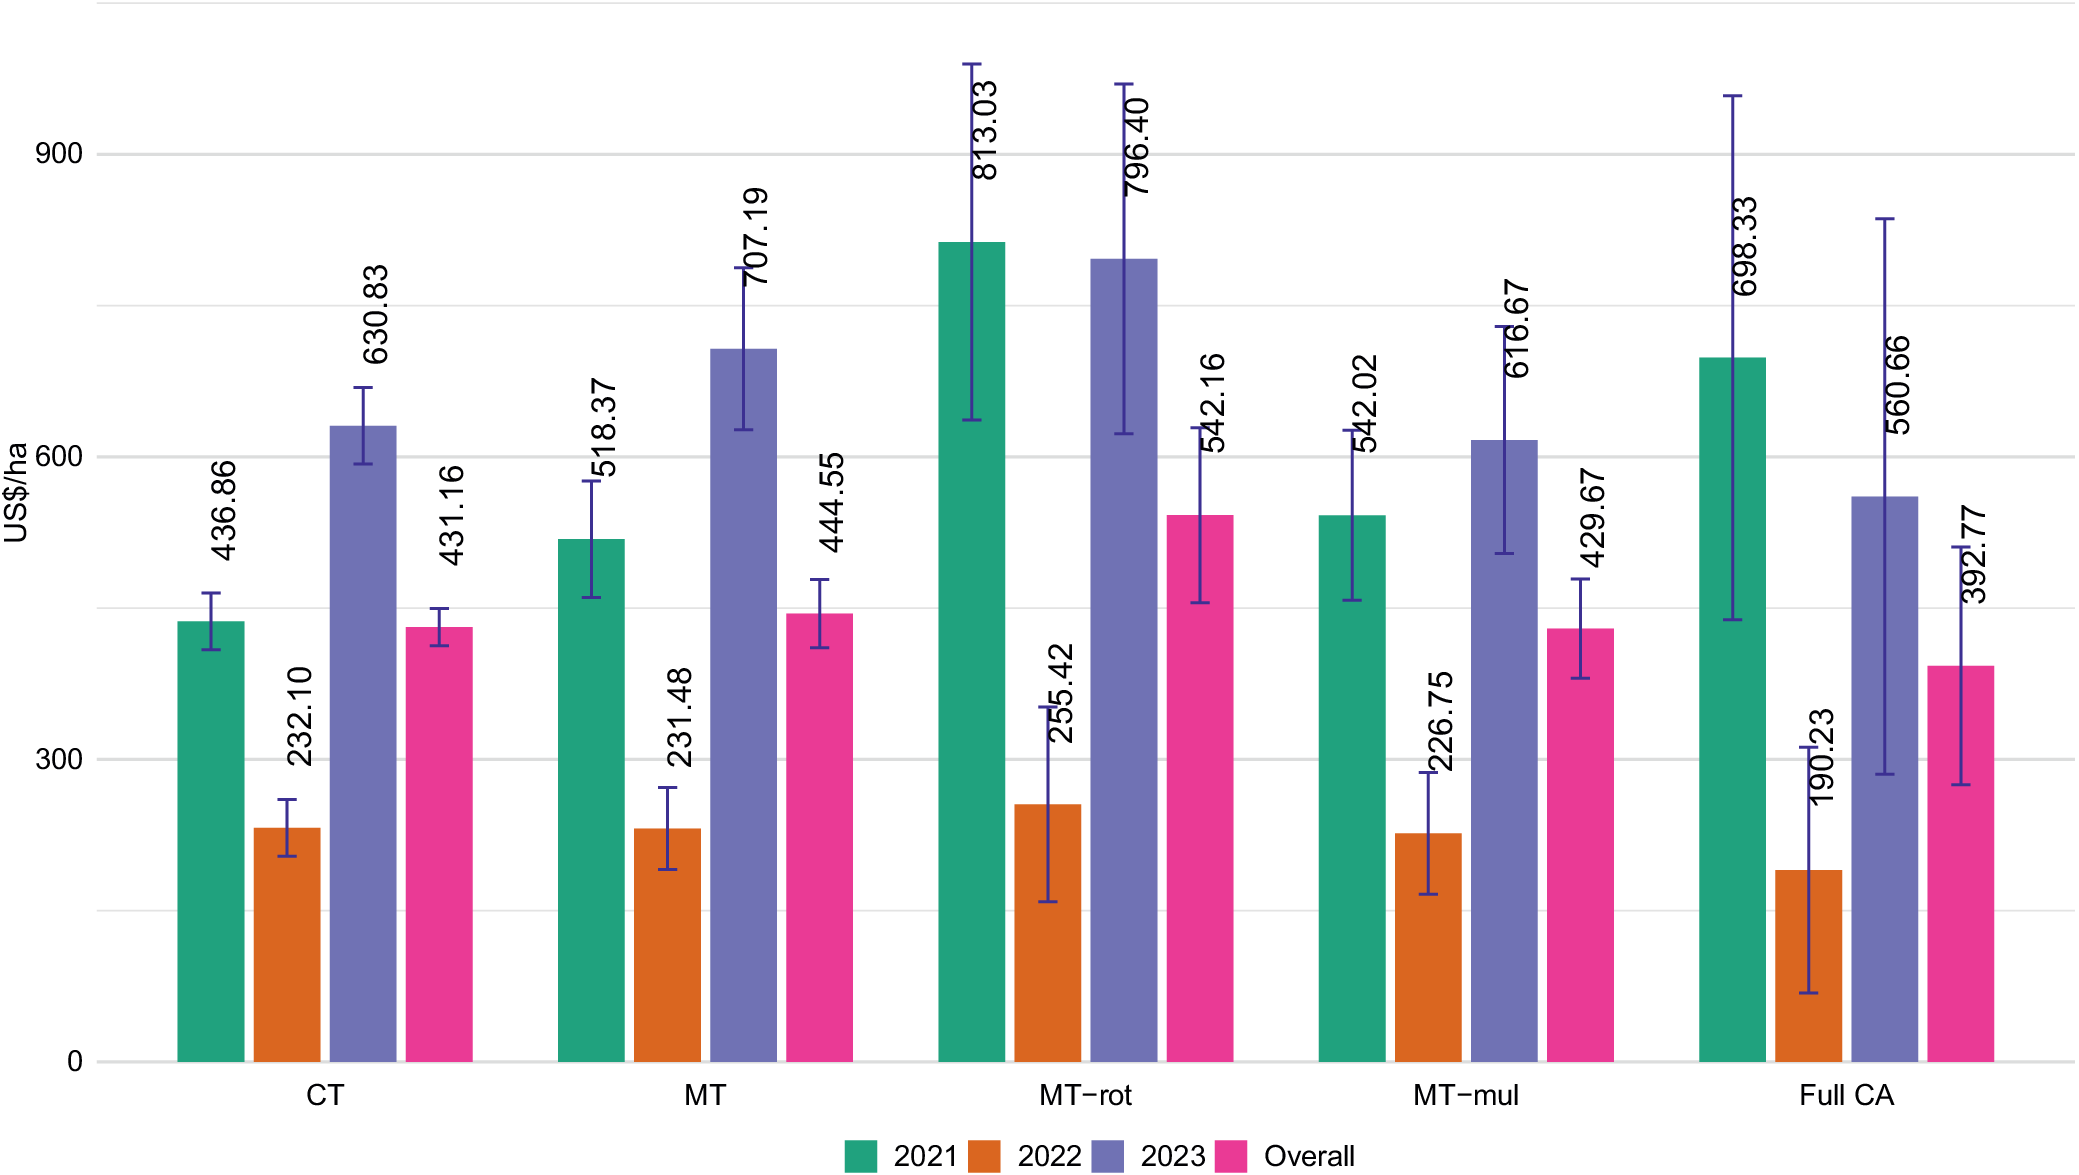
Gross margins were used to assess the economic performance of maize under CT and CA practices. Gross margin results show that MT and MT-rot practices were more profitable than CT (Fig. 7). These results align with previous studies; for example, Akplo et al. (Reference Akplo, Yemadje, Imorou, Sanni, Boulakia, Sekloka and Tittonell2025) found that maize grown under MT practices had higher gross margins than CT methods in Benin’s Angaradébou region. Furthermore, Saldivia-Tejeda et al. (Reference Saldivia-Tejeda, Uribe-Guerrero, Rojas-Cruz, Guera, Verhulst and Fonteyne2024) noted that each CA component offers greater potential benefits than CT. Higher gross margins from CA practices such as MT and MT-rot are a key pathway to improving economic sustainability among smallholders in Zambia who depend on agriculture for their livelihoods. This can be achieved through increased yields, as evidence shows that there is a huge maize yield gap (7,000 kg/ha) among farmers in Zambia (Silva et al., Reference Silva, Baudron, Ngoma, Nyagumbo, Simutowe, Kalala, Habeenzu, Mphatso and Thierfelder2023). Silva et al. (Reference Silva, Baudron, Ngoma, Nyagumbo, Simutowe, Kalala, Habeenzu, Mphatso and Thierfelder2023) highlighted the need for production-efficient methods to increase yields. Based on this, CA is one method that can increase yields.
Gross margins of different maize-based systems per practice (US$/ha), 2021–2023.

Figure 7. Long description
The Y-axis represents gross margins (US$/ha) ranging from 0 to 900. The X-axis lists five agricultural practices. Each practice has four bars: green for 2021, orange for 2022, purple for 2023, and pink for the overall average. Blue error bars indicate variability.
A closer look at gross margins also reveals that maize under minimum tillage with rotation had the highest gross margins of 542.16 US$/ha compared to CT’s 431.16 US$/ha (Fig. 7). This is attributed to yield gains in the maize phase of maize-legume rotations, with (Thierfelder et al., Reference Thierfelder, Cheesman and Rusinamhodzi2012) reporting 47–136% higher yields in a three-year rotation (maize–cotton–Sunnhemp) compared to CT systems. The lower gross margins under CT reflect well-documented yield penalties from soil degradation and erosion under intensive tillage and confirm the finding by Lorenzetti and Fiorini (Reference Lorenzetti and Fiorini2024) that CA practices are more profitable than CT. These results underscore CA practices’ potential not only to enhance farm profitability but also to promote sustainable intensification, offering a viable pathway to improve farmer resilience and long-term soil productivity.
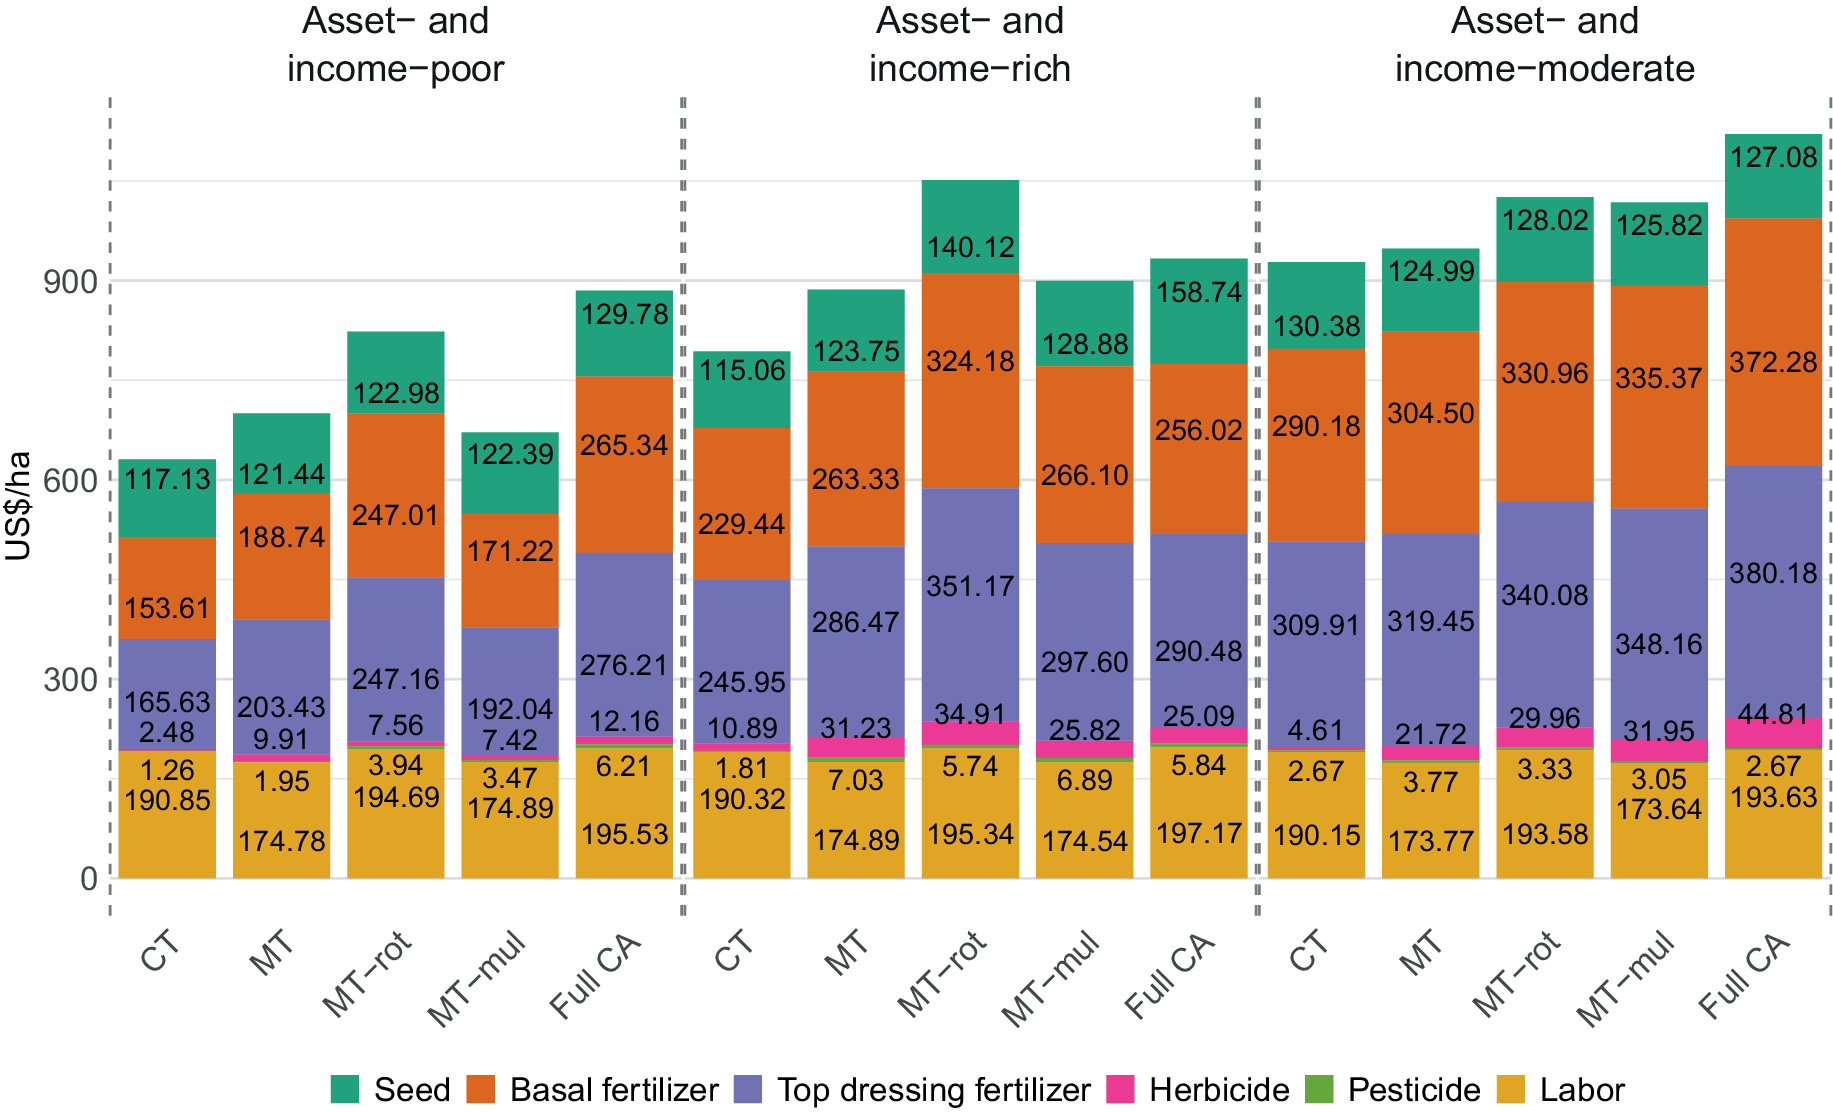
For more insight into costs and gross margins, Figs. 8 and 9 and Tables 4–6 present gross margin comparisons across five maize-based farming systems by farmer typology. A detailed cost analysis shows substantial differences in input costs across maize-based systems, farmer typologies, and years. Seed costs were relatively consistent (117 US$/ha to 140 US$/ha), but basal fertilizer costs varied widely, with the highest under full CA for asset- and income-moderate farmers (372.28 US$/ha). Asset- and income-poor farmers exhibited lower input spending (e.g., 153.61 US$/ha on basal fertilizer under CT), which is mirrored by lower revenue (Table 4), possibly indicating underinvestment. Herbicide costs varied widely from 2.48 US$/ha (asset- and income-poor farmers, under CT) to 44.81 US$/ha (asset- and income-moderate farmers, under full CA), reflecting differing weed pressure and management strategies. This shows that profitability hinges not just on input reduction but also on effective input levels and combinations (Akite et al., Reference Akite, Okello, Kasharu and Mugonola2022). The consistent labor costs across CA systems suggest that labor is a significant factor in farming, regardless of the cultivation method. For example, labor costs ranged from 173.64 to 197.17 US$/ha for CA systems and 190.15 to 190.85 US$/ha for CT. However, labor costs were lowest under MT and highest under full CA. We found that herbicides accounted for a larger share of costs in CA systems than in CT. This is similar to findings by Montt and Luu (Reference Montt and Luu2019) on higher labor costs under CA. This is because minimizing tillage reduces labor in the early stages of the season but later increases it at harvest and postharvest due to higher yields. These findings underscore the importance of cost management in determining the overall profitability of maize production among smallholder farmers (Dalzotto Artuzo et al., Reference Dalzotto Artuzo, Rogério Foguesatto, De Souza and Xavier da Silva2018).
Average costs of CT and CA maize-based practices by farmer typologies.

Figure 8. Long description
The chart uses a y-axis representing US$ per hectare from 0 to 900. The x-axis lists five practices for each group: CT, MT, MT-rot, MT-mul, and full CA. A legend at the bottom identifies six cost components: Labor (yellow), pesticide (light green), herbicide (pink), top dressing fertilizer (purple), basal fertilizer (orange), and seed (dark green).
Average gross margins of CT and CA maize-based practices by farmer typologies.

Figure 9. Long description
The chart consists of panels arranged in a 5 by 3 grid. The vertical axis for each panel lists four categories: Gross revenue (green), input costs (purple), labor costs (dark grey), and gross margin (orange). The horizontal axis represents value(US$/ha).
Gross margins of different conventional and CA maize-based practices by year, asset- and income-poor farmers

Table 4. Long description
The table presents gross margins (US$/ha) across different practices and years for asset- and income-poor farmers.
Source: SIFAZ 2021, 2022, and 2023 surveys.
Gross margins of different conventional and CA maize-based practices by year, asset- and income-rich farmers

Table 5. Long description
The table presents gross margins (US$/ha) across different practices and years for asset- and income-rich farmers.
Source: SIFAZ 2021, 2022, and 2023 surveys
Gross margins of different conventional and CA maize-based practices by year, asset- and income-moderate farmers

Table 6. Long description
The table presents gross margins (US$/ha) across different practices and years for asset- and income-moderate farmers.
Source: SIFAZ 2021, 2022, and 2023 surveys.
Asset- and income-moderate farmers had the highest gross margins across all farming practices. Further, asset- and income-poor farmers had the lowest gross margins across all farming practices, except for full CA. MT-mul had the highest gross margins for asset- and income-moderate farmers (765.97 US$/ha), minimum tillage with rotation for asset- and income-rich farmers (514.22 US$/ha), and MT for asset- and income-poor farmers (311.46 US$/ha) (Fig. 9). Integrating crop rotation with minimum tillage (and mulching for full CA) appears to optimize resource use and improve soil health, leading to higher yields and economic returns. This aligns with existing literature emphasizing the benefits of diversified crop rotations in enhancing agricultural productivity and sustainability (Shah et al., Reference Shah, Modi, Pandey, Subedi, Aryal, Pandey, Shrestha and Fahad2021). The variability in economic outcomes across farmer typologies aligns with the concerns raised by Andersson and D’Souza (Reference Andersson and D’souza2014) about the need to understand farmer-typology-specific farm-level constraints rather than treating all farmers as being the same. Further, the poor performance of asset- and income-rich farmers under full CA contrasts with relatively better results under CT and partial CA, contradicting the views of Pannell et al. (Reference Pannell, Llewellyn and Corbeels2014) that CA performs well and is attractive to well-resourced farmers, and emphasizes recommendations by Giller et al. (Reference Giller, Witter, Corbeels and Tittonell2009) against a uniform promotion of CA practices, as it may not suit all farming contexts. This also concurs with Thierfelder et al. (Reference Thierfelder, Matemba-Mutasa, Bunderson, Mutenje, Nyagumbo and Mupangwa2016b), who note that the benefits of CA are context-specific and may also vary with seasonal conditions and agroecology.
We must, however, mention that the results for full CA are based on a very small sample and must be interpreted with caution. Nevertheless, these findings underscore the importance of tailoring CA practices to specific farmer typologies, rather than promoting a one-size-fits-all approach. It is crucial to recognize and address the diverse resource capacities and constraints of different farmer typologies. Doing so can maximize both agronomic and economic benefits, while enhancing the sustainability and inclusivity of agricultural interventions.
Efficiency of conventional and conservation maize-based practices
This section presents results on the profit efficiency of CA- and CT-based maize systems. Profit efficiency is the extent to which a farmer attains the maximum profit, given prevailing input and output prices and the fixed resources of the farm (Ali and Flinn, Reference Ali and Flinn1989). We estimated the profit efficiency of maize farmers adopting CT and CA practices using a panel SFA.
The results in Table 7 reveal the following main points. First, labor cost was associated with reduced profit efficiency under CT (statistically significant at 5%), minimum tillage (statistically significant at 1%), and MT-mul and MT-rot (both statistically significant at 10%). This shows that CA does not always yield positive profitability outcomes. Yet, other research demonstrates that reducing tillage can substantially lower labor and operational costs, thereby enhancing the suitability of CA for smallholder farmers in developing countries (Thierfelder et al., Reference Thierfelder, Bunderson, Jere, Mutenje and Ngwira2016a; Pearsons et al., Reference Pearsons, Chase, Omondi, Zinati, Smith and Rui2023; Lorenzetti and Fiorini, Reference Lorenzetti and Fiorini2024). These results suggest that while CA may reduce physical labor, this does not automatically lead to higher profit efficiency. To secure sustainable economic gains for smallholder farmers, interventions promoting CA should also aim to improve labor efficiency and productivity across agricultural activities.
Stochastic frontier estimates of maize profitability under CT and CA tillage systems

Table 7. Long description
The table consists of six columns. The first column lists the variables, and the subsequent five columns represent the tillage systems. For each variable, the first row provides the coefficient and the second row provides the standard error.
Note: Standard errors in parentheses.
***p < 0.01; **p < 0.05; *p < 0.1.
Secondly, fertilizer costs were consistently and significantly negatively associated with maize profit efficiency across all CA and CT practices (Table 7). These results are consistent with the study by (Wongnaa et al., Reference Wongnaa, Awunyo-Vitor, Mensah and Adams2019), which found that fertilizer costs were negatively associated with maize farmers’ profitability in Ghana. This implies that while fertilizer remains a crucial input for productivity, its cost may offset profitability when not managed efficiently, even within CA systems. It is therefore important to incorporate alternative soil fertility management practices such as organic fertilizer, green manure, and legume diversification into CA to enhance economic returns. This aligns with findings by Nezomba et al. (Reference Nezomba, Mtambanengwe, Rurinda and Mapfumo2018), who highlighted that the use of integrated soil fertility management practices provides positive economic returns and lower economic risks. These findings show the need for policy and extension services to promote cost-effective soil fertility strategies. Reducing dependence on expensive mineral fertilizers through integrated approaches can enhance both sustainability and profitability, especially for resource-constrained farmers.
Lastly, maize price was positively associated with profit efficiency across all practices. However, the effect was especially pronounced under full CA, suggesting that the higher yields achievable under CA allow farmers to capitalize more substantially on favorable market prices. However, maize prices in Zambia are highly volatile, largely influenced by the Food Reserve Agency (FRA). This is because the government makes substantial investments in smallholder maize production through the FISP (Chapoto et al., Reference Chapoto, Zulu-Mbata, Hoffman, Kabaghe, Sitko, Kuteya and Zulu2015). Further, as noted by Nsomba and Roberts (Reference Nsomba and Roberts2023), maize prices in Zambia are very low compared to other countries despite critical inputs such as fertilizer being very expensive. This scenario makes it almost impossible for smallholder farmers in Zambia with low yields to profit from traditional farming. These results highlight the critical role of stable and fair maize pricing in enhancing profit efficiency. Policy reforms aimed at market stabilization and better price incentives could significantly improve the economic viability of maize farming, especially under CA. Furthermore, creating markets for alternative crops to maize (e.g., soybeans, groundnuts, common beans) could make the adoption of full CA systems more attractive.
Figure 10 shows profit inefficiencies across all farming practices. Higher profitability is different from higher efficiency. CT had the highest profit efficiency at 81.30%, and MT-rot had the lowest at 72.22% (inefficiencies: CT—18.70%, MT—19.47%, MT-rot—27.78%, MT-mul—21.96%, and full CA—25.00%). These results align with findings from Yasin et al. (Reference Yasin, Ullah, Ali and Munir2024), who found that conventional rice farmers were more profit-efficient than organic farmers in South Asia. The inefficiencies under CA practices may stem from CA’s complexity (Pangapanga-Phiri, Ngoma and Thierfelder, Reference Pangapanga-Phiri, Ngoma and Thierfelder2024). This implies that farmers need more training in farm management to improve efficiency. Another reason for inefficiency may be the time lag before farmers realize the full benefits of CA (Corbeels et al., Reference Corbeels, De Graaff, Ndah, Penot, Baudron, Naudin, Andrieu, Chirat, Schuler, Nyagumbo, Rusinamhodzi, Traore, Mzoba and Adolwa2014). These results imply that, although CA systems are more profitable, inefficiencies remain and must be addressed to maximize profits.
Profit efficiency by farmer typology, 2021–2023.

Figure 10. Long description
The chart consists of five horizontal rows representing farming practices. Each row contains four sub-charts for the years 2021, 2022, 2023, and an overall average. Within each sub-chart, farmers are classified into groups: Asset- and income-poor (green), asset- and income-rich (orange),and asset- and income-moderate (purple). The x-axis represents %.
Asset- and income-poor farmers were more efficient under MT, MT-rot, and MT-mul, and only second to asset- and income-rich farmers under CT and full CA (Fig. 10). The higher efficiency among asset- and income-poor farmers may be attributed to ownership of small farms that are easy to manage, high dependence on farm income, less use of expensive inputs (e.g., chemical fertilizers), being more risk-averse (less likely to expand into more risky activities) (see Table 2), and adapting well within their current activities to increase efficiency (Lien et al., Reference Lien, Kumbhakar, Mishra and Hardaker2022). Further, these results show that, despite asset- and income-moderate farmers having higher gross margins across all practices, they still exhibit inefficiency. The higher gross margins largely stem from higher fertilizer use and more rainfall, which lead to higher crop yields and selling maize at a much higher price (0.52 US$/kg) than the other two farmer types. This implies that asset- and income-moderate farmers can further improve their profit efficiency by better managing their available resources. The estimated efficiency scores should be interpreted as reflecting overall household maize production efficiency per practice rather than plot-specific management performance.
The sample size for full CA is too small, so its results are not conclusive and should be interpreted with caution. This limitation implies that further research with larger sample sizes is necessary to draw robust conclusions about the effectiveness of full CA. The results in this study also amplify the need for targeted promotion of CA interventions, as not all interventions fit all farmers (Giller et al., Reference Giller, Corbeels, Nyamangara, Triomphe, Affholder, Scopel and Tittonell2011; Corbeels et al., Reference Corbeels, De Graaff, Ndah, Penot, Baudron, Naudin, Andrieu, Chirat, Schuler, Nyagumbo, Rusinamhodzi, Traore, Mzoba and Adolwa2014). This further reinforces the importance of designing context-specific agricultural policies and extension services that consider farmer heterogeneity to maximize adoption and impact.
Drivers of intensity of profit efficiency in maize-based tillage practices
We used a panel tobit model to understand factors associated with the intensity of profit efficiency in maize-based tillage practices. We found that the age of the household head was significantly and positively correlated with profit efficiency under MT-mul (Table 8). However, the result was the opposite when the household head’s age was squared, indicating an inverted-U-shaped relationship between the household head’s age and its squared value. These results imply that profit efficiency increases with farmers’ age and experience up to a certain point, after which it declines with advancing age. The decrease is likely due to reduced physical and mental strength and/or reduced willingness to embrace change at an older age. The positive effect of age on efficiency is consistent with the results of Ng’ombe (Reference Ng’ombe2017), who found that the age of the household was significantly correlated with a decrease in the technical efficiency of smallholder farmers’ maize production in Lusaka province, whereas the opposite was the case for the age of the household head squared. Further, Chiona et al. (Reference Chiona, Kalinda and Tembo2014) also found that older farmers in Central province of Zambia were more technically efficient in maize farming.
Covariates influencing profit efficiency intensity of maize-based practices

Table 8. Long description
The table consists of six columns. The first column lists variables, and the subsequent five columns represent different practices. Each cell contains a coefficient and a t-statistic in parentheses.
Note: t-statistics in parentheses.
***p < 0.01; **p < 0.05; *p < 0.1.
Household size was positively correlated with the profit efficiency intensity of maize production among smallholder farmers under MT-rot. The increase in profit efficiency can be attributed to the fact that most smallholder farmers depend on family labor for their agricultural production (Ayinde, Aminu and Ibrahim, Reference Ayinde, Aminu and Ibrahim2015; Dang, Reference Dang2017).
The study shows that membership in a cooperative was negatively correlated with profit efficiency intensity under MT (Table 8). Similarly, Ma et al. (Reference Ma, Hong, Reed, Duan and Luu2023) found that being a member of a cooperative does not yield a significant impact on farm productivity (meta-analysis). These results show that cooperative membership may not always increase profit efficiency, despite increasing the probability of increasing adoption of agricultural technologies, as shown by Manda et al. (Reference Manda, Khonje, Alene, Tufa, Abdoulaye, Mutenje, Setimela and Manyong2020).
Receiving extension services on CA had a significant negative correlation with profit efficiency intensity under CT. Finally, the results show a strong dependence on rain-fed agriculture, as highlighted by the negative effect of drought experience on profit efficiency intensity across all practices (except full CA). This justifies continued promotion of climate-resilient agricultural practices. The key takeaway from the results is that farmer-specific interventions are important for promoting agricultural technologies and enhancing farmers’ profit efficiency.
We recognize the following limitations of the study. First, we acknowledge the limitations of a small sample size in full CA for drawing robust conclusions. Second, we excluded transport and packaging costs from total production cost calculations because they were not captured during data collection and are often difficult for smallholder farmers to quantify. Third, the findings reflect the conditions of the sampled households in the study areas at the time of data collection and may vary across different locations and time periods. Lastly, the study does not allow computation of panel plot-level analysis of profit efficiency and relies on the household level for this indicator. Despite these limitations, we strongly believe the study offers valuable insights for researchers, stakeholders, and policymakers. These insights can inform efforts to reduce profit inefficiencies among smallholder maize farmers and support more targeted interventions in CA.
Conclusion
Adoption of CA remains limited despite potential productivity benefits, and there is a notable gap in the literature regarding its impact on profit efficiency. This study rigorously assesses the profitability and profit efficiency of conventional (CT) and CA maize-based tillage practices among smallholders in Zambia. It offers important insights that bridge critical gaps in the literature and support evidence-based policy on CA. Using panel SFA and farmer typologies, we advance understanding of how different farming practices perform under real-world Zambian smallholder conditions, where adoption decisions are shaped not only by agronomic potential but also by complex economic, institutional, and behavioral factors.
Our findings challenge narratives about CA’s viability by demonstrating its context-specific profitability and profit efficiency. While incomplete CA practices, particularly minimum tillage with rotation, outperform CT in gross margins, their profit efficiencies lag. This shows that profitability alone is not sufficient to drive adoption of CA; farmers must also overcome inefficiencies in input allocation and management for them to be more efficient under CA practices.
Further, this study also refines the discourse on farmer heterogeneity and efficiency. By classifying farmers into three typologies: asset- and income-poor, asset- and income-moderate, and asset- and income-rich, we revealed disparities in the economic performance of CT and CA practices across farmer typologies. Asset- and income-poor farmers with small farms were more efficient across three practices (MT, MT-rot and MT-mul) despite not having the highest gross margins. This suggests that resource-constrained farmers can apply their limited resources more effectively than those who are not.
The results further indicate the need for a differentiated approach to promoting CA to maximize its benefits among smallholder farmers. This approach should consider farmer heterogeneity, agroecological conditions, and systemic barriers, such as access to appropriate CA extension services and the facilitation of land tenure security. Importantly, cooperatives should be organized at levels that do not focus too heavily on serving as tools for receiving government subsidies under the FISP. For example, interventions for asset- and income-moderate farmers should focus on scaling up MT-rot, given its superior profitability. This could include facilitating access to mechanized ripping services to reduce labor bottlenecks, creating market incentives for rotated legumes (e.g., contract farming with processors), and providing targeted credit facilities. The success of these farmers demonstrates CA’s potential when combined with complementary resources.
For asset- and income-poor farmers, promotion interventions must address short-term trade-offs. These measures could include subsidized ‘CA starter packs’ (e.g., seed for cover crops and other inputs) for specific periods under FISP, with risk-mitigation tools such as index-based insurance to cushion against yield variability and penalties in the initial years of implementation. These farmers can also benefit from training to address skill gaps and from extension services that include practical demonstrations of CA’s benefits. Further, gradual adoption pathways for CA practices (e.g., starting with minimum tillage alone) paired with labor-saving technologies (e.g., scale-appropriate mechanization) may be more feasible than complex CA systems that incorporate all three principles. Meanwhile, interventions should also focus on institutional barriers by expanding land titling programs (as securing land rights enhances agricultural productivity), improving access to rainfall forecasts among poor and moderate farmers, and strengthening cooperative-based input distribution focused on technology adoption. Importantly, asset- and income-moderate farmers represent a ‘middle segment’ in which CA could thrive, with increased profit efficiency when institutional support is provided.
Cross-cutting measures are equally critical if Zambia must enhance profitability and profit efficiency among smallholder farmers. The current policy environment poses significant challenges for smallholder farmers who do not receive fertilizer through the government subsidy program, as they struggle to remain profitable amid rising input costs. High fertilizer prices are a major constraint. Consequently, targeted strategies for reducing fertilizer costs, such as subsidies for localized compost production or training in precision application, are required. Further, the introduction of longer-term subsidy programs (e.g., 5-year tapered support for CA adopters) under the Comprehensive Agricultural Transformation Support Program (CATSP) and Sustainable Agriculture Financing Facility (SAFF) would help bridge the 3- to 5-year lag needed for CA to fully start delivering viable agronomic and economic benefits to farmers. Finally, by tailoring interventions to farmer typologies and addressing both economic and systemic constraints, Zambia can transform CA from a promising innovation into a driver of resilient, inclusive agricultural growth.
Data availability statement
The data can be made available upon request.
Acknowledgments
We sincerely thank all the research assistants and camp extension officers from the Ministry of Agriculture for their valuable contributions to the data collection process. AI was not used in the generation of this article.
Author contributions
Conceptualization: Esau Simutowe, Hambulo Ngoma, Innocent Pangapanga-Phiri; Data curation: Esau Simutowe; Formal analysis: Esau Simutowe, Hambulo Ngoma, Innocent Pangapanga-Phiri; Funding acquisition: Christian Thierfelder, Hambulo Ngoma; Investigation: Esau Simutowe, Christian Thierfelder, Hambulo Ngoma; Methodology: Esau Simutowe, Hambulo Ngoma, Innocent Pangapanga-Phiri; Supervision: Innocent Pangapanga-Phiri, Horace Phiri, Hambulo Ngoma; Validation: Hambulo Ngoma, Innocent Pangapanga-Phiri, Horace Phiri, Kelvin Mulungu, Christian Thierfelder; Visualization: Esau Simutowe; Writing—original draft: Esau Simutowe; Writing—review and editing: Esau Simutowe, Innocent Pangapanga-Phiri, Horace Phiri, Mark Manyanga, Kelvin Mulungu, Christian Thierfelder, Hambulo Ngoma.
Funding statement
This study was supported by the Sustainable Intensification of Smallholder Farming Systems in Zambia (SIFAZ) project, funded by the European Union (FED/2019/400–893). The project is implemented by CIMMYT in partnership with the Zambian Ministry of Agriculture and the Food and Agriculture Organization of the United Nations (FAO). Further support was received from the Scaling for Impact CGIAR Science program, which funded staff time of some of the authors.
Competing interests
The authors declare no competing interests regarding the results and conclusions of this research
Ethical standards
Ethical approval was obtained for all three waves (Ref. No.2021-May-099), and all research activities were conducted in accordance with ethical standards for research involving human participants. Informed consent was obtained from all participants prior to data collection.
Annex
Variables and their questions

Table A1. Long description
The table consists of two columns: Variables and their originating questions from the questionnaire as they were asked during interviews.







 Open access

