I. INTRODUCTION
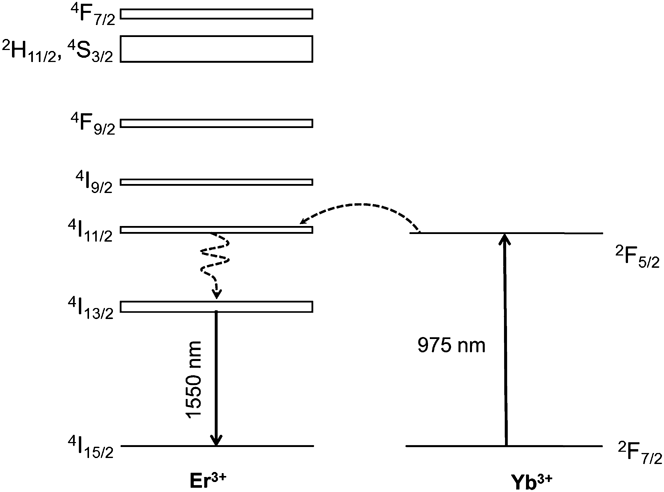
Yttrium aluminum garnet (YAG) doped with lanthanide ions belongs to the most widely produced transparent ceramics, since it constitutes a possible alternative to single crystals as active medium in solid state lasers. Among the various active elements for YAG, Er3+ is important for the realization of lasers operating in the 1.5–1.65 μm ‘eye-safe’ range that finds applications in surgery, in long-distance telemetry, remote sensing, and so on. The relatively low absorption cross section of Er3+ in correspondence of the diode lasers emission wave length constitutes a drawback that cannot be overcome simply through the increment of the doping level, since it would trigger unwanted mechanisms lowering the efficiency of the material. This problem can however be in great part resolved by introducing a suitable sensitizer ion into the host material, in particular Yb3+.Reference Lupei, Lupei, Gheorghe and Ikesue1,Reference Zhou, Zhang, Huang, Wang, Li, Liu, Jiang, Pan and Guo2 This ion has a strong absorption band in the 900–1100 nm range suitable for InGaAs laser diode pumping, and can efficiently transfer the excitation energy to Er3+ ions through a resonant process involving the 2F5/2 level of Yb3+ and the 4I11/2 level of Er3+. These processes are schematized in the simplified diagram of Fig. 1. The energy transfer (ET) between Yb3+ and Er3+ has been studied in YAG and YSO (Y2SiO5) single crystals and thin films with promising results.Reference Schweizer, Jensen, Heumann and Huber3–Reference Garskaite, Lindgren, Einarsrud and Grande5 Interestingly, the combination of Yb3+ and Er3+ in YAG was reported to be advantageous also for lasing at high temperatures.Reference Denker, Galagan, Osiko, Sverchkov, Balbashov, Hellström, Pasiskevicius and Laurell6
Energy level scheme of Er3+ and Yb3+ and the mechanism of the ET process giving rise to the Er3+ emission at 1.6 μm.

The transparent ceramics production technology nowadays allows the realization of materials in principle suitable for replacing single crystals in optic and photonic devices.Reference Ikesue, Aung, Yoda, Nakayama and Kamimura7 One of the differences between the fabrication of single crystals and polycrystalline materials is the necessity to use sintering additives to produce fully dense transparent material via the ceramics preparation process. The introduction of two doping ions in YAG ceramics together with silicon as sintering additive can affect the microstructure evolution of the material during sintering, although the difference between the ionic radii of Y3+ and the substituting Yb3+ and Er3+ is very small.Reference Dobrzycki, Bulska, Pawlak, Frukacz and Woźniak8 It is then essential to have detailed information about the distribution of the dopants (Er3+, Yb3+) and sintering aid (Si) within the microstructure of the ceramic. This work reports on the preparation of polycrystalline YAG ceramics co-doped with 1 at.% Er3+ and 5 at.% Yb3+ and its structural, morphological, and spectroscopic characterization. An YAG single crystal with the same composition of the ceramic has been grown for comparative purposes, related in particular to the low temperature and high-resolution spectra, whose features are strongly sensitive to the microstructural and optical quality of the material.
II. EXPERIMENTAL
A. Materials preparation
Transparent ceramic samples were prepared via solid state sintering of high purity (>99.99%) commercial oxide powders (Y2O3, Nanocerox; Al2O3, DS-6, Taimei; Yb2O3, REacton, Alfa Aesar; Er2O3, REacton, Alfa Aesar). The powders were mixed in stoichiometric ratio to prepare 1 at.% Er, 5 at.% Yb:YAG (Er0.03Yb0.15Y2.82Al5O12) and ball milled in pure ethanol in PE bottles with 99% pure alumina balls for 48 h. Tetraethyl orthosilicate (TEOS, 99.999%, Sigma-Aldrich) was used as sintering additive in the quantity of 0.5 wt% with respect to the weight of the powder. The homogenized suspension was spray dried (Mini Spray Dryer B-290, BÜCHI Labortechnik AG, Switzerland; for details of the spray drying process, see Ref. Reference Serantoni, Piancastelli, Costa and Esposito9) and the prepared granulate was uniaxially pressed into disc-shaped samples 15 mm in diameter and few mm thick, which were cold isostatically pressed at 250 MPa, treated in air at 600 °C for the elimination of organic residues, and subsequently sintered in high vacuum (10−4 Pa) at 1735 °C for 16 h. After vacuum sintering, the samples had to be annealed in air, so that oxygen vacancies were eliminated and Yb2+ ions were reoxidized to Yb3+. The annealing cycle was performed at 1100 °C for 100 h.
A single crystal sample of the same composition was prepared by the micro-pulling down method in the form of a rod approximately 16 mm long and 2.5 mm in diameter. The method has been described in Ref. Reference Yoshikawa, Nikl, Boulon and Fukuda10. Both the single- and polycrystalline samples are shown in Fig. 2.
Photographs of the tested samples: ceramic (left) and single crystal brazed on the heat sink (right).
B. Characterization of microstructure
Microstructure of the ceramic samples was studied by field-emission scanning electron microscopy (SIGMA Carl Zeiss with GEMINI column and Oxford Instruments INCA EDX) and transmission electron microscopy (TEM; JEOL 2010F instrument fitted with Oxford Instruments X-max 80 mm² SDD EDX detector, JEOL, Tokyo, Japan). Grain size of ceramic samples was evaluated by image analysis of micrographs. The optical transmittance of polycrystalline samples was measured with a UV-vis spectrophotometer (Lambda 35 UV-vis, Perkin Elmer, Inc., Waltham, MA).
C. Spectroscopic measurements
1. Absorption spectra
Absorption spectra in the visible and the near-infrared (NIR) spectral ranges were recorded at 4 and 293 K with a Cary-Varian 5000 Scan spectrophotometer (Varian, Darmstadt, Germany) equipped with an Oxford CF 1204 helium flow cryostat (Oxford Instruments, Oxford, UK) at the Chemistry Department of the University of Wroclaw.
2. Emission spectra
Emission spectra and decays of fluorescence were recorded at the Institute of Light and Matter (ILM) of the University of Lyon1. The emission spectra were measured using a continuous wave Ti:sapphire laser as the excitation source. The emitted radiation was dispersed by means of a spectrometer equipped with a 300 line/mm grating blazed at 1000 nm and revealed with a CCD IDUS NIR InGaAs camera from ANDOR. The time resolved experiments were carried out using a NT342 OPO pumped with a frequency-tripled Nd:YAG laser (10 Hz, 8 ns) from Ekspla as the excitation source. The decay profiles of the Yb3+ emission were recorded with a Jobin–Yvon HRS1 monochromator coupled with a Hamamatsu R1767 photomultiplier. The 4I13/2 → 4I15/2 emission transition of Er3+ in the 1500 nm region was isolated by a long pass filter mounted on a cooled InGaAs detector connected to a Lecroy LT342 digital oscilloscope. All spectra were corrected for the system responsiveness.
III. RESULTS AND DISCUSSION
A. Ceramics
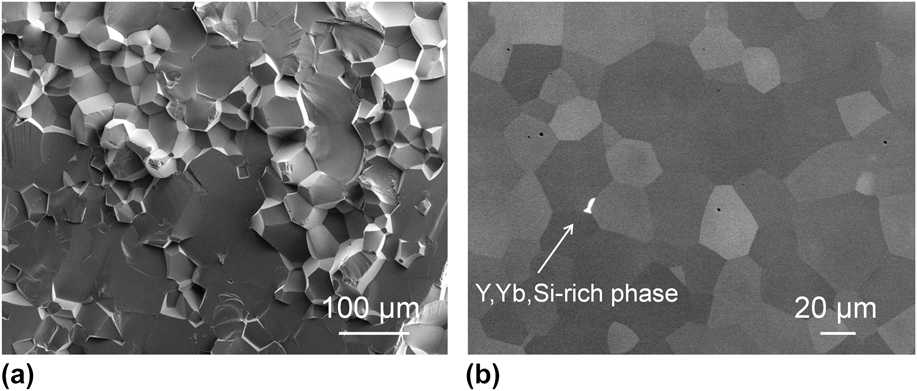
The microstructure illustrated in Fig. 3 is homogeneous with mean grain size (mean intercept length) 33 ± 3 μm, but some pores are present, mostly inside grains. Although the processing conditions were analogous to those applied in the preparation of single-doped Yb3+:YAGReference Hostaša, Esposito, Alderighi and Pirri11 or Er3+:YAG ceramics,Reference Cavalli, Esposito, Hostaša and Pedroni12 which exhibited transmittances higher than 77%, in the case of the co-doped samples the measured transmittance at 1100 nm did not exceed 70%. Obviously, the presence of pores or secondary phases causes scattering of light during propagation, and thus leads to low optical transmittance. Occasionally, a secondary YSiO-type phase was observed in the form of a few grains found in the bulk material and grain boundary enrichment identified by transmission electron microscopy–energy-dispersive x-ray spectroscopy (TEM-EDX) [see Figs. 3(b) and 4(a)].
SEM micrographs of ceramic samples: fracture surface (a) and polished surface after thermal etching (b).
Typical intergranular secondary phase (Y–Si–O) occasionally observed at grain boundaries (a); nanoprobe EDX analysis (here with a 3 nm probe) shows that most of the GBs exhibit Si-enrichment (but no detectable Er3+ or Yb3+ variation); HRTEM images show generally ‘blurred’ contrasts at GBs, indicating the presence of some SiO2 segregation as confirmed by EDX analysis on the right (b). Er3+ distribution was detectable with high accuracy despite its very low content (0.27 ± 0.04 at.% in the present case).
TEM-EDX results confirm the expected content of Yb3+ and Er3+ in the material as reported in Table I. Experimental measurements were consistently analyzed by assuming a linear combination of the Yb,Er-doped YAG phase and additional contribution of SiO2 and Y2O3 (the elementary constituents of YSiO-type phases such as Y2SiO5 or Y2Si2O7).
EDX chemical analysis of the Yb,Er-doped YAG ceramic (at.%). The final composition (and sample thickness defining the x-ray absorption factors in the EDX treatment) is obtained with an accuracy of 0.2 at.% by minimizing a quadratic error between experimental atomic contents and calculated ones assuming a linear combination of oxide formulae (Y,Yb,Er)3Al5O12, SiO2, and Y2O3.
Consistently with Fig. 3(b), a crystalline secondary phase was occasionally found at a grain boundary as shown in Fig. 4(a). The diffractogram (calibrated with the upper YAG grain) can be indexed as a composite pattern from variants of the γ-Y2Si2O7 phase (space group P2 1/c, lattice parameters a = 4.69, b = 10.84, c = 5.58 Å, γ = 96.03°Reference Dolan, Harlan, White, Hall, Misture, Bancheri and Bewlay13). This phase was confirmed by EDX as reported in Table II.
In the perspective to check whether any dopant segregation occurred, several linescans were performed perpendicularly to grain boundaries. A representative example is shown in Fig. 4(b). No variation of either Yb or Er is detected within a dispersion of <0.06 at.% and thus the dopant distribution can be described as homogeneous. Conversely, Si-enrichment was detected at grain boundaries. The absence of a sharp contrast at grain boundary strongly suggests intergranular Si segregation, which is indeed confirmed by the increase of the Si content at the grain boundary position.
These observations are in agreement with those published in studies dealing with Yb:YAG and the spatial distribution of doping ions and those of the sintering additive. Due to the similar ionic radius of Yb3+ and Y3+ no segregation of Yb was expected,Reference Epicier, Boulon, Zhao, Guzik, Jiang, Ikesue and Esposito14 and Er3+ should behave similarly. On the other hand, the segregation of Si-rich phases in YAG ceramics has already been observed, with their presence causing losses in laser efficiency. Recent studiesReference Epicier, Malchère, Esposito, Hostaša, Piancastelli, Toci, Vannini, Pirri, Alderighi and Boulon15,Reference Esposito, Epicier, Serantoni, Piancastelli, Alderighi, Pirri, Toci, Vannini, Anghel and Boulon16 show that in the case of Yb3+:YAG the segregation of Si-rich phases such as Y2SiO5 or Y2Si2O7 on grain boundaries can be reduced by changing the annealing cycle. In the present case, further research in this direction would be required for the optimization of the process.
B. Absorption
The room temperature absorption spectra of YAG: Er3+(1%), Yb3+(5%) single crystal and polycrystalline ceramic in the UV-visible and in the NIR region are shown in Figs. 5(a) and 5(b), respectively. The observed manifolds are composed of sharp lines having similar bandwidths, with no features ascribable to defect sites. The broadband present in the 240–300 nm region of the spectrum of the ceramic sample is probably due to the secondary phase discussed in the previous section. The UV-visible absorption bands [Fig. 5(a)] can be assigned to transitions from the 4I15/2 ground state of Er3+ to its excited levels on the basis of previous literature dataReference Gruber, Quagliano, Reid, Richardson, Hills, Seltzer, Stevens, Morrison and Allik17: many manifolds (14, exactly) contribute to the complicate spectral structure in the high energy region up to 400 nm, whereas the multiplets at longer wave lengths can be easily identified: 2G9/2 (405 nm), 4F5/2 + 4F3/2 (450 nm), 4F7/2 (490 nm), 4S3/2 + 2H11/2 (520 nm), 4F9/2 (650 nm), 4I9/2 (800 nm). Only two band systems are present in the NIR region. Two absorption manifolds contribute to form the intense band at about 900 nm: The strong 2F7/2 → 2F5/2 transition of Yb3+ and the weaker 4I15/2 → 4I11/2 transition of Er3+, whereas the system in the 1500 nm region is assigned to the 4I15/2 → 4I13/2 transition of Er3+. In Figs. 6(a)–6(f) are reported selected absorption manifolds measured at 4 K in high resolution conditions to verify the number of the Stark components arising from the crystal field splitting of the Er3+ and Yb3+ excited levels. The spectra of the crystalline and ceramic sample are in excellent agreement between them and accurately reproduce the literature data available for Er:YAG (Ref. Reference Gruber, Quagliano, Reid, Richardson, Hills, Seltzer, Stevens, Morrison and Allik17 for the crystal and Ref. Reference Gruber, Nijjar, Sardar, Yow, Russell, Allik and Zandi18 for the ceramic (50% Er)). It can be observed from Fig. 6(e) that the three 2F7/2 → 2F5/2 absorption transitions of Yb3+ at 968.1 (zero-phonon line) 940.8 and 916.0 nm, associated with a complex vibronic structure consequent of the relatively strong electron–phonon coupling characteristic of this ion.
UV-visible (a) and NIR (b) room temperature absorption spectra of the Er3+, Yb3+:YAG samples.
Selected absorption manifolds measured at 4 K in high resolution conditions.
C. Emission spectroscopy
The NIR emission spectra of the two samples were measured upon excitation at 940 nm, in correspondence with the Yb3+ absorption maximum, and are reported in Fig. 7. The spectra are composed of two band systems ascribed to the 2F5/2 → 2F7/2 emission of Yb3+ ions (950–1100 nm range) and to the 4I13/2 → 4I15/2 emission of Er3+ ions (1430–1680 nm range). It can be observed that the Yb3+/Er3+ emission ratio is larger in the crystal than in the ceramic. Excitation at 940 nm gives rise also to the Er3+ upconverted emission in the 550 and 660 nm regions, shown in Figs. 8(a) and 8(b), respectively. In this case, the crystal luminescence is slightly more intense than that of the ceramic. Since the Yb3+ absorption coefficient is practically the same for both samples [Fig. 5(c)] we can infer that the excited state dynamics of the investigated material could be in part affected by the morphology, especially by the grain boundaries of the ceramic sample.
NIR emission of the investigated samples, measured upon excitation at 940 nm. The spectra are normalized with respect to the Er3+ maximum emission.
Upconversion luminescence spectra of the Er3+ ions in the green (a) and the red region (b) measured upon excitation at 940 nm.
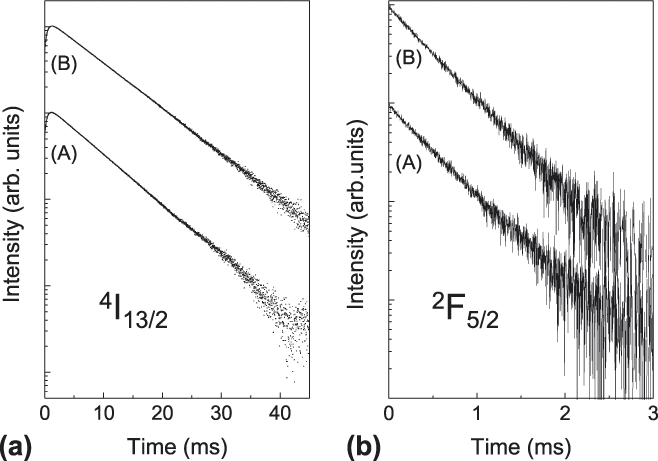
Figure 9(a) shows the decay profiles of the 4I13/2 → 4I15/2 emission of Er3+:YAG crystal and ceramic. Both are single exponential with decay times of 7.48 ms in the former and 8.34 ms in the latter case. The radiative lifetime of the 4I13/2 level, estimated by the Judd–Ofelt analysis of the absorption spectrum, is 7.59 ms,Reference Cavalli, Esposito, Hostaša and Pedroni12 consistent with both experimental values, especially in consideration of the intrinsic error (±20%) of the Judd–Ofelt approach. It also has to be noted that the decay profiles present rise times in consequence of the Er3+ excitation ‘via’ ET from Yb3+. The evaluated time constants are 0.48 ms for the single crystal and 0.50 ms for the ceramic, well consistent with the decay times of Yb3+, whose decay curves are reported in Fig. 9(b). They are again single exponential. The decay time of the Yb3+2F5/2 excited state is 474 µs in the single crystal and 461 µs in the ceramic. They are significantly shorter than the decay times of the single-doped Yb3+:YAG, usually of the order of 1 ms [Ref. Reference Yoshikawa, Boulon, Laversenne, Canibano, Lebbou, Collombet, Guyot and Fukuda19], in consequence of the ET to the Er3+ ions.Reference Zhou, Zhang, Huang, Wang, Li, Liu, Jiang, Pan and Guo2 The analysis of the mechanisms involved in this process is complex and requires systematic measurements as function of the doping concentration. This is beyond the scope of the present paper.
Luminescence decays of the (a) Er3+4I13/2 and (b) Yb3+2F5/2 metastable states at room temperature in the single-crystal (A) and the ceramic (B).
In conclusion, the main difference in the emission behavior of the crystal and ceramic samples concerns the Yb3+/Er3+ emission ratio. A probable explanation of this difference might come from the presence of the γ-Y2Si2O7 phase in the ceramic and the Si-enrichment as detected at grain boundaries by TEM-EDX. Some considerations can however be of help to organize the future work in this connection. First of all, the Yb3+ excitation at 940 nm triggers several nonradiative processes: The Yb3+ to Er3+ ET, the migration among Yb3+ ions, responsible for the radiation trapping effect, and various mechanisms involving excited Er3+ ions like multiphonon relaxation, upconversion, back transfer to Yb3+. Possible differences in the local concentrations of the doping ions in the two samples can be reasonably excluded for Yb3+ in crystalsReference Świrkowicz, Skórczakowski, Jabczyński, Bajor, Tymicki, Kaczmarek and Łukasiewicz20 as well as in ceramic,Reference Epicier, Boulon, Zhao, Guzik, Jiang, Ikesue and Esposito14 but the information about the Er3+ ion is lacking, then this is a point to take into consideration. Regarding the grain size, it can have a significant effect on the decay time (and likely on the emission intensity) of Yb3+ when of the order of the nanometers.Reference Amami, Hreniak, Guyot, Zhao and Boulon21 This is not the case, since the grains constituting the ceramic sample are of about 30 μm in size (see Section III. A). The relatively higher intensity of the Yb3+ emission band in Fig. 7 can be accounted for by considering (i) a major efficiency of the Yb3+ to Er3+ transfer in the ceramic, compatible in part (but not to a sufficient extent) with the shorter decay time of Yb3+; (ii) a major efficiency of the Er3+ to Yb3+ back transfer in the crystal, compatible in part with the shorter decay time of Er3+; (iii) the transmittance of the ceramic sample, that is relatively low (of the order of 70%) and increases with the wave length (even if it was not measured in the 1500 nm region).
D. Considerations on the required population inversion
It can be noticed that the lasing action can be rather difficult to achieve in the Yb:Er:YAG system. The Er laser transition at 1550–1650 nm (between the levels 4I13/2 → 4I15/2) is affected by ground state absorption, that is the population in the ground level absorbs the laser radiation itself. Therefore, a large fraction of the population has to be excited to the upper laser level just to overcome the ground level absorption. An estimate of the single-pass small signal gain G provided by an excited fraction of population β is given by the following relation:
 $$G = {N_{{\rm{Er}}}}I\left[ {{\sigma _{\rm{E}}}\beta - \left( {1 - \beta } \right){\sigma _{\rm{A}}}} \right]\quad ,$$
where N Er is the density of the Er atoms in the matrix (1.38 × 1020 cm−3), l is the sample length (2 mm), σE and σA are the emission and the absorption cross section at the lasing wave length, respectively, and β is the value of the excited population fraction averaged over the whole laser mode volume in the sample.
To achieve laser emission, the small signal gain must be
 $$G \,\ge\, {L \mathord{\left/ {\vphantom {L 2}} \right. \kern-\nulldelimiterspace} 2}\quad ,$$
where L(<<1) are the round trip cavity losses.
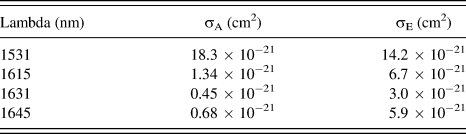
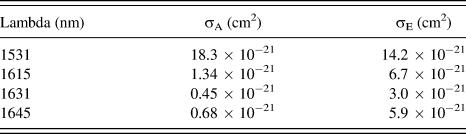
In the system under consideration, lasing has been observed at 1645 nm,Reference Schweizer, Jensen, Heumann and Huber3 and more recently at 1615 nmReference Zhu, Tang, Duan, Luo and Zhang22 whereas the peak emission cross section is located at about 1531 nm. Another possible candidate for lasing could be the transition at 1631 nm. The corresponding cross section values are listed in Table III (after Schweizer et al.3). With the data from Table III, the values of the small signal gain for increasing inverted population fraction can be calculated (see Fig. 10).
Values of the absorption (σA) and emission (σE) cross sections used for the calculation of the small signal gain.
Calculated population inversion needed to achieve laser threshold with assumed losses of 9% (green dashed line) for emission at 1531, 1615, 1631, and 1645 nm.
In general, it can be seen that for low to moderate population inversion (and thus low losses), the transition at 1645 nm and at 1615 nm are favored for laser oscillation, whereas the transition at 1631 nm features a smaller gain. It can be also seen that a positive gain for the transition at 1531 nm can be obtained only for very high values of inversion fraction, exceeding 0.5. This analysis is consistent with the results provided by Zhu et al.,Reference Zhu, Tang, Duan, Luo and Zhang22 where simultaneous laser action was observed at 1615 and 1645 nm, with similar output power, using output couplers with very low transmission. Our analysis indicates indeed that lasing at these two wave lengths should occur with similar pump threshold and overall efficiency (even though the power balance between the two lines can be influenced by differences in the output mirror transmission at the two wave lengths). On the other hand, Zhu et al. observed laser action neither at 1531 nm nor at 1631 nm, indicating that the required inversion is higher than that needed for lasing at 1615 nm and 1645 nm.
Furthermore, this analysis shows that for the length and doping level of tested samples lasing action can be achieved only for low cavity losses. For instance, if we consider the case of a sample placed perpendicularly in the cavity (where the overall round trip losses L are at least due to two Fresnel reflection (2 × 8%) plus the output coupling (e.g., 2%)) a small signal gain value G > 0.09 is required (horizontal dashed line in Fig. 10), corresponding to a population inversion of about 0.6 to achieve laser threshold both at 1645 and at 1531 nm. Even in the case of crystal placed at the Brewster angle, residual losses can amount to some percent, still requiring an inversion fraction of ∼0.4. With this combination of sample length and doping, lasing at 1645 and at 1615 nm becomes impossible for losses higher than L/2 > 0.15, and laser action becomes impossible at 1531 nm as well for losses higher than L/2 > 0.35.
In the case of the ceramic material, this evaluation shows that scattering losses can have a dramatic impact on the laser action of this system: For instance, in the case depicted in Fig. 10(a), further single pass scattering loss of only 5% (dash-dotted horizontal line) would almost forbid the lasing action at 1615 and at 1645 nm, and it would rise the inversion threshold to about 0.73 for lasing at 1531 nm.
IV. CONCLUSIONS
1% Er3+, 5% Yb3+-co-doped YAG samples in the form of polycrystalline transparent ceramics and single crystal have been prepared. Their room temperature absorption and emission spectra are very similar, confirming the coincidence of the nominal and actual doping concentrations and allowing to exclude effects ascribable to ion segregation and/or unwanted impurities. In both cases, the Yb3+ excitation gives rise to Er3+ emission in the 1.6 µm region thanks to an ET process whose efficiency slightly varies with the sample morphology. The low temperature absorption spectra reveal a Stark structure in good agreement with previous literature.
The microstructural characterization by TEM-EDX showed that the distribution of rare earth dopants was homogeneous throughout the materials, as confirmed by the spectroscopic analysis, but it pointed out the effect of the presence of Si (sintering additive) and its distribution in the ceramic material. Si-rich phases were observed as well as pores (mostly intragranular). Different Si addition or variation of thermal treatment may resolve this problem.
Calculations on lasing action showed that to obtain laser emission from this material, its optical quality must be very high, as a high population inversion is required. At low losses then lasing should occur at 1645 nm and at 1615 nm more easily than at 1535 nm. At moderate and higher losses, lasing requires high level of population inversion, and lasing is more likely to occur at 1535 nm.
ACKNOWLEDGMENTS
The authors would like to thank for the support from the bilateral project SCOC (CNRS France – CNR Italy), the EC initiative “LASERLAB-EUROPE” (EC contract no. 284464) – Joint Research Activity WP33 – “European Research Objectives on Lasers for Industry, Technology and Energy (EURO-LITE)”, and the Flag project RITMARE, La Ricerca Italiana per il Mare – coordinated by CNR and funded by the Ministry of Education, University and Research within the National Research Program 2011–2013. J. Hostaša would like to acknowledge the financial support from specific university research (MSMT No. 20/2014). Centre Lyonnais de Microscopie (CLYM, www.clym.fr) and the French CNRS-CEA network METSA (FR CNRS 3507, www.metsa.fr) are gratefully acknowledged for the access to the JEOL 2010F microscope.