INTRODUCTION
The Dangoor REsearch Accelerator Mass Spectrometer (D-REAMS) Radiocarbon Laboratory was established three years ago as an integral part of the existing 14C dating laboratory at the Weizmann Institute of Science, situated in Rehovot, Israel. The laboratory has been headed by Elisabetta Boaretto since 1998. On January 2013, a CAMS 500 carbon-only AMS system, manufactured by NEC, was installed and passed the acceptance test 2 months later. Since then, over 4500 samples and standards have been measured. The system was installed at one of the target rooms of the old 14MeV Koffler accelerator, which was shut down almost a decade ago. The D-REAMS Radiocarbon Laboratory is a research facility and is not required to run samples commercially due to the support of the Weizmann Institute of Science. Therefore, the emphasis is on students’ research, collaboration projects, and the Israel Antiquities Authority excavations (for some research examples see Regev et al. Reference Regev, Finkelstein, Adams and Boaretto2014; Asscher et al. 2015a, Reference Asscher, Lehmann, Rosen, Weiner and Boaretto2015b; Caracuta et al. 2015, Reference Caracuta, Weinstein-Evron, Yeshurun, Kaufman, Tsatskin and Boaretto2016; Hershkovitz et al. Reference Hershkovitz, Marder, Ayalon, Bar-Matthews, Yasur, Boaretto, Caracuta, Alex, Frumkin and Goder-Goldberger2015).
SYSTEM DESCRIPTION
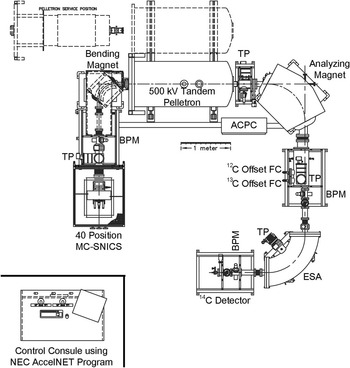
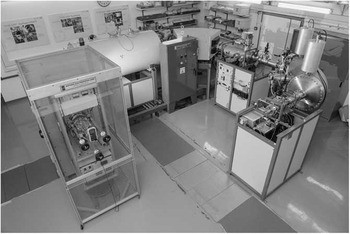
Several NEC compact AMS systems for carbon isotope measurements have been previously described (Goslar et al. Reference Goslar, Czernik and Goslar2004; Roberts et al. Reference Roberts, Culp, Dvoracek, Hodgins, Neary and Noakes2004; Southon et al. Reference Southon, Santos, Druffel-Rodriguez, Druffel, Trumbore, Xu, Griffin, Ali and Mazon2004; Kobayashi et al. Reference Kobayashi, Niu, Itoh, Yamagata, Lomtatidze, Jorjoliani, Nakamura and Fujine2007; Liu et al. Reference Liu, Ding, Fu, Pan, Wu, Guo and Zhou2007; Cherkinsky et al. Reference Cherkinsky, Ravi Prasad and Dvoracek2013; Zhu et al. Reference Zhu, Ding, Wang, Shen, Jia and Zhang2015), and therefore will not be described here at length. Schematics of the system and a photo are presented in Figures 1 and 2, respectively. Although such compact AMS machines can be customized, the D-REAMS system does not include any modifications beyond the following description. The ion source is the fourth generation multicathode source of negative ions by cesium sputtering (MC-SNICS), equipped with a 40-sample multicathode wheel. The low-energy bending magnet is equipped with a magnet bias sequencer (MBS), enabling the passage of all three isotopes through the same pathway by a premagnet acceleration and a postmagnet deceleration, with the support of an isotope specific X–Y steerer. The main acceleration is performed by the 1.5SDH Pelletron unit. The system at the Weizmann is operated at 460 keV, which was set as the optimal beam energy to remove the molecular interference by the terminal stripping process from the –1 to the +1 charge state. Following acceleration, the beam is tuned through an additional Y steerer into the analyzing magnet. The abundant isotopes (12C, 13C) are then measured by the two offset Faraday cups, while the rare isotope (14C) is passing through the electrostatic analyzer, and measured using a solid-state detector. The system is controlled by NEC’s AccelNET computer control system, and the data analysis is performed using NEC’s abc 7.0 software.
Schematic layout of the D-REAMS system at the Weizmann Institute of Science [TP: HiPace 700 turbopump (Pfeiffer); BPM: beam profile monitor; FC: Faraday cup; ESA: electrostatic analyzer]. Image courtesy of NEC.

The D-REAMS system at the Weizmann Institute of Science

SYSTEM PERFORMANCE
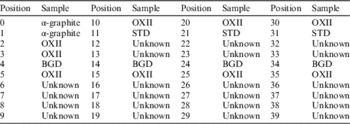
Each 40-sample wheel typically includes two non-processed α-graphiteFootnote 1 (pressed straight into cathodes without a catalyst, meant to check the background of the AMS), four processed background samples [for charcoal samples we use α-graphite after acid-base-acid (ABA) treatment and graphitization], nine oxalic acid II targets for normalization, and three known standard samples—usually VIRI-1D (Scott et al. Reference Scott, Cook, Naysmith, Bryant and O’Donnell2007) or VIRI-U (Scott et al. Reference Scott, Cook and Naysmith2010), treated by ABA as well—as reference material to verify the measured results. A typical arrangement of the samples throughout the wheel can be seen in Table 1. Sample measurements are usually performed by turning the wheel counterclockwise sequentially. Once a full turn around the wheel is completed, the process is repeated until all samples are measured at least 10 times (meaning 10 turns of the wheel). In each turn, every sample is measured for 3 min (a total of 30 min per sample after 10 turns). Since there are nine oxalic acid II (OXII) targets, the result of each 3-min individual measurement of non-OXII samples is normalized to the nearest nine OXII 3-min measurements (one measurement from every OXII target). The normalized runs of each sample are then being averaged and corrected for background and fractionation. If a higher precision is required for a certain sample (e.g. lower uncertainty), the machine will be retuned after 10 turns (about 24 hr), and additional turns will be performed of the desired samples and standards. Although no significant shift in the tuned parameters is expected after 24 hr, it was decided to retune in case the measurement is extended beyond our standard 10 turns. The value of 10 turns was chosen as most of the samples are not exhausted after 10 measurements of 3 min each under our working conditions, enabling good currents throughout the measurement and sufficient 14C counts. Furthermore, on the practical side, the length of the total run leaves sufficient time after it ends during the work day to replace the samples wheel in a new one towards the next day’s measurement.
Typical samples arrangement in a wheel. α-graphite1: non-processed graphite: OXII: oxalic acid II standard. BGD: the relevant processed background sample (e.g. ABA treated, graphitized α-graphite for charred samples). STD: a known-age sample, usually VIRI-1D or VIRI-U, depending on the expected age of the unknown samples, as a reference material for results verification.

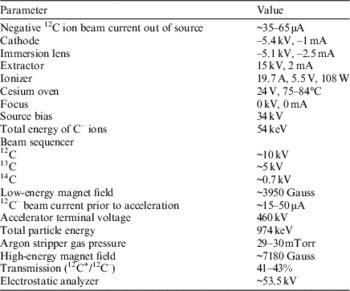
The first cathodes (positions 2–5) are used for tuning (up to 5–6 min on each cathode). The tuning is being made semi-automatically, using the i_scan program, adopted from VERA, enabling the plotting and storing of the tuning “flat tops” for future reference and analysis. After 3.5 yr of operation, routine typical operation parameters and performance values are given in Table 2.
Typical operation parameters and performance values of the D-REAMS system after 3.5 yr of operation.

Magnets
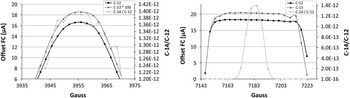
12C and 13C beams have very similar patterns through the magnets. Changes in the low-energy bending magnet field cause similar beam intensity variation, as recorded at the offset Faraday cups for each isotope (Figure 3, left). The high-energy analyzing magnet has a very wide “flat top” for 12C and 13C, but only a narrow magnetic field range yields the maximum 14C values (Figure 3, right).
Beam intensity through various magnetic fields of the low-energy bending magnet (left) and the high-energy analyzing magnet (right). 12C and 13C intensities were measured at their respective offset Faraday cups post-acceleration (see Figure 1). Current values of 13C were multiplied by 100, in order to fit the same axis as 12C. 14C/12C values are the results of 60-s measurements of oxalic acid II sample.

Gas Stripper
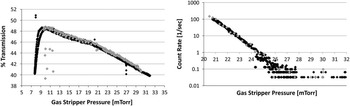
The argon stripper gas pressure was varied while recording the 12C transmission percentages and the count rate of two processed background samples (α-graphite after ABA treatment and graphitization, Figure 4). For each cathode, the pressure was decreased from ~30 mTorr down to 8–10 mTorr, and back to ~30 mTorr. No significant differences were noticed between the cathodes and the measurement stages. Pressure of 29.5±0.5 mTorr was chosen as the operation value, as it gave the best transmission among the lowest count rate measurements.
12C transmission percentages (left) and 14C count rate (right) of a processed α-graphite background sample through various argon stripper gas pressures. The black and gray diamonds represent two separate cathodes. For each cathode, the gas pressure was varied from ~30 mTorr down to 8–10 mTorr, and back up to ~30 mTorr.

Transmission
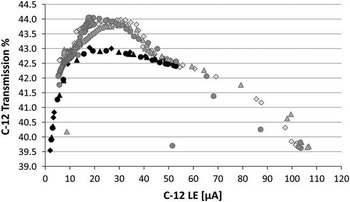
12C transmission was measured while changing the cesium oven temperature, hence changing the ion source current output (Figure 5). Three oxalic acid II cathodes were measured 100 measurements each. An individual measurement lasted for 3 min (hence each cathode was measured for 300 min). The 12C low-energy current (Figure 5, x axis) was measured at the Faraday cup between the low-energy magnet and the accelerating tube. The measurement started with an oven temperature of 84°C and currents of around 50 µA. The oven temperature was then decreased to 50°C, followed by an increase to 95°C, and cooling back to 84°C. The fresh cathodes yielded lower transmission values (by 1% at 20–30 µA) than the heavily sputtered ones (first 15 measurements of each cathode are marked by black markers in Figure 5). Highest transmission values are achieved with 12C low-energy currents of 15–50 µA.
The dependency of the transmission in the ion source output. Three oxalic acid II cathodes (marked by diamonds, triangles, and circles) were measured 100 times each in various ion source outputs. The first 15 measurements of each cathode are marked by black markers, showing lower transmission values (of ~1%) for less-sputtered cathodes.

Background
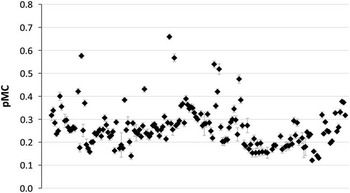
Routinely, background samples are prepared in proximity to the unknown samples preparation, and in accordance to the chemical treatments required for the latter. Some 3–4 processed background cathodes are measured in each sample wheel (Table 1), and are used for background correction of the chemical process and AMS machine for the unknown samples. For charred samples, we use α-graphite (see footnote earlier in the manuscript for full details), which undergoes the same chemical treatment as the unknown samples. Since its installation, an average value of 0.265±0.014 pMC (equal to 48,000±450 yr BP) was measured at the D-REAMS system for the processed α-graphite samples (after ABA treatment and graphitization, without a correction for machine background, Figure 6). Unprocessed α-graphite samples, measured as machine background (pressed “as is” to target holders without a catalyst), yield typical ages around 52,000 yr BP, corresponding to 0.150 pMC.
Processed α-graphite background samples measured at the D-REAMS system. Machine background values were not subtracted.

Precision of Known Standards
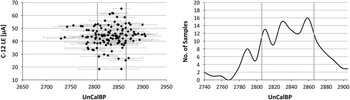
The dating results of 130 VIRI-1D (Scott et al. Reference Scott, Cook, Naysmith, Bryant and O’Donnell2007) samples that were measured since the installation are presented in Figure 7. The average age of the measurements is 2833±30 yr BP (1σ), while the VIRI consensus value was set to 2836±3 yr BP (Scott et al. Reference Scott, Cook, Naysmith, Bryant and O’Donnell2007). No dependency was found between the measured age and the ion source output (measured as 12C current at the low-energy Faraday cup, Figure 7 left). The right panel in Figure 7 illustrates the distribution of the number of samples over the resulted ages, calculated with intervals of 10 yr.
Measurements of VIRI-1D samples in the D-REAMS system. The two gray vertical lines define the 2836 (the consensus value) ±30 yr BP range (1σ). The distribution plot (right) was calculated in 10-yr intervals.

Intercomparison Experiment
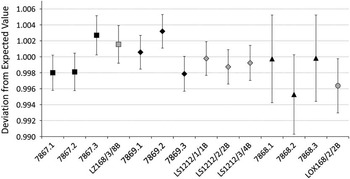
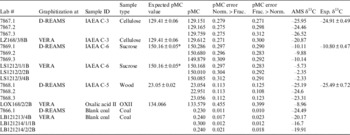
Fourteen samples of four known standards were graphitized either at VERA or D-REAMS laboratories. All samples were measured using the D-REAMS system. The samples vary from 23 to 150 pMC. The difference between the laboratories is less than 0.5% for old samples, and 0.2% for modern ones, with no clear offset trend (Table 3). The deviation between the measured and expected values of each sample is usually smaller than 0.3% and not larger than 0.5% (Figure 8).
Deviation of the measured standards from their expected values. Black symbols were graphitized at D-REAMS, and gray ones at VERA. Squares are IAEA C-3 standards, diamonds are IAEA C-6, triangles are IAEA C-5, and the circle is oxalic acid II sample.

Intercomparison results of several standards and backgrounds graphitized at VERA or at D-REAMS, and measured at D-REAMS. Note that the blank coal samples were treated by ABA, graphitized, and presented here without machine background subtraction. *The expected pMC value of IAEA C-6 is after Xu et al. (Reference Xu, Khosh, Druffel-Rodriguez, Trumbore and Southon2010).

Two pMC error calculation methods are presented in Table 3. In “Norm.>Frac.” the results of each run are first normalized to the nearest oxalic acid II measurements. The normalized results are then averaged, and only then background subtraction and fractionation correction are applied (as in the abc software; see also System Performance section earlier in this manuscript). The highest precision is expected, though when the normalization, background, and fractionation corrections are all calculated for each run separately every turn of the wheel, and then averages of the pMC and δ13C values are calculated (column “pMC error Frac.>Norm.” in Table 3; see Steier et al. Reference Steier, Dellinger, Kutschera, Priller, Rom and Wild2004). The reproducibility of the pMC values over the different turns is better than that of the raw 13C/12C and 14C/12C values; also the scatter between different sputter targets from the same material is lower. From a statistical point of view, this means that the uncertainties of the 13C/12C values and 14C/12C values are correlated. A part of this correlation is expected as the same 12C+ current measurement is used for 13C/12C and 14C/12C calculations. Additionally, any variation in isotopic fractionation will result in deviations of the raw ratios, but not of the pMC values. This is certainly true for any chemical fractionation during sample preparation, but also fractionation processes in the instrument, caused by drifts of the power supplies or stripper gas pressure and by ion source cratering (Pearson et al. Reference Pearson, McNichol, Schneider, Von Reden and Zheng1998; Santos et al. 2007a, 2007b, Reference Santos, Southon, Drenzek, Ziolkowski, Druffel, Xu, Zhang, Trumbore, Eglinton and Hughen2010; Wacker et al. Reference Wacker, Christl and Synal2010), will be partly proportional to ion mass, and thus are partly corrected. This type of evaluation is presently not possible with the abc software, but was realized with a spreadsheet. Admittedly, the difference is small for the data presented in Table 3. In fact, the uncertainties in the present measurement are dominated by counting statistics.
The δ13C values, as measured by the D-REAMS system (AMS δ13C), of the samples graphitized at VERA are consistently heavier than those graphitized at the Weizmann Institute of Science. The difference might have been caused by the different graphitization methods used by the two laboratories (iron catalyst at VERA and cobalt at D-REAMS),Footnote 2 and since all the samples were normalized to oxalic acid II targets that were graphitized at the Weizmann Institute of Science. However, the exact reason for the fractionation differences requires further study. Although the AMS δ13C of the samples graphitized at D-REAMS are rather similar to the expected ones (Table 3), users are discouraged to use them for interpretation. The δ13C values measured by AMS are only useful (and necessary) to correct the isotopic fractionation of the measurement procedure, including the chemical preparation and instrumental influence.
Note that the values of the IAEA C-6 standard are in agreement to those claimed by Xu et al. (Reference Xu, Khosh, Druffel-Rodriguez, Trumbore and Southon2010) of 150.16±0.05 pMC, instead of the official ANU value of 150.61±0.11 pMC.
CONCLUSIONS
The D-REAMS, a dedicated carbon-only AMS system, manufactured by NEC, was installed in January–February 2013, and since then is operational and measures 14C samples routinely. It is part of a research-only laboratory and is not being used for service measurements. Over 4500 known and unknown samples were measured successfully since installation. The operational ion source output is 15–50 µA, and the transmission is 41–43%. An intercomparison study was performed with the Vienna Environmental Research Accelerator (VERA), yielding a difference between laboratories of less than 0.5% for old samples and 0.2% for modern ones, with no clear offset trend. The deviation between the measured and expected values of each standard used in the intercomparison is usually smaller than 0.3% and not larger than 0.5%.
ACKNOWLEDGMENTS
The authors wish to express their gratitude to the Exilarch Foundation and the Dangoor family for providing the funds for the D-REAMS system purchase. We wish to thank Roger Loger from NEC for an excellent installation and guidance, and to the Physical Services technical support team at the Weizmann Institute of Science for their routine assistance. Furthermore, the authors thank the two reviewers for their part in improving this manuscript.