

1. INTRODUCTION
Political philosophers emphasize that there are two important aspects to democracy: aggregation and deliberation. Aggregation is usually achieved through voting in elections. These elections enable society to make social choices when individual preferences conflict. The theoretical analysis of voting can be traced back to the works of Condorcet and Borda and has been the central paradigm in social choice theory since the seminal work of Black (Reference Black1958) and Arrow (Reference Arrow1963). Importantly, where individual preferences come from is not central to the theory of voting. They are simply the inputs which, when combined with an aggregation rule, determine the output (the election winner or set of winners).
The well-known paradoxes of social choice theory have led some to conclude that the aggregative aspect (voting) is not as valuable as might first appear. According to this view, elections matter in that they restrain the behaviour of politicians by subjecting them to periodic electoral tests. They are not in general though a way of discovering the ‘will of the people’. This view is most often associated with the work of Riker (Reference Riker1982).
The importance of the deliberative aspect is associated with philosophers like Habermas (Reference Habermas1996) among others. Habermas argues that public discussion and debate makes people reflect on their judgements. Deliberation is another name for this process of reflection. One possible consequence of deliberation is that people’s judgements may change. Some even go so far as to suggest that everyone in society will hold the same post-deliberation judgements, thus making the problem of social choice trivial. This view is expressed by Elster (Reference Elster, Elster and Hylland1986: 112). He says that under deliberation ‘there would not be any need for an aggregation mechanism, since a rational discussion would tend to produce unanimous preferences’.Footnote 1
It is fair to say that ‘deliberationists’ are more optimistic than Riker about democracy. For deliberationists, a democracy has certain procedural virtues that go beyond voting. For example, Gutmann and Thompson (Reference Gutmann and Thompson2004: 7) define a deliberative democracy as a ‘form of government in which free and equal citizens (and their representatives), justify decisions in a process in which they give one another reasons that are mutually acceptable and generally accessible, with the aim of reaching conclusions that are binding in the present on all citizens but open to challenge in the future’. Viewed this way, democracy involves a dynamic process of open and transparent debate, the aim of which is to lead to understandable social choices being made.
Deliberationists differ on how deliberative democracy should be defined.Footnote 2 However, for the purpose of this paper, we take the deliberationist thesis to be this: by facilitating deliberation, democracy ensures that the ‘correct’ social choice is made. By assuming that a correct social choice exists, we follow Cohen’s (Reference Cohen1986, Reference Cohen, Hamlin and Pettit1989) ‘epistemic’ theory of democracy. One part of Cohen’s theory is his assumption that correct choices exist that are independent of individuals’ judgements and voting. Cohen’s epistemic theory is controversial, and one could argue that deliberation achieves something weaker than correctness. Perhaps the most we can hope for is that deliberation leads to understandable social choices. If democracy does in fact achieve correctness, then the pessimism expressed by ‘aggregationists’ like Riker is, arguably, unjustified.
We should elaborate on our notion of correctness. To do this, we draw from the literature on judgement aggregation.Footnote 3 We assume that there are three alternatives X, Y and Z. We can think of X, Y and Z as representing alternative social states in the sense of Arrow (Reference Arrow1963: 17).Footnote 4 We assume that there exists a non-empty set A called the agenda. A contains propositions that are expressed in a formal language. We assume that the agenda contains the six propositions ‘XPY’, ‘YPX’, ‘YPZ’, ‘ZPY’, ‘XPZ’ and ‘ZPX′. A also contains the negation of these six propositions, and nothing else is contained in A. The proposition ‘XPY′ means ‘X is preferred to Y’, and so on.Footnote 5
A judgement set is a non-empty subset of A. We assume that there are six logically possible judgement sets. Each judgement set corresponds to a strict ordering of X, Y and Z. For example, one possible judgement set is {XPY, YPZ, XPZ, ¬YPX, ¬ZPY, ¬ZPX} which corresponds to the ordering X≻Y≻Z. Each individual holds one of these six judgement sets. On the standard interpretation, an individual’s judgement set contains those propositions in A that the individual believes to be true. Given our epistemic framework, we assume that one of these six judgement sets is ‘correct’ in that it corresponds to the underlying betterness ordering of the alternatives.Footnote 6 The correct social choice is simply the alternative at the top of this ordering. In our framework an individual’s judgements can be more or less correct depending on the proportion of correct propositions contained in the individual’s judgement set.
The suggestion that deliberation can lead people to change their judgements is plausible, but that alone is not sufficient to ensure that the correct social choice is made. Before we get to this important point, let us briefly review the reasons why public discussion and debate can lead people to change their judgements.Footnote 7 First of all, new information is often revealed in public forums. In response to this new information individuals may change their judgements. Secondly, debate forces us to check the logical consistency of our judgements themselves, and also the logical consistency of the arguments we use to justify our judgements. On reflection, we may find that consistency is lacking and so revise our judgements accordingly. For example, in our model, an individual’s judgement set is deductively closed in the sense that if it contains ‘XPY’ and ‘YPZ’ then it also contains ‘XPZ’. However, in real life, individuals may well hold beliefs that are not deductively closed. If this is revealed in a debate, an individual might revise his or her judgements to ensure that they are deductively closed.Footnote 8 Thirdly, and perhaps most importantly, even if our judgements are logically consistent, other people might persuade us that they are incorrect (i.e. false).
For all of these reasons, it seems plausible to imagine that deliberation can cause judgements to change, and that our post-deliberation judgements are ‘more correct’ than our pre-deliberation ones. In other words, we would expect that deliberation increases the proportion of correct propositions contained in an individual’s judgement set. But is this enough to ensure that the correct social choice is made?
Our objective in this paper is to construct a formal model in which there is both a deliberative component and an aggregative component. We introduce a property that captures the essence of the deliberationist thesis. This property is called ‘truthful revelation’.Footnote 9 If a democracy is truth-revealing, then the correct social choice will always be made, irrespective of the original profile of individual judgements and irrespective of the size of the electorate (provided that the latter is finite). The model, which employs techniques from social choice theory, helps us to clarify the conditions under which the deliberationist thesis is true. Although the model is simple, it has interesting implications for deliberationism and also for social choice theory. We would like to highlight some of these.
First of all, deliberationists cannot ignore the choice of an aggregation rule if they want social choices to be correct. Even if, as the earlier quote by Elster suggests, deliberation produces unanimous judgements, our model shows that this is not sufficient for correctness. Secondly, in certain contexts, deliberation can produce something less than unanimity. The distribution of individual judgements may narrow as a result of deliberation, but this narrowing need not lead to a unanimous profile. Surprisingly, it is still possible to ensure correctness in an environment like this. We also show that sometimes the way in which public debate is structured matters. In fact, we may need to be quite prescriptive about public debate in order to ensure that the correct social choice is made.Footnote 10 Deliberationists may be uncomfortable with this idea.
For social choice theory, our model lends support to a hypothesis put forward by Dryzek and List (2003). They argue, among other things, that deliberation can cause ‘structure’ to emerge in the domain of individual judgements. Individual judgements can become single-peaked, for example.Footnote 11 Dryzek and List argue that this structure makes normatively attractive aggregation more likely and helps overcome Arrow’s (1963) famous impossibility theorem.Footnote 12 The idea that deliberation can cause domain restriction is, arguably, not well appreciated in the social choice literature. It is perhaps something that deliberationists can teach aggregationists. In our model structure emerges too as a consequence of deliberation. However, for us, this structure is useful in that it can be exploited to ensure correctness. Correctness is a concept that has no meaning in Arrow’s social choice framework.Footnote 13
Our final point concerns the social choice axiom of unanimity. This axiom says that if everyone’s judgements are identical then these judgements are the collective judgements. On the face of it, this axiom appears plausible because a unanimous profile is one with no conflict. However, the axiom is troubling from an epistemic point of view. Trivially, unanimity does not guarantee correctness. Moreover, a unanimous profile is one in which no social learning can take place. Deliberationists argue (plausibly) that individual judgements can change after a debate, and that this leads to better social choices. A necessary condition for change in people’s judgements is, arguably, some degree of disagreement. This suggests to us that a unanimous profile that arises as a consequence of persuasion has a different normative status to one that does not. Again, this is something that deliberationists can potentially teach aggregationists.
Our paper can be located in the literature on the epistemic implications of different aggregation rules. Two important contributions are Bovens and Rabinowicz (2006) and List (Reference List2005). These authors compare the ability of different aggregation procedures to ‘track the truth’. For example, consider an aggregation problem where collective judgements are sought on the propositions ‘P’, ‘Q’ and ‘R’. Suppose that all individuals form their judgements as to whether these propositions are true or false according to a logical connection rule (R↔(P∧Q)). Assuming the existence of objectively correct truth-values for these three propositions, these authors determine the probability that different aggregation procedures reach the correct decision on proposition ‘R’.
For this kind of aggregation problem, propositionwise majority voting can lead to inconsistent collective judgement sets,Footnote 14 and so these authors compare the truth-tracking ability of the ‘premiss-based’ aggregation procedure with that of the ‘conclusion-based’ aggregation procedure.Footnote 15 They conclude, broadly speaking, that the premiss-based procedure is better at tracking the truth than the conclusion-based procedure. An important difference between these papers and this one is that (as mentioned earlier) we work with a preference agenda. A preference agenda is one where a distinction between premisses and conclusions does not naturally arise. So the kind of comparison made by Bovens, Rabinowicz and List cannot easily be undertaken in our framework. That said, however, we are also interested in ‘tracking the truth’. Our model enables us to derive (in one particular case) a necessary and sufficient condition under which this occurs.
We now explain the central features of the model. The model itself appears in Section 2 and the results appear in Section 3. The final section contains some concluding remarks.
2. MODEL
2.1. Basics
We assume that there are just three alternatives from which a social choice is made. In addition, we assume that at the start of the process (the pre-deliberation stage) at least one individual holds each logically possible judgement. There are a finite number of individuals in society.
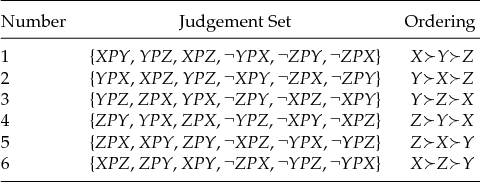
Let us call the three social alternatives X, Y and Z. To each logically possible individual judgement set, we will assign a number. The numbering appears in the following table.
For ease of notation, we write X≻Y≻Z to denote the judgement set {XPY, YPZ, XPZ, ¬YPX, ¬ZPY, ¬ZPX}, and so on.Footnote 16
We can create a graph with the judgement sets as vertices. We join two vertices with an edge if the Hamming distance between these two judgement sets is 2. The Hamming distance between any two judgement sets is simply the number of propositions over which the judgement sets disagree. For example, the distance between judgement set X≻Y≻Z and Y≻X≻Z is 2 since the judgement sets disagree on the propositions ‘XPY’ and ‘YPX’. Therefore these two judgement sets are connected by an edge. The graph formed by this construction is represented in Figure 1. For simplicity, we have used each judgement set’s number for the vertices rather than the judgement set itself.
The Hamming graph.
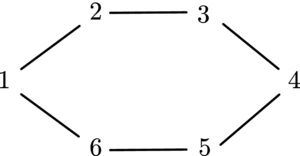
The Hamming distance δ between any two judgement sets (3 and 5, for example) is
 \begin{equation*}
\delta (3,5)=2\times \textrm {the length of the shortest path between 3 and 5.}
\end{equation*}
As we can see, δ(3, 5) is equal to 4. The maximum Hamming distance between any two judgement sets is 6. We use Hamming distance in this paper because it is a widely known metric.Footnote 17
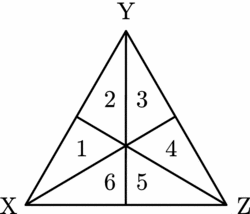
We employ Saari’s ‘geometry of voting’ to obtain our formal results.Footnote 18 First, we create what Saari calls a representation triangle. In an equilateral triangle identify each vertex with an alternative and define a binary relationship of a point in terms of its proximity to a vertex. Thus, point p corresponds to the proposition ‘XPY’ if and only if p is closer to vertex X than to vertex Y.
This relationship subdivides the equilateral triangle where the open regions (the smallest triangles) correspond to different judgement sets.
Importantly, points in each open region correspond to the same judgement set. Points in region 1 correspond to the judgement set X≻Y≻Z. Points in region 2 correspond to the judgement set Y≻X≻Z, and so on. To illustrate which regions correspond to which judgement sets, the numbering from Table 1 is applied in Figure 2. Note that adjacent triangles are a Hamming distance of 2 from each other.
Numbers assigned to judgements.
The representation triangle.
To represent a profile, we put numbers in the open regions.
A profile.
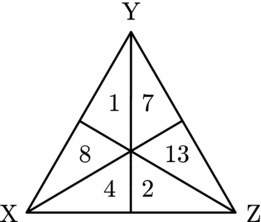
In this example, 7 people hold the Y≻Z≻X judgement set, 4 people hold the X≻Z≻Y judgement set, and so on. Clearly our model satisfies the social choice axiom of anonymity. This says that the names of the individuals do not matter, only the number who hold any particular judgement set.
2.2. Aggregation rules
For the purpose of this paper, an aggregation rule is any member of the family of so-called ‘scoring rules’. This family includes the well-known plurality voting rule and the Borda rule among others. The only admissible aggregation rules we consider in this paper are scoring rules.Footnote 19
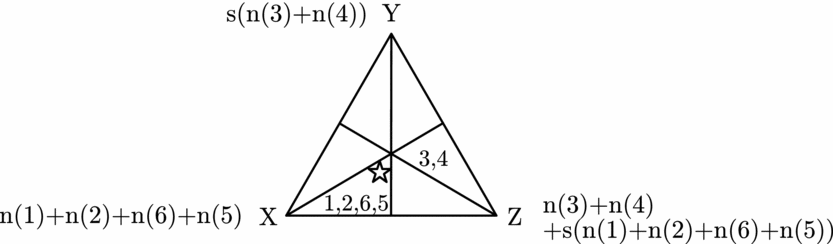
The following figure explains how the representation triangle can be used to derive a score for each alternative.
Scoring rules.

The number by each vertex indicates the number of individuals who judge that alternative to be best plus the number of individuals who judge that alternative to be second best. This second term is weighted by s ∈ [0, 1]. Varying s from 0 to 1 tells us which alternative will be the social choice under different scoring rules. If s = 0 then we have the plurality winner (Z in this example). If s = 0.5 then we have the winner under the Borda rule (again, Z in this example). If s = 1 then we have the winner under the antiplurality rule. The antiplurality rule chooses the alternative that is judged to be the worst by the fewest individuals (Y in the example).
2.3. Deliberation
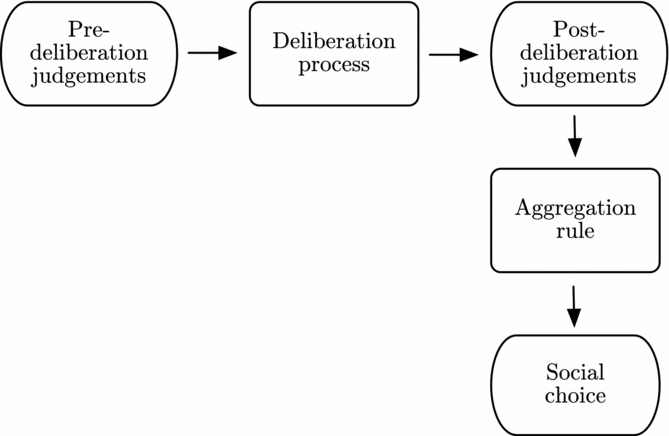
In the standard model of social choice, the inputs into the aggregation rule are preference judgements and the output is a social choice or a social ranking. The standard model is represented in Figure 5.
The standard social choice model.

In our model there is a pre-deliberation stage, a post-deliberation stage, and finally an aggregation stage (where a social choice is made). Our model is represented in Figure 6.
Our model.

Importantly, we assume that at the pre-deliberation stage, at least one individual holds each logically possible judgement set. It is also important to emphasize that deliberation may occur more than once in our model, we do not necessarily move straight from the pre-deliberation stage to the post-deliberation stage. In fact, the post-deliberation stage is just a stage where no further judgement transformation is possible. At this point, a vote is taken with everyone submitting their final, post-deliberation judgements. The outcome of the voting determines the social choice.
We shall now explain the deliberation process. Central to this is the concept of a ‘persuasion group’. A persuasion group is a set of individuals who engage in a debate with one another. Individuals enter a persuasion group, debate with one another and then leave the group. When an individual leaves a persuasion group, her judgements may be different from those she held when she entered it. This reflects the impact of deliberation on her. Of course, an individual’s judgements do not have to change as a consequence of being in a persuasion group. For example, an individual could debate with everyone else in the group and persuade the others that her judgements are correct. In this case, other people’s judgements will change, but not those held by the individual herself.
In our model persuasion groups can be formed in different ways. The critical parameter determining who can join any particular group is given by what we call the ‘persuasion cost’. The persuasion cost is  $\frac{1}{\delta}$ and it takes one of three values,
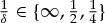 $\frac{1}{\delta}\in \lbrace \infty ,\frac{1}{2},\frac{1}{4}\rbrace$. As mentioned earlier, the parameter δ in this expression is the Hamming measure of distance between judgement sets.Footnote 20
Each persuasion cost induces a value for δ. For example, if  $\frac{1}{\delta}=\infty$ then δ = 0. This value of δ enables us to construct what we term a ‘maximal δ-consistent partition’. This is a partition of the set of individuals with the following characteristics.
1. Each part of the partition contains no two individuals who are more than a distance of δ away from each other (in terms of their judgements).Footnote 21 For example, if δ = 0 then the only partition that satisfies this requirement is {n(1), n(2), n(3), n(4), n(5), n(6)} where n(1) is the set of individuals who hold the X≻Y≻Z judgement set, and so on. Recall that we assume that each logically possible judgement set is held by at least one individual at the pre-deliberation stage.
2. The partition is ‘maximal’ in the sense that the number of equivalence classes is as small as possible given the value of δ. For example, if δ = 2 then the partition {n(2)∪n(3), n(6)∪n(5), n(1), n(4)} is not maximal since it has 4 parts. The partition {n(1)∪n(2), n(3)∪n(4), n(5)∪n(6)} is maximal as it has only 3 parts. Note that the partition {n(1)∪n(6), n(5)∪n(4), n(2)∪n(3)} is also maximal in this case.
3. Individuals with identical judgements are always in the same part of the partition.
A persuasion group is simply a part of any maximal δ-consistent partition.
By varying the cost of persuasion ( $\frac{1}{\delta}$) we can nest various scenarios into the model. For example, if the cost of persuasion is infinite then δ = 0 and only one partition satisfying our requirements is possible ({n(1), n(2), n(3), n(4), n(5), n(6)}). In this extreme situation there will be no change in anyone’s judgements. We assume that judgement change can only occur after a debate has taken place between people who hold different beliefs. This necessary condition for judgement change is not satisfied here (every persuasion group contains individuals with identical judgements). This means that no persuasion will take place; everyone’s post-deliberation (final) judgements will be identical to their pre-deliberation (original) judgements. A social choice is then made by applying these judgements to the aggregation rule.
We would argue that the  $\frac{1}{\delta}=\infty$ case approximates the standard social choice model. In that model, there is an unrestricted domain of preference judgements. This means that any logically possible profile of judgementsFootnote 22 is a potential input into the aggregation rule. Our requirement that at the pre-deliberation stage at least one individual holds each logically possible judgement set means that our domain is restricted slightly. It is, however, close enough to being unrestricted.Footnote 23
As we will see, more interesting cases arise when  $\frac{1}{\delta}=\frac{1}{2}$ and
 $\frac{1}{\delta}=\frac{1}{4}$. In both of these cases, persuasion groups can form containing individuals who are not identical with respect to their judgements. We say that the cost of persuasion is ‘low’ when
 $\frac{1}{\delta}=\frac{1}{4}$. We say that the cost of persuasion is ‘intermediate’ when
 $\frac{1}{\delta}=\frac{1}{2}$. Intuitively speaking, as the cost of persuasion falls, the larger are the potential persuasion groups. An interesting interpretation of
 $\frac{1}{\delta}$ (suggested to us by a referee) is that it can be taken to be a measure of social segregation. A highly segregated society (in which persuasion groups cannot be formed) corresponds to the
 $\frac{1}{\delta}=\infty$ case. As social segregation falls larger persuasion groups are possible.
2.4. Persuasion groups and the objectively correct judgement set
We represent persuasion groups and the objectively correct judgement set geometrically.
We should emphasize that to keep notation simple we sometimes refer to n(1) as the number of type-1 individuals (i.e. the number who hold the X≻Y≻Z judgement set), and on other occasions we refer to n(1) as the set of type-1 individuals. However, it is always clear from the context which we mean.
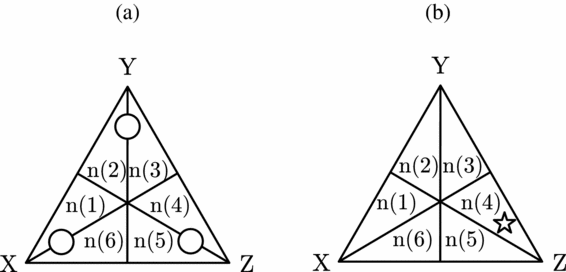
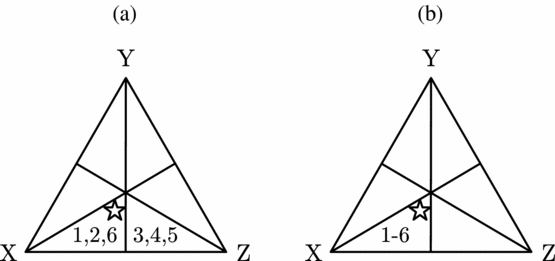
To illustrate this, in Figure 7 the number of individuals who hold the X≻Y≻Z judgement set is n(1), and so on. However, in Figure 7(a), persuasion groups are indicated by circles connecting distinct regions separating different judgement sets. So n(1)∪n(6) is a persuasion group, as is n(2)∪n(3) and n(4)∪n(5). Here we are using n(.) set-theoretically.
(a) Persuasion groups. (b) Correct judgement set.
We depict the objectively correct judgement set (representing the social betterness ordering) by a star symbol, as in Figure 7(b). This judgement set is Z≻Y≻X, and so the correct social choice is Z.
2.5. Judgement transformation
We shall now explain our judgement transformation rule. The rule should appeal to deliberationists. Suppose that a persuasion group is formed containing individuals with different judgements, and that these individuals disagree with respect to the propositions ‘XPY’ and ‘YPX’. Some believe that ‘XPY’ (and hence also believe that ‘¬YPX’), others believe that ‘YPX’ (and hence also believe that ‘¬XPY’). We assume that the individuals whose beliefs are true (in terms of the objectively correct judgement set) can persuade the others that their beliefs are false, and so the latter group will change their judgements accordingly. Individuals then leave the persuasion group with their new judgements. In other words, in a persuasion group, any conflict is always resolved in favour of the truth. Another way of saying this is that when an individual leaves a persuasion group, the proportion of correct propositions contained in this individual’s judgement set rises.Footnote 24
This assumption is broadly consistent with a deliberationist world view. We can think of the objectively correct proposition (either ‘XPY’ or ‘YPX’) as being revealed through debate, with individuals updating their judgements accordingly.
2.6. Deliberation paths
A deliberation path is a sequence of one or more maximal δ-consistent partitions. This sequence starts with the maximal δ-consistent partition that forms in the first stage of the deliberation process (immediately after the pre-deliberation judgements), includes all subsequent maximal δ-consistent partitions, and ends when no part of the partition contains individuals with different judgements.Footnote 25
To make this clear, consider the following example. Assume that δ = 2 with the objectively correct judgement set being X≻Z≻Y. One possible deliberation path starts with the partition {n(1)∪n(6), n(5)∪n(4), n(2)∪n(3)}. Applying our judgement transformation rule, the individuals in n(1) are persuaded by those in n(6) that their judgement on proposition ‘YPZ’ (and also on proposition ‘ZPY’) is false and so they change their judgement on proposition ‘YPZ’ (and ‘ZPY’) accordingly (i.e. they now believe that ‘¬YPZ’ and ‘ZPY’). Essentially, the individuals in n(1) ‘become’ type-6 individuals, i.e. their judgements are now identical to those in n(6). Similar transformations occur across the other parts of the partition. The type-3 individuals become type-2 individuals, and the type-4 individuals become type-5 individuals.
Given this, we can construct new sets n*(6) = n(1)∪n(6), n*(2) = n(2)∪n(3) and n*(5) = n(4)∪n(5).
The second step on the deliberation path involves creating a new partition of n*(6)∪n*(2)∪n*(5). The only maximal δ-consistent partition is {n*(6)∪n*(5), n*(2)}. Again, applying our transformation rule, we now have the sets n**(6) = n*(6)∪n*(5) and n*(2).
Note that the only maximal δ-consistent partition of n**(6)∪n*(2) is {n**(6), n*(2)}. At this stage, the deliberation path ends. This is because the only persuasion groups that form here contain individuals with identical judgements, and hence no more persuasion is possible.
The reader will be able to verify that another possible deliberation path starts with {n(1)∪n(2), n(3)∪n(4), n(5)∪n(6)}. As we will see later, which path we are on has implications for social choice.Footnote 26
2.7. Truthful revelation
Our most important concept is truthful revelation. Our formal model allows us to view a democracy as an ordered pair, the first element of which is the deliberation path and the second element of which is the aggregation rule (taken from the family of scoring rules). We say that an aggregation rule and a deliberation path reveal the truth if the correct social alternative is always chosen irrespective of the original, pre-deliberation profile of judgements and irrespective of the size of the electorate (provided that the electorate is finite). In other words, a truth-revealing democracy will always make the correct social choice through a combination of deliberation and voting; everyone’s original judgements do not matter. The question we ask in this paper is: do truth-revealing democracies exist?
As we will see, when the cost of persuasion is infinite, no truth-revealing democracy exists. Conversely, when the cost of persuasion is low, many truth-revealing democracies exist. In fact, truthful revelation almost always occurs in this setting. Our most interesting result, however, concerns the intermediate case. We identify when and only when truthful revelation occurs in this case. There is one and only one truth-revealing democracy in this setting.
Truthful revelation is a natural property to explore in a model of deliberative and aggregative democracy. The importance of deliberation is reflected in the role of the deliberation path. The importance of aggregation is reflected in the choice of the aggregation rule. In the case of intermediate persuasion costs, we will learn that a unique truth-revealing democracy exists. If we change the aggregation rule (without changing the deliberation path) the democracy will no longer reveal the truth. The same happens if the deliberation path is changed without changing the aggregation rule. This means that deliberation and aggregation are equally important in the model.
2.8. Manipulation
We assume throughout that individuals act sincerely in expressing their judgements so there is no strategic behaviour.Footnote 27 Assuming no strategic behaviour is broadly consistent with a deliberationist world view and we want to build a model under assumptions that are particularly favourable to deliberationism.
Despite this, there is an important sense in which our model is classically strategy-proof. As we will see, if a democracy is ‘truth-revealing’ then at the pre-deliberation stage nobody has any incentive to misrepresent their judgements. The reason for this is that unilateral deviations at any profile of pre-deliberation judgements do not affect the ultimate social choice. That said, we prefer to place the issue of manipulability to one side. What manipulability means in our model is not at all clear, and there are several places where the issue of strategic behaviour could arise (for instance, individuals could choose not to follow our judgement transformation rule which we assume holds universally). For these reasons (and also a desire to keep the model simple), we prefer to interpret behaviour as sincere at all stages in the model. This is in keeping with the spirit of deliberationism, which views the transformation of judgements as reflecting genuine learning rather than as an attempt to manipulate outcomes.Footnote 28
3. RESULTS
3.1. Results using Saari geometry
We state three formal propositions in this paper, one for each value of  $\frac{1}{\delta}$. Let us first consider the
 $\frac{1}{\delta}=\infty$ case. Consider the following example.
When  $\frac{1}{\delta}=\infty$ then δ = 0 and the only maximal δ-consistent partition is {n(1), n(2), n(3), n(4), n(5), n(6)}. As we explained earlier, in this case the pre-deliberation profile is identical to the post-deliberation profile. The deliberation path contains just one maximal δ-consistent partition.
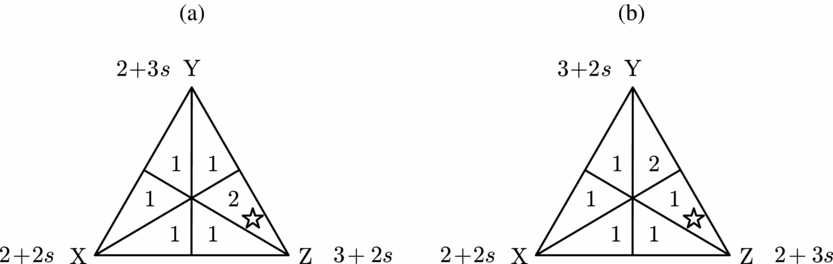
We apply this logic to the profile in Figure 8(a). Using this profile, we see that Z is chosen under the plurality rule (when s = 0). Moreover, Z is the correct social choice. However, it is trivial to see that a profile exists where Z is not chosen under this rule (Figure 8(b)). This argument generalizes. To any profile at which the correct social alternative is chosen (for some particular value of s), there exists a profile at which this alternative is not chosen (for the same value of s). However, truthful revelation requires that we always make the correct social choice irrespective of profile.
 $\frac{1}{\delta}=\infty$ case. (a) Z chosen when s = 0. (b) Z not chosen when s = 0.
This yields the following proposition.
Proposition 1.If the cost of persuasion is infinite, then no truth-revealing democracy exists.
There is an important feature of Riker’s critique of democracy that can be replicated when δ = 0. This concerns the point he makes about different aggregation rules producing different social choices from the same profile of judgements. It is easy to see how this phenomenon can be generated by simply varying the value of the s parameter.Footnote 29
Let us now consider the  $\frac{1}{\delta}=\frac{1}{2}$ case and so δ = 2. There are two deliberation paths to consider here. Let us consider first the path on which the initial partition is {n(1)∪n(6), n(5)∪n(4), n(2)∪n(3)}. The persuasion groups that form here combine all individuals who agree that the same alternative is best. We represent this in Figure 9.
Persuasion groups with a common best alternative.
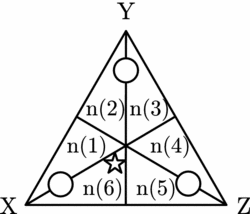
Without loss of generality, assume that X≻Z≻Y is the objectively correct judgement set (representing the social betterness ordering).
Our judgement transformation rule implies that, at the next stage, we have the following profile of judgements. To save space we write 1 instead of n(1), etc.
The subsequent profile.
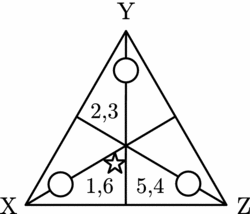
At this stage, the n(2) and n(3) individuals now hold identical judgements. They all hold the Y≻X≻Z judgement set (they are all type-2 individuals, in other words). In addition, the  $n(1)\textrm { and}n(6)$ individuals now hold the X≻Z≻Y judgement set and the
 $n(5)\textrm { and}n(4)$ individuals now hold the Z≻X≻Y judgement set. The Hamming distance between the latter two groups is 2.
This means that we can form one more maximal δ-consistent partition on our deliberation path. This is depicted in Figure 11. Here we combine all individuals who agree that the same alternative is worst.
Persuasion group with a common worst alternative.
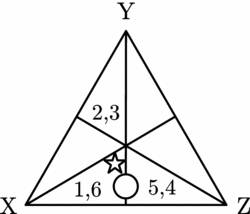
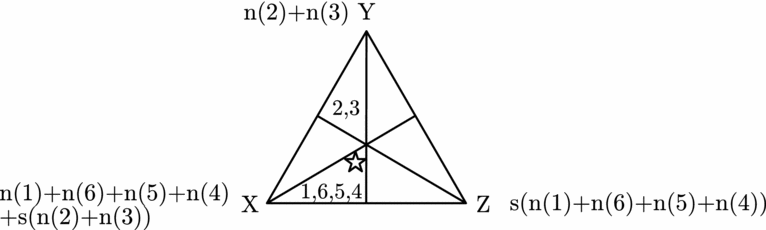
Again, our judgement transformation rule implies that, at the next stage, we have the following profile of judgements. This profile is, in fact, the final post-deliberation profile of judgements. This final profile is represented in Figure 12. As we can see, deliberation has not produced unanimous judgements.
Final, post-deliberation profile.
The score for each alternative is represented by the expression by each vertex. Can a scoring rule guarantee that X is selected? Clearly, this can only happen if
 \begin{equation*}
n(1)+n(6)+n(5)+n(4)+s(n(2)+n(3))>n(2)+n(3).
\end{equation*}
However, this inequality will only hold for every possible electorate if s = 1. In other words, the antiplurality rule will guarantee that the correct social alternative is chosen when applied to this deliberation path, irrespective of the original profile of pre-deliberation judgements and irrespective of the size of the electorate. A truth-revealing democracy exists.
Is it unique? To answer this question, let us consider the only other possible deliberation path that can arise in this case. The initial partition is {n(1)∪n(2), n(3)∪n(4), n(5)∪n(6)}. This is represented in Figure 13.
Persuasion groups with a common worst alternative.
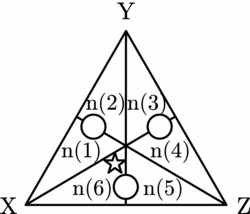
In this case the persuasion groups that form combine individuals who agree that the same alternative is worst.
Our judgement transformation rule implies that, at the next stage, we have the following profile of judgements.
The subsequent profile.
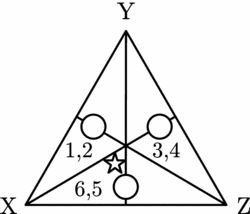
At this stage, the n(3) and n(4) individuals now hold identical judgements. They all hold the Z≻Y≻X judgement set (they are all type-4 individuals, in other words). In addition, the  $n(6)\textrm { and}n(5)$ individuals now hold the X≻Z≻Y judgement set and the
 $n(1)\textrm { and}n(2)$ individuals now hold the X≻Y≻Z judgement set. The Hamming distance between the latter two groups is 2.
This means that we can form one more maximal δ-consistent partition on our deliberation path. This is depicted in Figure 15. Here we combine individuals who agree that the same alternative is best.
Persuasion group with a common best alternative.
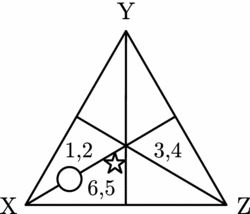
Again, our judgement transformation rule implies that, at the next stage, we have the following profile of judgements. This profile is, in fact, the final post-deliberation profile of judgements. This final profile is represented in Figure 16. Just like before, deliberation has failed to produce unanimous judgements.
Final, post-deliberation profile.
The score for each alternative is represented by the expression by each vertex. Can a scoring rule guarantee that X is selected? Clearly, this can only happen if
 \begin{equation*}
n(1)+n(2)+n(6)+n(5)>n(3)+n(4)+s(n(1)+n(2)+n(6)+n(5)).
\end{equation*}
However, there is no value of s for which this inequality is always satisfied. Truthful revelation does not exist on this deliberation path. Therefore, we have demonstrated the following.
Proposition 2.If the cost of persuasion is intermediate, then a truth-revealing democracy exists. Moreover, this truth-revealing democracy is unique. The deliberation path takes the following form. In the first stage, form persuasion groups consisting of individuals who agree on which alternative is best. In the second stage, form persuasion groups consisting of individuals who agree on which alternative is worst. When the deliberation process is completed, apply the antiplurality rule.
It is important to emphasize that the X≻Z≻Y judgement set (the objectively correct one) used in the proof is entirely arbitrary. The same conclusion would have been reached irrespective of what the social betterness ordering happens to be. In other words, the star could be in any region of the representation triangle and the procedure described above will always ‘work’. Moreover, nothing else will. To state it yet another way, it does not matter what the truth actually is, the above procedure will always track it.
Only the ‘right’ deliberation path combined with the ‘right’ aggregation rule (the antiplurality rule) is truth-revealing. This ‘right’ deliberation path combines individuals who agree on which alternative is best first, and then combines individuals who agree on which alternative is worst. Strikingly, just reversing the order of this deliberation path (combining individuals with a common worst alternative first, and then combining individuals with a common best alternative second), together with the antiplurality rule is not truth-revealing. This asymmetry is surprising. Similarly, using the right deliberation path but changing the aggregation rule is not truth-revealing either. A small reduction in the value of s is all that is required to lose the property of truthful revelation.Footnote 30
It is also worth noting that the deliberation paths we consider when δ = 2 ultimately produce final, post-deliberation profiles that are single-peaked in the sense of Black (Reference Black1958). The process of deliberation produces single-peakedness, even when the ‘wrong’ deliberation path is used. This possibility has been noted before, by Miller (Reference Miller1992), Knight and Johnson (1994) and Dryzek and List (2003). It is also broadly consistent with empirical evidence (see List et al. 2013).
Our final case is where  $\frac{1}{\delta}=\frac{1}{4}.$ In this case δ = 4 and there are several possible deliberation paths. Without loss of generality, assume that the initial partition is {n(6)∪n(1)∪n(2), n(3)∪n(4)∪n(5)}.Footnote 31 Then, Figure 17(a) shows how judgements within these persuasion groups change after the first stage of deliberation. After the second stage, we have a unanimous profile (Figure 17(b)). Of course, X is chosen if and only if s < 1.
(a) Judgement change. (b) Final profile.
This yields the following.
Proposition 3.If the cost of persuasion is low, then truthful-revelation almost always occurs. Any deliberation path and any aggregation rule will be truth-revealing, provided that s < 1.
As is clear from the analysis above, any deliberation path will produce a unanimous profile, but truthful revelation requires in addition that s < 1. Interestingly, the only democracies that fail to be truth-revealing are those that use the antiplurality rule (the antiplurality rule produces a tie, not a victory for X). Strikingly then, the only aggregation rule that works in the  $\frac{1}{\delta}=\frac{1}{2}$ case is the only one that fails in the
 $\frac{1}{\delta}=\frac{1}{4}$ case.
We can perhaps think of the  $\frac{1}{\delta}=\frac{1}{4}$ case as corresponding to Elster’s view of the impact of deliberation. Deliberation produces unanimity, making the problem of social choice (almost) trivial.
3.2. Intuition
We would like to give the general intuition behind Proposition 2.Footnote 32 Suppose that we combine all of the individuals who agree that a particular alternative is best into a persuasion group. We can represent this schematically as
Schematic representation.
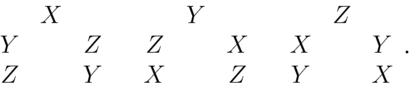
To the far left are the individuals who hold the X≻Y≻Z judgement set, next to them are those who hold the X≻Z≻Y judgement set, and so on. These individuals are in the same persuasion group when we choose the ‘right’ deliberation path (as established by Proposition 2).
When individuals leave these persuasion groups the number of individual types falls from six to three. Critically, our judgement transformation rule implies that we cannot have the following two profiles of judgements arising after the first stage of the deliberation process.
Figure 19.
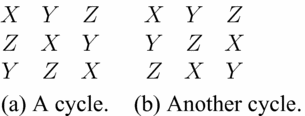
If either of these profiles arise then it means that the social betterness relation is intransitive which contradicts our assumption that it is an ordering.Footnote 33 The only way this contradiction can be avoided is if the new profile has two types who agree that the same alternative is worst. Without loss of generality, assume that this alternative is Y.
There are two things that we can deduce from this. First, Y must be judged to be the best alternative in the only judgement set in which it is not judged to be the worst alternative. Second, Y actually is the worst alternative according to the objectively correct judgement set. To see this second point, note the following. In order for Y to be the worst alternative according to the two judgement sets, it must be the case that it was ‘defeated’ by both Z and X in the debates, and the only way this can happen is if it is genuinely worse than both of them. So we can conclude that Y is, in fact, the worst alternative.
This means that the new profile is one of the following two configurations:
Two configurations.

Again, without loss of generality, let us assume that the objectively correct judgement set contains the proposition ‘XPZ’ and ‘¬ZPX’. Combined with the reasoning above, we can conclude that X is the best alternative according to the objectively correct judgement set. The final stage of the deliberation process combines the two groups of individuals who think that Y is worst. Of course, they too must conclude that ‘XPZ’ and ‘¬ZPX’ and so the individuals in these groups ultimately hold correct judgements. The final profile is, therefore,
Final profile.

Notice here that some individuals judge Y to be the worst alternative and other individuals judge Z to be the worst alternative. However, no individual judges X (the best alternative) to be the worst alternative. This is why the antiplurality rule always makes the correct social choice. Ensuring that this profile structure emerges is the key to truthful-revelation in this particular case (and also in another case that we consider in the next section). The reason why the ‘wrong’ deliberation path fails to work is that it does not produce this profile structure. As the reader can verify (by simply varying the argument above), on that deliberation path the best alternative will actually be judged to be the worst alternative by some individuals at the final profile. Therefore, truthful-revelation cannot occur.Footnote 34
3.3. Extensions
We now present some extensions of our basic model. We state a proposition that is obvious given Proposition 1.
Proposition 4.Irrespective of the number of alternatives, if the cost of persuasion is infinite then no truth-revealing democracy exists.
The converse of Proposition 4 is the following.
Proposition 5.Let n ⩾ 4 denote the number of alternatives. If the cost of persuasion is  $\frac{1}{n(n-1)}$then a truth-revealing democracy exists.
Note that n(n − 1) is the maximum Hamming distance between any two judgement sets. Proposition 5 says (trivially) that we can combine all individuals into one persuasion group. After debating with one another, all of these individuals will hold identical judgements (the objectively correct ones). Simply applying the plurality rule will be truth-revealing. Of course, it is more interesting if truth-revealing democracies can be found when the cost of persuasion is greater than  $\frac{1}{n(n-1)}$. We give an example involving four alternatives, and we assume that the persuasion cost is
 $\frac{1}{6}$.
As in the previous section, combine all of the individuals who agree that a particular alternative is best. The maximum Hamming distance between the individuals in any of these groups is 6 and so this is a maximal δ-consistent partition. When individuals leave the persuasion groups, three of these groups now judge the objectively worst alternative (A say) to be the worst alternative. The individuals in the other group judge A to be the best alternative.
We now form a new maximal δ-consistent partition in which the individuals who agree that A is worst are put into a persuasion group, leaving alone those individuals who think that A is best. The maximum Hamming distance between the individuals who think that A is worst is 6. The individuals in this part of the partition debate with one another and transform their judgements. After deliberation, all of these individuals hold objectively correct judgements.
This leaves us with two groups of individuals: those who judge that A is best and those who judge that A is worst. The Hamming distance between these two sets of individuals is 6 and so we can combine them in a final persuasion group. This produces a unanimous profile of judgements in which all individuals hold the objectively correct judgement set. Applying the plurality rule will ensure that the correct social choice is made. We have demonstrated the following.
Proposition 6.If there are four alternatives and the cost of persuasion is  $\frac{1}{6}$, then a truth-revealing democracy exists.
We conjecture that, in the case of four alternatives, no truth-revealing democracy exists when the cost of persuasion is greater than  $\frac{1}{6}$.
We conclude this section by considering a weakening of our concept of truthful revelation. We call this new concept ‘truth-implementing’. In a truth-revealing democracy the correct social choice is always made, even if the ‘designer’ of that democracy does not know what the correct social choice actually is. But what if the designer does know? Again, we consider the case of four alternatives but now assume a high persuasion cost of  $\frac{1}{2}$. Assume that the designer knows that D is the correct social choice.
In the first stage of the deliberation process, form the maximal δ-consistent partition that is represented by the following configuration:
 \begin{array}{@{\hspace*{49pt}}cccccccccccccccccc}D & & A & D & & A & D & & B & D & & B & D & & C & D & & C\\
A & & D & A & & D & B & & D & B & & D & C & & D & C & & D\\
& B & & & C & & & A & & & C & & & A & & & B\\
& C & & & B & & & C & & & A & & & B & & & A\end{array}
and
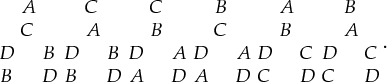 \begin{array}{@{\hspace*{49pt}}cccccccccccccccccc}& A & & & C & & & C & & & B & & & A & & & B\\
& C & & & A & & & B & & & C & & & B & & & A\\
D & & B & D & & B & D & & A & D & & A & D & & C & D & & C\\
B & & D & B & & D & A & & D & A & & D & C & & D & C & & D \end{array}.
Without loss of generality, assume that the objectively correct judgement set is D≻A≻B≻C. Deliberation gives rise to the following configuration:
 \begin{array}{@{\hspace*{80pt}}cccccccccccc}D & D & D & D & D & D & A & C & C & B & A & B\\
A & A & B & B & C & C & C & A & B & C & B & A\\
B & C & A & C & A & B & D & D & D & D & D & D\\
C & B & C & A & B & A & B & B & A & A & C & C\end{array}
We can now form a new maximal δ-consistent partition in which the six columns on the right are combined into three pairs of persuasion groups, and the six columns on the left are combined into three pairs of persuasion groups. After deliberation, this will lead to the following configuration:
 \begin{array}{@{\hspace*{110pt}}cccccc}D & D & D & A & B & A\\
A & B & C & C & C & B\\
B & A & A & D & D & D\\
C & C & B & B & A & C \end{array}
One final maximal δ-consistent partition can be formed which will produce the following post-deliberation profile:
 \begin{array}{@{\hspace*{120pt}}ccccc}D & D & A & B & A\\
A & C & C & C & B\\
B & A & D & D & D\\
C & B & B & A & C \end{array}
Applying the antiplurality rule will always ensure that the correct social choice is made. Notice that the profile structure here has exactly the same property as we described in Section 3.2. We have, therefore, demonstrated the following.
Proposition 7.If there are four alternatives and the cost of persuasion is  $\frac{1}{2}$, then a truth-implementing democracy exists.
We hope that this section has demonstrated some of the ways in which our formal model can be extended. There are, of course, other possible ways of extending the model. We invite the reader to explore some of these possibilities.
4. CONCLUSION
In this paper we have attempted to construct a model of deliberative and aggregative democracy. The deliberationist tradition assumes that individual judgements can change after debate, and that the quality of decisions is enhanced through discussion and social learning. The aggregationist tradition (like much of economics) regards individual judgements as immutable and proposes using them for the purpose of making collective decisions where possible.
Some supporters of deliberative democracy, like Elster (Reference Elster, Elster and Hylland1986), have argued that deliberation alone should lead to unanimity and so there is no need to worry about aggregation. Aggregationists have countered that an emphasis on deliberation and the expression of conflicting opinions can make matters worse by leading to the very lack of structure that leads to impossibility theorems.Footnote 35 According to this view, it is too optimistic to expect greater consensus from deliberation. In an extensive and conciliatory discussion, Dryzek and List (2003) have concluded that both approaches to democracy can be reconciled. They argue, among other things, that deliberation can narrow the domain of individual judgements and make them easier to aggregate in a normatively attractive fashion.Footnote 36 Some empirical evidence exists to support this view.
Our model can be seen as a contribution to this debate. However, our perspective differs quite radically from Dryzek and List in that we are interested in the extent to which deliberation and aggregation can achieve correctness. As mentioned earlier, correctness is a concept that has no meaning in Arrow’s social choice framework. To accomplish this, our model has had to make explicit the process of judgement transformation through deliberation (it specifies a proper deliberation ‘technology’) that precedes the judgement aggregation stage. In the model, a democracy consists of two things: a deliberation path and an aggregation rule. The extent to which persuasion is possible among dissimilar individuals is limited by the ‘persuasion cost’, and when no more persuasion is possible, an aggregation rule chooses an alternative based on the final profile of judgements.
The model can be extended in a number of ways. We treat persuasion as a deterministic process, not a stochastic one. In addition, no significance is attached to the number of individuals who hold any particular judgement. A more elaborate model of judgement transformation through deliberation would address these issues. Our aim has been to produce a simple, analytically tractable model of deliberation that works in conjunction with aggregation. This sheds some light on the mutual interrelationship between aggregation and deliberation, and suffices to show that in a combined model, the ‘epistemically optimal’ aggregation rule depends critically on the persuasion cost involved, and also on the specific deliberation path chosen.
A secondary goal of the paper has been to show how the process of deliberation can be incorporated into classical social choice theory. We feel that the concepts we have introduced are valuable in this respect. Ultimately, we advocate the need to accumulate more empirical evidence about the process of deliberation in specific contexts. These insights could then inform the construction of formal models of deliberation and aggregation.
ACKNOWLEDGEMENTS
Financial support from the Irish Research Council for the Humanities and Social Sciences, the Spanish Ministry of Science and Innovation through MICINN/FEDER grants ECO2010-21624 and ECO2010-14929, and the NUI Galway Millennium Fund is gratefully acknowledged. We are grateful for comments received at a Choice Group seminar at LSE and also those received at a seminar at the Université de Caen. In particular, we would like to thank Nick Baigent, Antoinette Baujard, Richard Bradley, Franz Dietrich, Conal Duddy, Wulf Gaertner, Muriel Gilardone, Christian List, Vincent Merlin, Marcus Pivato, Maurice Salles, Kai Spiekermann and Katie Steele for their helpful comments. We owe a large intellectual debt to the work of Christian List. Two of his papers, Dryzek and List (2003) and List (Reference List2011), inspired us to work on this problem. We are extremely grateful for the helpful comments of Gerald Pech, two anonymous referees and those of the Editor.