Nomenclature
- C
-
root chord of the wing
-
 ${C_d}$
-
blade element drag coefficient
-
${C_l}$
-
blade element Lift coefficient
- CG
-
centre of gravity
- cm
-
centimeter
- FQR
-
flying quality rating
- g
-
gram
- IC
-
initial condition
- ISC
-
inertial stability criterion
-
${I_{xx}}$
-
MOI of the first (X) axis
-
${I_{yy}}$
-
MOI of the second (Y) axis
-
${I_{zz}}$
-
MOI of the third (Z) axis
- KN
-
transformation matrix from the initial frame to the principal frame
-
$\mathop M\limits^ \rightharpoonup $
-
vector from the CG to the quarter station of the mean aerodynamic chord
- MAC
-
mean aerodynamic chord
- MOI
-
moment of inertia
-
$\mathop n\limits^ \rightharpoonup $
-
unit angular velocity vector
- The P Axis
-
axis consisted of two carbon fibre rods to support the wing
- The R Axis
-
axis skews away from the P axis with some angles to support clay masses
- r
-
radius of the blade element
- U
-
descending speed of the Samara
-
$\widehat x$
-
X axis
-
$\widehat y$
-
Y axis
-
$\widehat z$
-
Z axis


Greek symbol
-
${\alpha _r}$
-
angle-of-attack at a certain blade element
-
$\varepsilon $
-
angle between the principal X axis to the body X axis
-
$\xi $
-
angle between the R axis and the P axis
-
$\eta $
-
angle between the principal X axis to the vector drawn from the CG to the quarter station of the mean aerodynamic chord
-
$\Omega $
-
scalar angular rate of the Samara
-
$\vec \omega _{K/N}^K$
-
angular velocity in the principal frame with respect to the inertial frame
-
$\phi $
-
Euler angle rotation around the x axis
-
${\phi _{eff}}$
-
Euler angle
$\phi $
as seen by incoming wind -
$\theta $
-
Euler angle rotation around the y axis (coning angle)
-
$\psi $
-
Euler angle rotation around the z axis
-
$\gamma $
-
flight path angle
-
$\tau $
-
torque


Superscript
- B
-
body coordinate
- K
-
principal coordinate
- N
-
inertial coordinate
Subscript
- R
-
resultant force component
- S
-
side force coordinate
- T
-
tangential force coordinate
- V
-
vertical coordinate
1.0 Introduction
Natural Samara refers to a large family of winged achene with a variety of aerodynamic mechanisms to reduce their descent rate while being dispersed by the wind. One of the most common mechanisms features a single wing with a single seed attached near the root of the wing. When a seed disperses from its mother tree, it falls freely and tumbles at first and then starts a stable azimuthal autorotation, similar to a helicopter’s main rotor spiraling down to the ground. We can generally categorise the flying states of a Samara into three phases (1) free falling from its initial status, (2) transition from the free falling to stable autorotation, and finally (3) stable autorotation in helical flight path. Observing this autorotation from an inertial view (laboratory view), the seed only rotates about its vertical traveling path. The focus of this investigation is to understand the mass properties required to ensure successful transitions to stable autorotation on an artificial Samara-like decelerator.
To our knowledge, no paper has attempted to quantitatively define the criteria of successful transition. Norberg [Reference Norberg1] qualitatively describes the kinematic motions of the transition. He mentioned that bent, twisted or undulated trailing edges facilitate rapid transitions to autorotation. The eccentric centre of gravity (CG) along the wing span direction is essential to excite rotating motion due to the inertial force and the force of gravity. His experiments determined that the CG of the entire Samara must lie between 0% and 30% of the span length from one end. He also segmented a sample of Samara into nine chord-wise strips. The local CG of each strip roughly coincides with the overall CG of the Samara. The continuous connection of local CGs form the mass axis. He believes the chord-wise location of the mass axis along with the wing planform governs the Samara’s pitching stability.
Kellas [Reference Kellas2] presented the first six-degree-of-freedom mathematical model of a controllable artificial Samara (monocopter), based on steady blade-element momentum theory. Due to the limitation of the model, his simulation could not be used to investigate the dynamics of transitions. However, he pointed out an important discovery that a forward-tilted eigenvector with the minimum moment of inertia (MOI) is essential for successful transition and stable autorotation. The forward-titled eigenvector is described with respect to the wing span axis for a rectangular wing planform.
Varshney et al. [Reference Varshney, Chang and Wang3] recorded the kinematics of transitions with a high-speed camera. In addition to testing the Samara with its natural forms, testing samples were cut to reduce the chord. Adopting Kellas’ explanation of the principal coordinate system, the importance of the principal axis with the minimum MOI was supported. The three essential qualitative requirements to successful autorotation were confirmed.
To quantitatively understand the influence of the direction of principal axis with minimum MOI,
 ${\widehat x^K}$
, and its MOI,
 $I_{xx}^K$
, to the transition stability, carefully designed artificial Samaras are used in experiments that can alter
 ${\widehat x^K}$
without changing the location of CG. In other words, both the eigenvectors and the eigenvalues of the mass distribution are explored. It is inevitable to change the MOI on three principal axes while changing the directions of
 ${\widehat x^K}$
, but the apparatuses are designed such that there will always be pairs of experimental data sharing the same principal Z axis MOI. Even though the principal Z axis MOI are different between different pairs, a particular pair can serve for controlled comparisons. By testing all combinations of mass properties as planned, the results can be used to develop the inertial stability criteria, a parametric figure to determine a Samara’s transition stability. The transition stability is stable if a Samara can repeatably initiate and maintain autorotation after released from some initial condition. It is unstable if a Samara cannot autorotate or cannot sustain the autorotation.
2.0 Experimental apparatus and results
2.1 Design of apparatuses
An artificial Samara consists of four parts: (1) a 3D printed centre body, (2) thin carbon fibre rods, (3) a wing made by balsa wood, and (4) FidgetGear adhesive clay. The centre body connecting four carbon fibre rods serves as the main structure for the wing as well as the clay to alter the mass properties. Two inline rods are defined as the P axis, coinciding with the body Y-axis
 $({\widehat y^B})$
, to which the wing is attached on by very thin, light-weight paper tape. The paper tape has been tested that is strong enough to firmly hold the wing under all experiment conditions. A balance mass is added to the other side of the centre body to account for the weight of the wing, keeping the CG at the centre of the centre body, at which is defined as the origin of the body coordinate. Another two rods are placed inline and are attached to the centre body. These two inline rods form the R-axis, which has an angle
 $(\xi )$
with respect to the P-axis. Three baseline models are made with
 $\xi { = 30^ \circ }{,45^ \circ }$
, and
 ${60^ \circ }$
.
Four 0.5g pieces of clay are formed into spherical shapes to approximate point masses. A pair of clay spheres moves along the P-axis and the other pair moves along the R-axis. Each pair always moves symmetrically, an equal distance from the centre, in order to keep the CG position unchanged. By moving these two pairs of clay, a range of angles between
 ${\widehat x^K}$
and
 ${\widehat y^B}$
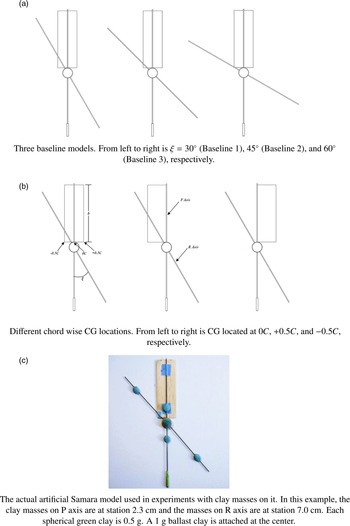
can be swept. A 1g sphere of clay is placed on the centre body, serving as a reserved ballast to expand the the sweeping range. By equally splitting it into two parts, the clay can be arbitrarily placed on either the P axis or the R axis if needed. The total weight of a complete model with the clay attached is 5.5g. The wing has a rectangular planform (3
 $ \times {\kern 1pt} 9$
cm) with the aspect ratio of 3. It is a simple flat plate [Reference Norberg1]. Due to limitations of the testing environment, the higher wing loading design is used to obtain better control when tossing the models for testing, as described in the next section. Typical disk loading of natural Samaras can be found in Ref. [Reference Azuma and Yasuda4].
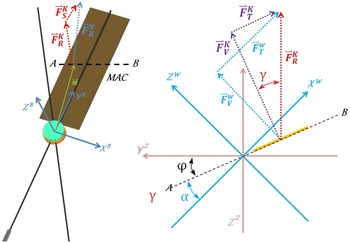
All baseline models place the wing span direction parallel to the P-axis and keep the chord-wise CG at the semi-chord, which is defined as 0 C in this paper. An example of a baseline model and its definition of coordinate systems are shown in Fig. 1a. The constant chord wing implies the mean aerodynamic chord (MAC) locating at the semi-span. Figure 1b presents the Euler angle transformation that will be extensively used in the Section 3. It is brought to reader’s attention here that the conventional definition of the coning angle
 $(\theta )$
is the angle between the North-East-Up (NEU) inertial coordinate to the span-wise axis. A typical coning angle is around
 ${10^ \circ }$
to
 ${30^ \circ }$
[Reference Azuma and Yasuda4]. In this paper, the coning angle is defined as the angle between the inertial X-axis
 $({\widehat x^N})$
to the principal X-axis
 $({\widehat x^K})$
. However, the difference of the quantity should be negligible from the value defined in the conventional way. Figure 2a presents three baseline models that will be studied in this investigation. The sign of the non-dimensional chord station follows the definition of the body coordinate. Figure 2b presents the morphology of a baseline model with three different CG locations along the chord-wise direction.
Definition of the coordinate systems.

Experiment apparatuses.

2.2 Experiment procedures and data collection methodologies
Due to the limitations of facilities, instead of dropping the models statically from a high building, the models are tossed at least 3.6m
 $ (\pm $
0.3m) above the ground to test the success rate of transitions. Each model was launched with the wingtip down, and the wing was perpendicular to the ground. Models were thrown vertically upward by hand with minimal rotation in all axes. All experiments are conducted during the days of still air with a temperature range between 78 and 85 degree Fahrenheit.
A nearby building with markings on the wall was used to assist the author to determine whether a toss is straight upward. The testing models with higher wing loading also facilitated the consistency of this initial condition (IC). It was found that with some practices, the author can easily toss testing models in consistent and straight upward manner. All testing models can reach the apogee of the launching trajectory maintaining the wingtip down attitude.
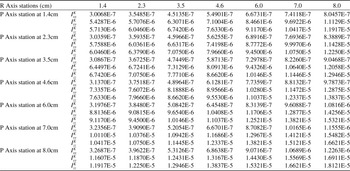
As described in the previous section, the clay masses were progressively positioned at the following stations on the P-axis and the R-axis: 1.4, 2.3, 3.5, 4.6, 6.0, 7.0 and 8.0cm, which produces a
 $7 \times 7$
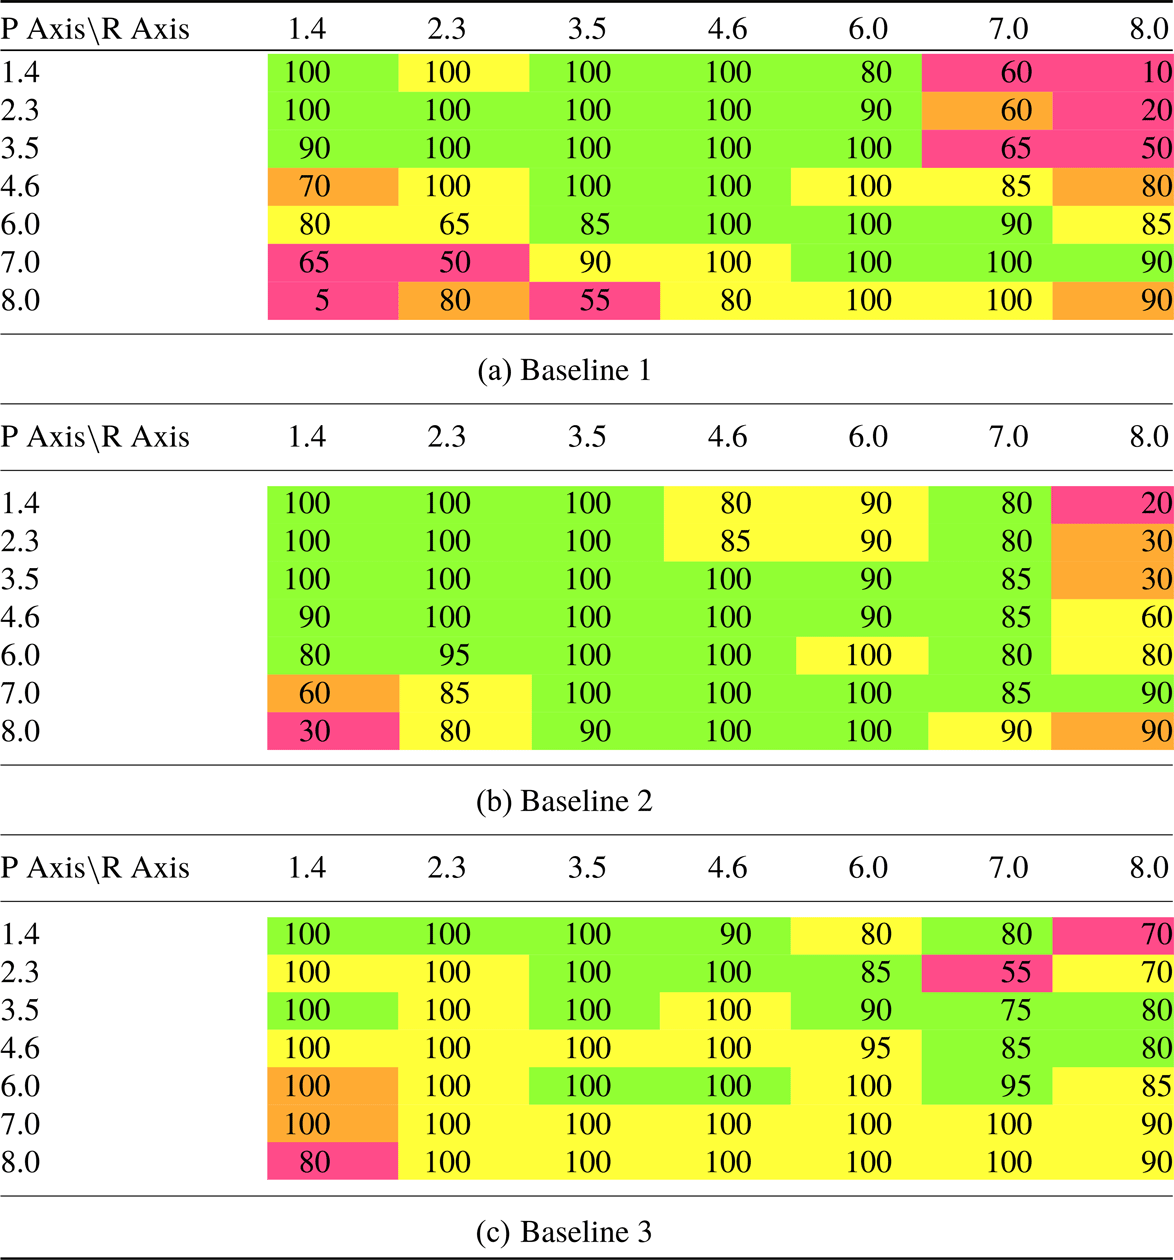
matrix of MOI properties for each baseline model. An example of MOI matrix of a particular baseline model is provided in the appendix. Each MOI configuration was launched 20 times. It is conceived 20 successful autorotation, or sustainable autorotation, out of 20 launches as stable regime of transition stability. If a launch fails, for example, the model rotates or the tossing trajectory is not straight, it will not be included and make-up tosses will be perform until reaching 20 times satisfactory launches. Each successful transition was recorded, and a flying quality rating (FQR) was assigned for each test. The flying quality rating (Table 1) is an objective kinematic observation of the apparatus in steady autorotation. Green, Yellow, Orange and Crimson are used to distinguish the ratings.
Flying quality rating

2.3 Experimental results and discoveries
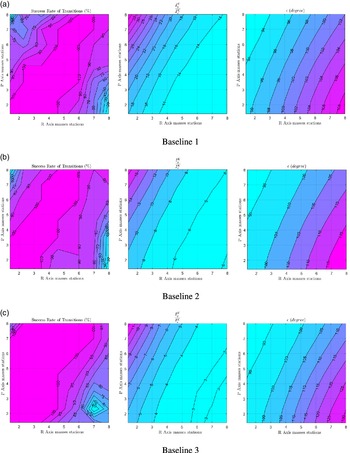
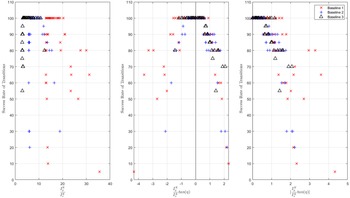
The success rate of transitions correlates to the different mass properties, as shown in Fig. 3a, 3b and 3c. The 100% successful transitions are distributed diagonally across the domain, with lower success rates of transition at the upper left and lower right corners. Connecting these two corners, we find it is roughly perpendicular to the isolines of
 $\frac{{I_y^K}}{{I_x^K}}$
as well as the
 $\varepsilon $
angle, which is the two-dimensional angle between
 ${\widehat x^K}$
to
 ${\widehat x^B}$
(Fig. 1a). Since the testing models have very small X-Z and Y-Z asymmetries (three order of magnitude less than the X-Y product of inertia), the products of inertia of these two parts are neglected. The transformation from the principal frame to the body frame is essentially an Euler angle rotation about the principal Z axis. It is also true for most of natural Samara that the X-Z plane is roughly a plane of symmetry.
This pattern implies for a certain range of
 $\frac{{I_y^K}}{{I_x^K}}$
and
 $\varepsilon $
, successful transitions are nearly certain. However, the criteria are indefinite since the successful ranges of
 $\frac{{I_y^K}}{{I_x^K}}$
and
 $\varepsilon $
vary between the three baseline models. Furthermore, This pattern of Baseline 3 changes at the lower left corner, which implies some other effects influence on the stability when we altering the mass distribution parameters (stations of clay masses). Thus the stability criteria are not solely depending on either
 $\frac{{I_y^K}}{{I_x^K}}$
or
 $\varepsilon $
along. The FQR charts (Table 2) also show similar patterns as we have seen in Fig. 3, which implies the dynamics of transitions also plays an important role in autorotation.
The FQR charts for three baseline models; numbers in cells are the success rate of transitions with corresponding FQR rating presenting in colors

The success rate of transitions correlating to the three baseline mass properties.

The experiments revealed that the chord-wise CG of the Baseline 2 at +0.5 C and keep the clay on the P-axis at 7cm (with the 1g ballast at the centre), a bifurcation of the rotation direction occurs as the clay is moved along the R-axis from 1.4 to 8.0cm. Starting from 1.4cm, the model autorotates in the negative inertial Z-axis direction (the clockwise direction looking from the top of the model). As the clay moved to 3.5, 4.6 and 6.0cm, the model started struggling to enter autorotation. At 7.0cm, it was not able to achieve successful transition. It was observed that the model did initiate rotation about the inertial Z-axis at the very beginning of the autorotation, but it only achieves about a quarter of a rotation, and the motion was not able to sustain. The wing quickly flapped up falling like an arrow. The model regained more successful transitions when the clay was at 8.0cm, even though the FQR was not high. In this mass configuration, the direction of autorotation changed to rotate in the positive inertial Z-axis (counter-clockwise looking from the top of the model). To further explore this phenomenon, the 1g ballast was divided into two 0.5g clay masses and was attached to the original clay masses on the R-axis. Moving the new clay masses along the R-axis, starting from 6.0 to 8.0cm, the transition stability was improved, reflected in a higher FQR, and the autorotation direction was in the positive inertial Z-axis. This discovery contradicts Norberg’s assertion that a Samara model has the best autorotation stability when the CG locates between 27% and 35% of the chord [Reference Norberg1]. The same bifurcation was also discovered on the Baseline 1 model with the CG at +0.5 C. The phenomenon will be further discussed in Section 4.3.
3.0 Principles of Samara dynamics
3.1 Samara dynamics in steady states
The experiments demonstrated that the directions of
 ${\widehat x^K}$
with respect to the Samara body axes have a direct contribution to the stability in transitions. The results also show that the principal MOI has a direct connection to the stability as well. According to the results of FQR charts, it is helpful to understand the dynamics of transitions by looking into the dynamics of Samara in steady autorotation.
The the NEU inertial frame is denoted with superscript N and the Samara’s principal frame is denoted with superscript K. When a Samara is autorotating in steady states (no accelerations for both translational and angular motions), there is an unit vector,
 $\vec n$
, that does not change with time in the inertial frame. The dynamic of
 $\vec n$
can be expressed as Equation (1)
 \begin{align}{\dot{\vec{n}}^K} = [KN]{\dot{\vec{n}}^N} - \vec \omega _{K/N}^K \times {\vec n^K}\end{align}
The [KN] is the coordinate transformation matrix from the initial frame to the principal frame.
 $\vec \omega _{K/N}^K$
is the Samara angular velocity in the principal frame with respect to the inertial frame. Since the Samara is in steady state, both
 ${\dot{\vec{n}}^K}$
and
 ${\dot{\vec{n}}^N}$
are equal to zero. We now have the equation
 $\vec \omega _{K/N}^K \times {\vec n^K} = 0$
, which implies the vector
 ${\vec n^K}$
is parallel to
 $\vec \omega _{K/N}^K$
if it is a non-zero vector [Reference Zhang, Mueller and D’Andrea5].
 \begin{align}{\vec n^K} = \pm \frac{{\vec \omega _{K/N}^K}}{{|\vec \omega _{K/N}^K|}}\end{align}
The positive
 ${\vec n^K}$
is used representing the angular rate vector pointing upward in the inertial frame. For a typical Samara, the direction of the steady autorotation in the inertial frame can be written as Equation (3), where
 $\Omega $
is the scalar angular rate of the Samara.
 \begin{align}{\vec n^N} = \pm {\left[ {\begin{array}{*{20}{c}}0\\[2pt]0\\[2pt]\Omega \end{array}} \right]^N}\end{align}
The kinematic differential equation of the 3-2-1 Euler angle presenting
 ${\vec n^N}$
in the principal frame can be derived as Equation (4). The definition of Euler angles can be found in Fig. 1b.
 \begin{align}{\vec n^K} = \pm \frac{{\vec \omega _{K/N}^K}}{{|\vec \omega _{K/N}^K|}} = \pm {\left[ {\begin{array}{*{20}{c}}{ - \sin \theta (\Omega )}\\[2pt]{\cos \theta \sin \phi (\Omega )}\\[2pt]{\cos \theta \cos \phi (\Omega )}\end{array}} \right]^K}\end{align}
Euler’s equations in steady state can be simplified as Equation (5).
 $I_{xx}^K$
,
 $I_{yy}^K$
, and
 $I_{zz}^K$
are principal moment of inertia in
 ${\widehat x^K}$
,
 ${\widehat y^K}$
, and
 ${\widehat z^K}$
, respectively.
 \begin{align}\vec \tau _x^K = \vec \omega _y^K\vec \omega _z^K\left(I_{zz}^K - I_{yy}^K\right)\end{align}
 \begin{align}\vec \tau _y^K = \vec \omega _x^K\vec \omega _z^K(I_{xx}^K - I_{zz}^K)\end{align}
 \begin{align}\vec \tau _z^K = \vec \omega _x^K\vec \omega _y^K\left(I_{yy}^K - I_{xx}^K\right)\end{align}
Substituting the elements of
 ${\vec n^K}$
into Equation (5), Euler’s equations as functions of Euler angles can be obtained as Equation (6). Define the Samara rotating in positive
 ${\widehat z^N}$
.
 \begin{align}\vec \tau _x^K = (\cos \theta {)^2}\sin \phi \cos \phi {(\Omega )^2}\left(I_{zz}^K - I_{yy}^K\right)\end{align}
 \begin{align}\vec \tau _y^K = ( - \cos \theta )\cos \phi \sin \theta {(\Omega )^2}\left(I_{xx}^K - I_{zz}^K\right)\end{align}
 \begin{align}\vec \tau _z^K = ( - \cos \theta )\sin \phi \sin \theta {(\Omega )^2}\left(I_{yy}^K - I_{xx}^K\right)\end{align}
The directions of torques in the principal frame that sustain a Samara’s stable autorotation can thus be determined, since the signs of
 $\phi $
and
 $\theta $
are well documented in the literature. Note the coning angle in Equation (6) must be a negative quantity, since it is transformed from the inertial coordinate. The sign follows the direction of the coordinate rotation (Fig. 1). Even though
 $\phi $
has been recorded as a negative quantity [Reference Azuma and Yasuda4, Reference Lentink, Dickson, Van Leeuwen and Dickinson6], it is physically possible to have a rotor autorotating with positive
 $\phi $
. In fact, it has been shown that the optimum autorotation performance of a rotor is obtained at slightly positive
 $\phi $
[Reference Gessow and Myers7]. In the Section 4, the positive
 $\phi $
will be shown that plays a role to facilitate stable transitions.
The geometry of a natural Samara as well as the artificial versions used in this investigation have different MOI along each axis
 $(I_{zz}^K \ne I_{yy}^K \ne I_{xx}^K)$
, and the minimum MOI in the direction of
 ${\widehat x^K}$
is near the span-wise direction. A strict property of MOI is defined in Equation (7) and will be used throughout the manuscript. Because the wing chord only extends on the XY plane of the body frame,
 $I_{zz}^K$
is always slightly higher
 $I_{yy}^K$
as the clay mass stations are changed.
 \begin{align}I_{zz}^K \gt I_{yy}^K \gt I_{xx}^K\end{align}
For negative
 $\phi $
, we obtain
 $\tau _{xx}^K$
,
 $\tau _{yy}^K$
, and
 $\tau _{zz}^K$
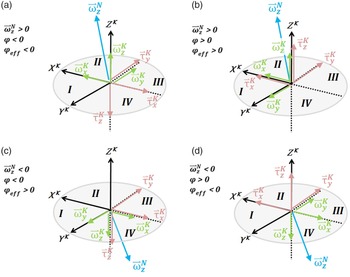
are all negative (scenarios (a) and (c) in Fig. 4). For positive
 $\phi $
,
 $\tau _{yy}^K$
is still a negative quantity due to
 $\cos \phi $
in the equation.
 $\tau _{xx}^K$
and
 $\tau _{zz}^K$
are positive (scenarios (b) and (d) in Fig. 4). Furthermore, the
 ${\Omega ^2}$
implies the bi-directional property of
 $\Omega $
for both positive and negative
 $\phi $
. We then have four possible combinations of torques and autorotation directions for a Samara in steady states.
 $\tau _{xx}^K$
,
 $\tau _{yy}^K$
and
 $\tau _{zz}^K$
are torques required to sustain steady autorotation, and they are unarguably resulting from aerodynamic forces.
Four mathematically possible scenarios of equilibrium.

Scenario (a) in Fig. 4 shows that for negative
 $\phi $
, the centre of pressure of the wing must be in the quadrant 2 to generate negative
 $\tau _{yy}^K$
(the wing flapping up) and negative
 $\tau _{xx}^K$
(the wing pitching down). The negative
 $\tau _{zz}^K$
results from the drag of the wing. It is concluded that for negative
 $\phi $
, the
 ${\widehat x^K}$
must lead the chord-wise centre of pressure in the direction of the autorotation to achieve steady autorotation. Scenario (b) in Fig. 4 shows that for positive
 $\phi $
, the centre of pressure of the wing must be in the quadrant 1 to produce negative
 $\tau _{yy}^K$
(the wing flapping up) and positive
 $\tau _{xx}^K$
(the wing pitching down). The positive
 $\tau _{zz}^K$
results from the thrust of the wing. It is concluded that for positive
 $\phi $
, the
 ${\widehat x^K}$
must lag behind the chord-wise centre of pressure in the direction autorotation to achieve steady autorotation.
Another way to examine scenarios (a) and (b) in Fig. 4 is by the fact that
 $\tau _{yy}^K$
is always negative. Rewrite Equation (5b) as Equation (8b). It is clear that
 $\vec \omega _x^K\vec \omega _z^K(I_{zz}^K - I_{xx}^K)$
must be a positive quantity. In consequence,
 $\vec \omega _x^K$
and
 $\vec \omega _z^K$
must be the same sign [Reference Varshney, Chang and Wang3]. For scenario (a), the coupling angular velocities
 $\vec \omega _x^K$
and
 $\vec \omega _z^K$
are in opposite directions to the applied torques
 $\vec \tau _x^K$
and
 $\vec \tau _z^K$
, respectively. For scenario (b), this relationship is reversed.
 \begin{align}I_{xx}^K\dot{\vec{\omega}} _x^K = \vec \tau _x^K + \vec \omega _y^K\vec \omega _z^K\left(I_{yy}^K - I_{zz}^K\right)\end{align}
 \begin{align}I_{yy}^K\dot{\vec{\omega}} _y^K = \vec \tau _y^K + \vec \omega _x^K\vec \omega _z^K\left(I_{zz}^K - I_{xx}^K\right)\end{align}
 \begin{align}I_{zz}^K\dot{\vec{\omega}} _z^K = \vec \tau _z^K + \vec \omega _x^K\vec \omega _y^K\left(I_{xx}^K - I_{yy}^K\right)\end{align}
Scenario (c) is actually the same dynamics in the steady state as (b), but rotating in the negative
 ${\widehat z^N}$
direction, which can be seen from the directions of the applied torques and the coupling velocities. The Euler angle
 $\phi $
is negative to conform to the rules of Euler angle rotations, but it is actually a positive quantity as seen by the incoming wind (denoted as
 ${\phi _{eff}})$
. The scenario (d) can be saw in the same way to scenario (a). This is the bi-directional property mentioned earlier. There are only two distinctive equilibrium modes.
So far it has been shown that positive and negative
 $\phi $
can mathematically exist if the location of the centre of pressure is properly placed with respect to
 ${\widehat x^K}$
, and the resultant force along the chord-wise direction is properly formed. However, a positive value of
 $\phi $
is realistically impossible to achieve for a Samara. We can understand this instability by examining an autorotation diagram (Fig. 5), which consists of the characteristic of a given rotor blade element as a function of element angle-of-attacks,
 ${\alpha _r}$
. The characteristic is described by arctangent of the drag coefficient,
 ${C_d}$
, over the lift coefficient,
 ${C_l}$
, which is also known as the flight path angle
 $(\gamma )$
. It is physically corresponding to the lift-to-drag ratio, or the advance ratio, of a given two-dimensional aerofoil.
 $\gamma $
is plotted on the vertical axis against
 ${\alpha _r}$
on the horizontal axis, to which is drawn to the same scale for both the vertical and the horizontal quantities. Each point on the horizontal axis corresponds to the
 $\gamma $
of the pointed
 ${\alpha _r}$
. By connecting all
 ${\alpha _r}$
, a continuous blade element characteristic curve at equilibrium can be formed [Reference Gessow and Myers7].
An autorotation diagram and the blade element taken from Ref. [7]. The nomenclature is modified to the conventions used in this manuscript.

By definition of Equation (9a), draw a
 ${45^ \circ }$
line (line abc in Fig. 5) from a known value of
 $\phi $
 $({\phi _1}$
in Fig. 5) on the horizontal axis. Because the opposite is equal to the adjacent on an isosceles right triangle, the length of the vertical axis (the opposite) is the
 $\gamma $
angle for a given blade element under a certain
 ${\alpha _r}$
condition. The acceleration of autorotation is split into two regions by the blade element characteristic curve. If the
 ${\gamma _1}$
in Fig. 5 is right on the blade element characteristic curve, the point (b), autorotation is at the equilibrium condition. If the
 ${\gamma _1}$
is at the point (a) larger than the equilibrium
 $\gamma $
angle under some perturbed condition, the resultant force tilts forward, causing acceleration of the autorotation. By definition of
 $\gamma $
in an alternative form (Equation (9b)), where r is the radius to the blade section), it is inversely proportional to the angular speed of autorotation if
 $\gamma $
is small, and the change in the vertical speed component, U, is negligible (for example under steady descending conditions). The acceleration leads to a reduction in
 ${\gamma _1}$
back to the equilibrium point at the point (b). The same mechanism applies to the perturbation when
 ${\gamma _1}$
is at the point (c). The autorotation will slow down to increase the
 $\gamma $
to restore equilibrium. Therefore the flight path angle stability for the autorotation is dynamically stable as long as the
 $\phi $
is less than the maximum limit as defined by the point (d). Any small positive increment of
 $\gamma $
angle from the point (d) will result in a deceleration and a further increase the
 $\gamma $
, which produces negative torque and stops the autorotation. Mathematically speaking, the point (d) is a half-stable node for
 $\gamma $
angle, and any
 $\gamma $
angle smaller than the point (d) on the blade element characteristic curve are stable nodes. Note if the line abc in Fig. 5 keeps on going and intercepts the curve at an even larger
 $\gamma $
, it is an unstable node. Another perspective on the stability of angular acceleration of a blade section is by looking at the horizontal perturbation of
 $\phi $
. If a positive small perturbation on
 $\phi $
is given at the point (f), the
 $\gamma $
will move to the accelerating region, thus restoring equilibrium. If the perturbed
 $\phi $
keeps on increasing, the restored
 $\gamma $
will eventually reach the point (d) and stop the autorotation. Note the equation of
 ${\alpha _r}$
is not following the conventional flight dynamics definition. The
 $\gamma $
is always positive for negative glide slopes.
 \begin{align}{\alpha _r} = \phi + \gamma \end{align}
 \begin{align}\gamma = \arctan \left(\frac{U}{{\Omega r}}\right)\end{align}
For traditional gyrocopters or helicopters in autorotation, it is essential to have most of the blade elements
 $\gamma $
intercepting before the point (d) to maintain the stability of the rotor speed. However, it is a different story on Samaras. Reports have shown that Samara operate in post-stall
 ${\alpha _r}$
throughout almost the entire wing span [Reference Azuma and Yasuda4, Reference Lentink, Dickson, Van Leeuwen and Dickinson6]. It is about
 ${65^ \circ }$
at the root to
 ${10^ \circ }$
at the tip.
 $\phi $
are slightly negative. From Refs. [Reference Azuma and Yasuda4] and [Reference Lentink, Dickson, Van Leeuwen and Dickinson6], it is about
 $ - {0.1^ \circ }$
to
 $ - {3.5^ \circ }$
. In Ref. [Reference Green8], the measurements of
 $\phi $
are higher, from
 $ - {9.0^ \circ }$
to
 $ - {12.6^ \circ }$
. Figure 6 shows the flat plate aerofoil section characteristics curve [Reference Wick9]. It is clear that almost all
 $\gamma $
angles from the root to the tip are intercepting on the unstable side of the curve, which resulting in negative torque. This torque slows down the Samara, as is needed in scenario (a) in Fig. 4 to maintain the equilibrium of the coupling motions. On the other hand, scenario (b) with positive
 $\phi $
, most of wing elements are operating beyond the stable point, further slowing down the wing, which makes it impossible for scenario (b) to sustain steady autorotation. Another benefit to the stability of Samara operating in at post-stall angles of attack is that the chord-wise centre of pressure shifts further aft (Fig. 7), causing more pitching-down moment about
 ${\widehat x^K}$
to stabilise the Samara.
The autorotation diagram of a flat plate section.

The chord-wise location shifts of the centre of pressure due to change in angles of attack. The figure is taken from Ref. [9].

3.2 Samara dynamics in transitions
To maintain the steady state, a Samara has to be supplied with torques on each axis. The configuration of Samara in this study has only one aerodynamic surface producing forces in three directions as seen in the principal coordinate. The lift and drag components from the wind coordinate are transformed into (1) the vertical force component perpendicular to the wing surface
 $\left(\vec F_V^K\right)$
, (2) the tangential force component parallel to the wing surface in the direction of the wing chord
 $(\vec F_T^K)$
, and (3) the side force component parallel to the wing surface in the direction of the wing span
 $\left(\vec F_S^K\right)$
.
 $\vec F_S^K$
is usually small due to a small coning angle (around
 ${5^ \circ }$
to
 ${30^ \circ })$
[Reference Azuma and Yasuda4]. It causes the CG trajectory of a Samara to shift, forming a circular track if observed in parallel with the descending direction. The side force is negligible in the transitions since it is only notable in larger coning angles, and it contributes small moments to the Samara.
 $\vec F_V^K$
is the main contributor at the early stage of the transition. The torques supplied by
 $\vec F_V^K$
are coupled on
 ${\widehat x^K}$
and
 ${\widehat y^K}$
(Fig. 8) due to the location of the centre of pressure with respect to the principal frame.
 $\vec F_V^K$
produces a torque about
 ${\widehat y^K}$
. Since
 ${\widehat y^K}$
is a intermediate axis, the supply of unstable energy on
 ${\widehat y^K}$
will be transferred to another stable rotation axis,
 ${\widehat z^K}$
[Reference Varshney, Chang and Wang3].
 $\vec F_T^K$
is the main contributor to
 ${\widehat z^K}$
, but it is also influenced by the angle-of-attack and the rotational speed of the wing. The torques on each axis interconnect with each other.
The top view of the wing planform. The vertical force in the principal frame
 $\left(\vec F_V^K\right)$
generated by the wing produces the torque
 ${\vec \tau _{xy}}$
in the principal coordinate.

During the early experiments on some natural Samaras, it was found that the stability of transition is also depending on the initial conditions (ICs) prior to release. Kellas discovered a “kick start” technique, releasing the artificial Samara with the wing tip pointing down to the ground, that can reduce the distance required to transit to autorotation [Reference Kellas2]. The aerodynamic forces acting against the Samara CG introduce a initial rotation in its direction of autorotation. However, the experiments conducted in this investigation using the “kick start” technique found that a Samara tends to flip about its chord-wise direction (roughly rotating about the
 ${\widehat x^B}$
, where
 ${\widehat y^K}$
is near by) instead of rotating about
 ${\widehat z^B}$
as portrayed in the original literature. It is suspected that the natural Samaras do not have the wing-tip vertical surface added on Kellas’ artificial Samaras. Since the wing planform surface has more area than the leading/trailing edge, the magnitude of aerodynamic forces is greater to rotate the Samara about its chord-wise direction. No matter the ICs of “kick start”, leading edge up, leading edge down or wing surface parallel to the ground, it was found during the experiments that a Samara has to undergo a span-wise rotation (roughly rotating about the body Y axis,
 ${\widehat y^B}$
, where
 ${\widehat x^K}$
is near by) before the azimuthal autorotation getting pronounced. The span-wise rotation not only produces aerodynamic thrust to accelerate along the azimuthal axis, but it also supplies the coupling torque to induce chord-wise rotation. If a Samara is dropped with wingtip up orientation, it is unlikely to autorotate even though the same Samara has good transition stability with other ICs. The wing acts like an arrow feather, damping out the disturbance about the span-wise and the chord-wise directions. Unless the Samara can incur enough span-wise rotation to produce a coupling torque to the unstable
 ${\widehat y^K}$
during the fall, the Samara falls stably to the ground like a lawn dart. This stable mode is called “dead falling” by the authors. If the span-wise rotation occurs during the fall, a dead falling Samara generally would take three to four times longer distance to autorotate. The importance of the ICs determines whether a Samara can continuously supply energy on the unstable
 ${\widehat y^K}$
. Since the span-wise direction
 $({\widehat x^K}$
is near by) has less MOI, it is easier to perturb around this direction and gain higher initial acceleration, to which implies another possible cause of failure to transition when the Samara develops a rotation around the stable
 ${\widehat x^K}$
while the angular acceleration around
 ${\widehat y^K}$
is damped out.
To analytically describe the torque caused by
 $\vec F_V^K$
, define an two-dimensional angle
 $\eta $
between
 ${\widehat x^K}$
to the vector,
 $\vec M$
, from the CG to the quarter station of the mean aerodynamic chord (MAC) (Fig. 8). If
 ${\widehat x^K}$
is leading ahead of the the quarter chord in its direction of autorotation,
 $\eta $
is positive. If
 ${\widehat x^K}$
is lagging behind,
 $\eta $
is negative. The quarter chord of the MAC represents a single point of force
 $\left(\vec F_V^K\right)$
corresponding to the pressure distribution over the entire wing. This assumption is based on the observation mentioned earlier that a Samara undergoes a span-wise rotation in its transition, and the azimuthal rotation is not pronounced.
The torque resulted from
 $\vec F_V^K$
can be expressed by Equation (10a). Simple trigonometry in Equations (10b) and (10c) show how
 $\eta $
distributes the
 $\vec \tau _{xy}^K$
to the X- and the Y-axes.
 \begin{align}\vec \tau _{xy}^K = \vec M \times \vec F_V^K\end{align}
 \begin{align}\vec \tau _x^K = \vec \tau _{xy}^K\sin \eta \end{align}
 \begin{align}\vec \tau _y^K = \vec \tau _{xy}^K\cos \eta \end{align}
Dividing Equations (10b) by (10c),
 $\tan \eta $
is a scaling factor of the torque ratio about the X- and Y-axes. If this factor is small, it implies larger torque along
 ${\widehat y^K}$
axis, and also more angular acceleration if compared under the same magnitude of MOI. If
 $tan\eta $
= 0, all initial accelerations are transferred to the
 ${\widehat y^K}$
. At this point we can see that
 $\vec F_T^K$
can be considered as a common factor to both X- and Y- axes. The
 $\vec \tau _z^K$
induced by
 $\vec M \times \vec F_T^K$
could introduce a disturbance to the angle-of-attack. The change in angle-of-attack will still be reflected in
 $\vec \tau _{xy}^K$
.
4.0 Stability criteria
4.1 Derivation of the inertial stability criterion
It has been deducted that the
 $\eta $
serves as an vital role to translate energy to the unstable
 ${\widehat y^K}$
axis and to initiate the autorotation (Fig. 8). The angular acceleration on the
 ${\widehat x^K}$
has to be sufficient to account for the coupling angular velocity, but not so much as to cause the Samara to rotate about it to enter another stable mode. The angular accelerations on the principal X- and Y-axes are considered an important parameter to determine the stability of Samaras’ transition.
Figure 9 shows the resultant force
 $\vec F_R^N$
in the inertial frame can be decomposed into the vertical component perpendicular to the wing surface and the tangential component.
 $\vec \tau _{xy}^K$
in Equation (10) can be rewritten as Equation (11) with the
 ${\widehat z^K}$
component.
 \begin{align}\vec \tau _x^K = \left(\vec F_R^N\cos \phi \times \vec M\right)\sin \eta \end{align}
 \begin{align}\vec \tau _y^K = \left(\vec F_R^N\cos \phi \times \vec M\right)\cos \eta \end{align}
 \begin{align}\vec \tau _z^K = \vec F_R^N\sin \phi \times \vec M\end{align}
Sectional view of the wing sliced perpendicular to
 ${\widehat x^K}$
passing through the quarter chord of MAC.

Take
 $\vec \tau _x^K$
dividing by
 $I_{xx}^K$
,
 $\vec \tau _y^K$
dividing by
 $I_{yy}^K$
, and
 $\vec \tau _z^K$
dividing by
 $I_{zz}^K$
to get the angular accelerations on three axes,
 $\dot{\vec{\omega}} _x^K$
,
 $\dot{\vec{\omega}} _y^K$
and
 $\dot{\vec{\omega}} _z^K$
, respectively. A non-dimensional method is proposed in Equation (12). The result of Equation (12) is called the inertial stability criterion (ISC).
 \begin{align}\dfrac{{\dfrac{{\dot{\vec{\omega}} _x^K}}{{\dot{\vec{\omega}} _z^K}}}}{{\dfrac{{\dot{\vec{\omega}} _y^K}}{{\dot{\vec{\omega}} _z^K}}}} = \dfrac{{\dfrac{{(\vec F_R^N\cos \phi \times \vec P)\sin \eta /I_{xx}^K}}{{\vec F_R^N\sin \phi \times \vec P/I_{zz}^K}}}}{{\dfrac{{(\vec F_R^N\cos \phi \times \vec P)\cos \eta /I_{yy}^K}}{{\vec F_R^N\sin \phi \times \vec P/I_{zz}^K}}}} = \dfrac{{\sin \eta }}{{\cos \eta }}\dfrac{{I_{yy}^K}}{{I_{xx}^K}} = \dfrac{{I_{yy}^K}}{{I_{xx}^K}}\tan \eta \end{align}
4.2 Validation of the inertial stability criterion
The
 $\frac{{I_{yy}^K}}{{I_{xx}^K}}$
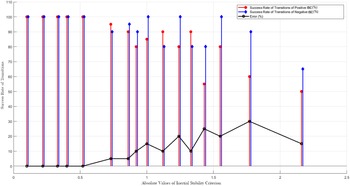
in Fig. 3a, 3b and 3c can be reorganised in the same fashion shown in Fig. 10 (Left). The ISC is calculated for each baseline case, and plotted against the experimental results as listed in Table 2. The plot (Fig. 10 (Middle)) shows a consistent correlation to 100% successful transitions if the value of criterion is between −0.5 and 0.5. As the value increases, the success rate of transitions deceases rapidly. A negative ISC implies that the principal axis with the minimum MOI
 $({\widehat x^K})$
is lagging behind
 $\vec M$
in the direction of autorotation. Interestingly, comparing the success rate of transitions in the same absolute values, Fig. 11 clearly shows that the negative values have, in general, higher success rate of transitions than the positive cases. This discrepancy gradually converges to zero as the values of the criterion decreases.
Correlations of experimental results to
 $\frac{{I_{yy}^K}}{{I_{xx}^K}}$
(left),
 $\frac{{I_{yy}^K}}{{I_{xx}^K}}\tan \eta $
(middle),
 $|\frac{{I_{yy}^K}}{{I_{xx}^K}}\tan \eta |$
(right).

The errors between the positive and the negative ISC. As the values of the criterion decrease, the difference converges to zero. It is also expected that as the values of the criterion increase from the far right data point, the errors drop to zero again since the rate of successful transitions will be zero for both positive and negative values.

The relatively higher success rate of transitions for the negative ISC is attributed to the initial
 $\vec \tau _z^K$
in the same direction as the autorotation direction (Fig. 4(b)). At the instant when the wing starts generating force in a relative linear flow condition at an early stage of transition, the force pitches up the wing, causing the angle-of-attack to increase. Recall the autorotation diagram in Fig. 5. The wing accelerates when the angle-of-attack is increasing from near zero. After passing the maximum point of acceleration at point (d) and flipping
 ${180^ \circ }$
about the
 ${\widehat y^K}$
, the wing has been accelerated about
 ${\widehat z^K}$
to reach the necessary angular velocity for the coupling motion, and now the
 ${\widehat x^K}$
is leading ahead of
 $\vec M$
in the direction of autorotation due to the back-shifting centre of pressure near the semi-chord (Fig. 7). Steady-state autorotation can now be shown as Fig. 4(a).
The physical foundation of the ISC is based on the ratio of angular acceleration about the X- and Y-axes. It is not surprise that low ISC implies more energy is transferred to the unstable
 ${\widehat y^K}$
to start the chain of reaction of the autorotation.
4.3 Impacts of bifurcations in directions of autorotation to Samara transition stability
This section elaborates the bifurcation discovered in Section 2.3 using the concept of ISC. Table 5 shows the clay masses on the P Axis was held at the station of 1.4cm. The model of Baseline 1 was modified that the CG of apparatus is moved to the
 $ + $
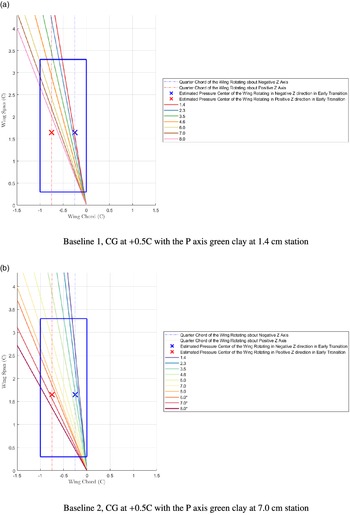
0.5 chord. As the station of clay masses on the R-axis were swept from 1.4 to 8.0cm, the direction of autorotation changes from the previous negative Z-axis to the positive Z-axis. Between the bifurcation, a failure case appears. This failure has the same feature mentioned in Section 2.3. The ISC of each mass configuration was calculated based on the positive and the negative rotating directions. The Samara rotating in two different directions has different locations of the quarter chord of MAC, which results in different
 $\eta $
. Table 5 reveals that the rotating direction of the smallest ISC value in each column is the same to experiment results in the first row, which is also as expected from conclusions in the dynamics of transitions and the physical basis of the ISC. Figure 12a visualises the directions of the first principal axis on the wing planform of the experiments conducted in Table 5. Another modified Baseline 2 model was also tested. The results are presented in Table 4 with the visualisation in Fig. 12b. The second set of experiments leads to the same conclusion that a Samara would autorotate in the direction with less ISC. Despite being a convenient way to determine the direction of autorotation, comparing two ISCs fails to reveal what mass configuration would lead to unsuccessful transitions. This paradox can be clearly found on the failure case in Table 4. Although it is not low enough
 $({-}0.77)$
to guarantee
 $100\% $
success rate of transitions, it should still be able to achieve some autorotations in tests.
Baseline 1, CG at
 $ + $
0.5 C, clay masses fixed at 1.4cm on the P Axis

‡ The Samara model autorotated in negative Z direction (clockwise looking from the top of the model)
† The Samara model failed to autorotate
§ The Samara model autorotated in positive Z direction (counter-clockwise looking from the top of the model)
Baseline 2, CG at
 $ + $
0.5 C, clay masses fixed at 7.0cm on the P Axis

* The clay mass on this station is added to 1g on each end of R Axis from the ballast.
The visualisation of the first principal axis directions with respect to the centre of pressure locations in the positive or negative Z axis autorotation. Each line represents a mass configuration shaped by the green clay on the R axis.

The failures are suspected due to the back-shifting centre of pressure when the autorotation established. If
 ${\widehat x^K}$
ends up lagging behind the shifted centre of pressure, the pitching up moment would cause the autorotation failed. Extending further on this idea, a Samara has two different locations of centre of pressure for rotating in either directions. The vector of
 ${\widehat x^K}$
locating in between the two shifted centre of pressures would cause the Samara unable to achieve steady-state autorotation in either ways. The statement implies that the
 $\eta $
in steady state must be positive to ensure successful initiation at the early stage of autorotation. Due to the short of necessary equipment to measure the location of centre of pressure in steady state, the exact range of this criterion is unknown.
Even though it can be confidently shown
 $100\% $
successful transitions if the ISC is between
 $ - 0.5$
to
 $0.5$
, the criterion for the shifted centre of pressure in steady states is obviously depends on the aerofoil and the planform of the wing. The negative ISC could lose transition stability if the location of shifted centre of pressure is unclear during the design. To be conservative, a stable range of ISCs is presented in Equation (13).
 \begin{align}0 \lt \frac{{I_{yy}^K}}{{I_{xx}^K}}\tan \eta \le 0.5\end{align}
Note the ISC cannot be applied on the wing-tip up IC since the physical basis of the ISC is not applicable in this flow field. The impact of exactly zero ISC is not yet clear, since the most confident minimum ISC that can be achieved is known to the third decimal place. However, the experiments show the smaller the ISC is, the faster it can pass the transition.
5.0 Conclusion
The investigation reveals the flight mechanic of a Samara in dynamic transitions and steady autorotations, which leads to the modeling of a quantitative measurement of the transition stability. The key determination of the stability in transitions is essentially the angular acceleration ratio about the principal X-axis
 $({\widehat x^K})$
to that around the principal Y-axis
 $({\widehat y^K})$
if the Samara has an X-Z plane of symmetry. The angular acceleration ratio is closely related to the eigenvalues and the eigenvectors of a Samara, which can be mathematically described as a non-dimensional inertial stability criterion (ISC). If we have the same torque on
 ${\widehat x^K}$
and
 ${\widehat y^K}$
 $(\tan \eta = 1)$
, large ISC then implies high angular acceleration about
 ${\widehat x^K}$
and the Samara would likely to develop a stable rotation about
 ${\widehat x^K}$
, thereby failing to autorotate before hitting the ground. To drive the Samara out of the stable rotation about
 ${\widehat x^K}$
(with the minimum MOI) as soon as possible, a Samara needs high angular acceleration about the intermediate axis,
 ${\widehat y^K}$
. Rotation about intermediate axis is inherently unstable, and the Samara will have to rotate about the next stable axis,
 ${\widehat z^K}$
to achieve steady autorotation.
 $\tan \eta $
can be treated as a scaling factor to distribute the torque ratio on
 ${\widehat x^K}$
and
 ${\widehat y^K}$
. The traditional approach to determine reliable autorotation by specifying the Samara CG along the chord-wise direction is insufficient. The bifurcation of the autorotation directions is consistent with the assertion that the relative positions of the quarter chord on the MAC to
 ${\widehat x^K}$
determine the Samara transition stability. The experiments of bifurcations also disclose that a negative ISC could mislead stability assessments. If
 ${\widehat x^K}$
happens to locate in between the aft-shifting centres of pressure that the Samara autorotates in either directions, the wing can only produce pitching-up moment and the Samara would lose the stability at the early stage of autorotation. The characteristics of an aerofoil and the wing planform are important to ensure the proper direction of torque to be supplied. The readers are reminded that the initial conditions of a Samara prior releasing should be properly chosen, to which the wing-tip up orientation shall be avoided to prevent the Samara from autorotating about the stable axis with minimum MOI.
The model of ISC can successfully predict the stability in transitions and the directions of autorotations. It is in hope that the discoveries from the investigation can facilitate designs of Samara-like decelerators in applications of planetary entry-descent-and-landing vehicles, packages and supplies deliveries and atmospheric probes. However, the theory and experiments are performed on a basis to imitate natural Samaras. Further comparisons to experiments on biological specimens are needed to ascertain the bio-mechanism of the natural counterparts. In the future, with the helps of high speed cameras and dedicated wind tunnel facilities to identify the locations of shifted centre of pressure would facilitate pinning the stable boundary of negative ISC.
Acknowledgements
Special thanks to Mr. John Irick, Founder of Five Forces SPC, for his inspiration and support to this research. E-mail: john@fiveforces.co.
Appendix
Principal moment of inertia matrix of Baseline 1, CG at 0 C, with 1g reserved ballast at the centre joint (Unit:
 $kg\ m^2$
)