Daily activity patterns reflect interactions between circadian mechanisms and environmental conditions such as temperature (Aronson et al. Reference ARONSON, BELL-PEDERSEN, BLOCK, BOS, DUNLAP, ESKIN, GARCEAU, GEUSZ, JOHNSON, KHALSA, HOFFEN, KOUMENIS, LEE, LESAUTER, LINDGREN, LIU, LOROS, MICHEL, MIRMIRAN, MOORE, RUBY, SILVER, TUREK, ZATZ and IRVING1993, Oliveira-Santos et al. Reference OLIVEIRA-SANTOS, MACHADO-FILHO, TORTATO and BRUSIUS2009). The latter can influence activity via their effects on the internal clock or more directly, a process sometimes referred to as masking (Rietveld et al. Reference RIETVELD, MINORS and WATERHOUSE1993). Although mammals can regulate their internal temperature, field studies have demonstrated that high external temperatures can decrease the activity level of both diurnal and nocturnal species (Langford Reference LANGFORD1983, Váczi et al. Reference VÁCZI, KOÓSZ and ALTBÄCKER2006). The activity patterns with two peaks is widespread in nature (Aschoff Reference ASCHOFF1966). For small mammals, the stimuli responsible for shaping these bimodal patterns during daytime are high air temperatures around noon and feeding physiology (Wauters Reference WAUTERS, Halle and Stenseth2001). Agoutis (Dasyprocta spp.) are mainly diurnal, with activity starting early in the morning, followed by a resting period around noon, and a second activity bout until sunset (Jorge & Peres Reference JORGE and PERES2005, Suselbeek et al. Reference SUSELBEEK, EMSENS, HIRSCH, KAYS, ROWCLIFFE, ZAMORA-GUTIERREZ and JANSEN2014). Agoutis can change their activity in response to predation risk, food availability and temperature variation (Lambert et al. Reference LAMBERT, KAYS, JANSEN, ALIAGA-ROSSEL and WIKELSKI2009, Suselbeek et al. Reference SUSELBEEK, EMSENS, HIRSCH, KAYS, ROWCLIFFE, ZAMORA-GUTIERREZ and JANSEN2014). Here, we characterize the activity pattern of the agouti Dasyprocta azarae (Litchtenstein, 1823) in the Brazilian Pantanal to evaluate if shifts in activity patterns and activity ranges are correlated with mean daily temperature. We hypothesize that the activity pattern of the agouti will be unimodal in days with lowest temperatures and progressively more bimodal as mean daily temperature becomes higher.
The study was carried out in the Brazilian Pantanal (18º59′S, 56º39′W) in 2008. A systematic grid was established covering approximately 5000 ha with 50 sampling sites, each one with a camera-trap (Tigrinus®). Cameras were placed 1.5–2.0 km apart from each other inside forested areas (figure of the study area in Cid et al. Reference CID, OLIVEIRA-SANTOS and MOURÃO2013). Each site was sampled for 30 d between March and May (rainy season) and for 30 d between August and October (dry season), in a total effort of 1500 trap-days in each season. The unbaited camera-traps were set to work simultaneously. We used 1-h intervals as an independence criterion among photographic records (hereafter ‘records’) obtained from the same sample site (Gómez et al. Reference GÓMEZ, WALLACE, AYALA and TEJADA2005). Daily temperatures and rainfall were obtained from a shaded automatic meteorological station located in the study area. The region has well-defined rainy (November–April) and dry (May–October) seasons. During the study year, total rainfall was 860 mm and mean temperature was 27°C, reaching 39.1°C, in the rainy season. In the dry season, total rainfall was 260 mm and mean temperature was 23°C, with a minimum of 8.5ºC.
To analyze agouti activity patterns we used a circular kernel function. We used the 95% isopleth to demonstrate full activity patterns (activity time of the population during the 24-h cycle) and the 50% isopleth to represent the activity cores (activity peaks of the population during the 24-h cycle; Oliveira-Santos et al. Reference OLIVEIRA-SANTOS, ZUCCO and AGOSTINELLI2013). We set the smoothing parameter to 5 to maintain consistency in activity characterization, as recommended by Oliveira-Santos et al. (Reference OLIVEIRA-SANTOS, ZUCCO and AGOSTINELLI2013). Next, we subdivided the entire set of records into smaller sets, in order to understand changes in agouti activity patterns. For that purpose, we used a bootstrapping technique to estimate the minimum number of records needed to characterize a reliable activity pattern and, hence, to define into how many smaller sets the entire set can be subdivided. We resampled the entire set in interval classes of 10 records. Then, we generated a full activity pattern for each of these interval classes 500 times. Finally, we estimated the mean overlap of the 500 patterns of each interval class with the global pattern (generated from the complete set of records). We considered the first interval class to achieve a mean overlap with the global pattern of 95% to represent the minimum number of records needed to characterize a reliable activity pattern.
To remove the influence of photoperiod variation, we transformed the raw data by standardizing sunrise at 6h00 and sunset at 18h00, thus correcting all records to fit in this ‘standard-day’. As daily temperature measures (mean, maximum and minimum) were highly correlated, we used mean daily temperature in the analysis. Because D. azarae is a diurnal species, we used the hours of the day illuminated by sunlight (6h00–18h00) to calculate the mean daily temperature of each day a record was taken. We sorted the records in ascending order of mean daily temperatures and divided the entire set into smaller subsets, respecting the minimum number of records required for estimating a reliable activity pattern. Thus, we created activity patterns of agoutis based on different segments of the entire set of records, covering different temperature ranges. For each one of these patterns we estimated the activity range and activity intervals for both the 95% and 50% isopleths. To evaluate the shifts in agouti activity patterns as a function of mean daily temperature, we estimated kernel density probabilities around noon (10h00–14h00) for each activity pattern. For the same purpose, we also estimated the overlap of the 95% and 50% isopleths for all patterns with the one associated with the lowest temperatures.
Despite the lack of a proper hypothesis relating agouti activity to daily rainfall, this variable can be a confounding factor in the analysis. Therefore, we investigated its effects on agouti activity patterns, performing the same procedures applied to mean daily temperature. We used R v.3.0.1 for all analysis (package circular).
When animals cannot be recognized individually, the camera-trap method does not allow the researcher to know the exact number of sampled individuals (Oliveira-Santos et al. Reference OLIVEIRA-SANTOS, ZUCCO, ANTUNES and CRAWSHAW2010). In this scenario, data obtained from the cameras are based on the population level. However, it is possible to know the minimum number of sampled agoutis in each season. During the study period, agouti occupancy estimation varied from 0.39 in the dry season to 0.83 in the rainy season (Cid et al. Reference CID, OLIVEIRA-SANTOS and MOURÃO2013). Therefore, considering independence among sampling sites, the minimum number of agoutis sampled was 19 and 41 individuals in dry and rainy seasons respectively.
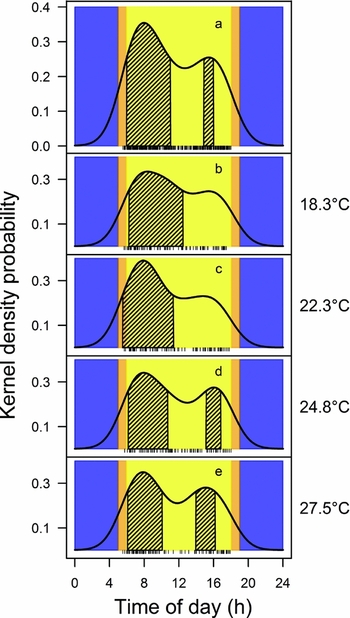
We recorded 400 independent records of agoutis (dry season = 248 records and rainy season = 152 records) during a sampling effort of 3000 trap-days in the Pantanal. Agoutis demonstrated a diurnal activity pattern (Figure 1a).
Activity patterns of the agouti (Dasyprocta azarae) in the Brazilian Pantanal as demonstrated by circular kernel density probability estimates, with the smoothing parameter set to five. Global activity pattern (400 records) (a). Activity pattern associated with the lowest temperatures (100 records) (b). Activity pattern associated with intermediate–low temperatures (100 records) (c). Activity pattern associated with intermediate–high temperatures (100 records) (d). Activity pattern associated with the highest temperatures (100 records) (e). The solid line represents the 100% isopleth and the shaded area under de curve represents the 50% isopleth (activity core). Blue rectangles represent the night period, orange rectangles represent twilight and the yellow area represents daytime. The dashes below the x axis represent raw data. The values in the right side of the graphics indicate the mean temperatures associated with each activity pattern.

The bootstrapping showed that a mean 95% overlap with the global activity pattern was achieved with 100 records. Thus, we split the total of 400 records in four sets of 100 records each. The full activity patterns of the four sets showed little overlap when compared with the colder set, suggesting no change in full activity pattern. However, the activity core of the four sets showed decreasing overlap with the core of the coldest activity pattern, showing activity core shift which was also confirmed by the reduction of kernel density probabilities around noon from the coldest to the hottest set. The core modification also allows the population to keep the activity range constant through the temperature gradient (Table 1; Figure 1b-e). There was no correlation between mean daily temperature and daily rainfall (Pearson's r = 0.014) and no relevant activity change due to daily rainfall variation (considering both full activity and activity core).
Characteristics of the activity patterns of agouti (Dasyprocta azarae) in different temperature interval classes in the Brazilian Pantanal. Activity pattern = activity patterns used in the analysis: Global = global agouti activity pattern (with all records); 1, 2, 3 and 4 = agouti activity patterns in different temperature interval classes. Number of records (r, d) = number of records used to estimate each activity pattern (number of records obtained from rainy and dry seasons). Mean temperature (°C) (range) = mean temperature during the light phase (minimum temperature and maximum temperature). Kernel density (10h00–14h00) = kernel density probability around noon from 10h00 to 14h00. Range (h) = activity range in hours. Activity intervals = time interval of each activity range. Overlap = overlap of each activity pattern with the activity pattern number 1 (associated with the lowest temperatures).

The bimodal diurnal activity pattern of D. azarae is similar to that reported for D. leporina in French Guiana (Dubost Reference DUBOST1988), D. punctata in Panama (Suselbeek et al. Reference SUSELBEEK, EMSENS, HIRSCH, KAYS, ROWCLIFFE, ZAMORA-GUTIERREZ and JANSEN2014) and D. variegata in the Bolivian Amazon (Gómez et al. Reference GÓMEZ, WALLACE, AYALA and TEJADA2005). Lambert et al. (Reference LAMBERT, KAYS, JANSEN, ALIAGA-ROSSEL and WIKELSKI2009) found nocturnal activity for D. punctata, and attributed this night activity to caching seeds and avoiding extremely high temperatures during the day. In this study, the agouti population was consistently inactive throughout the night, regardless of the mean daily temperature. However, during the day, the agouti population activity core changed across the temperature gradient, suggesting that the agoutis used a behavioural strategy to reduce exposure to heat during the extreme high temperatures around noon in the hottest days. Other rodents have the same thermoregulatory strategy, altering their activity peaks as a function of temperature variation, within the same season or between seasons (Bacigalupe et al. Reference BACIGALUPE, REZENDE, KENAGY and BOZINOVIC2003, Kenagy et al. Reference KENAGY, NESPOLO, VÁSQUEZ and BOZINOVIC2002, Váczi et al. Reference VÁCZI, KOÓSZ and ALTBÄCKER2006). On the coldest days, the agouti population demonstrated one activity core, shifting to two separated activity cores on the hottest days. On these days, agoutis compensated the morning activity reduction around noon with another activity bout in the afternoon, thus keeping the activity range constant. Similar behaviour has also been observed in other rodent species occupying different habitats (Hinze & Pillay Reference HINZE and PILLAY2006, Ilan & Yom-Tov Reference ILAN and YOM-TOV1990, Rezende et al. Reference REZENDE, CORTÉS, BACIGALUPE, NESPOLO and BOZINOVIC2003).
We found dependence between temperature and season, with higher temperatures in the rainy season and lower in the dry season. So, the observed change in the agouti population activity core could be influenced by other factors that vary seasonally, as food availability. However, the lack of activity shift as a function of daily rainfall suggests that this variable cannot explain the patterns observed. In the study site, agouti landscape occupancy is lower and linked to palm (Attalea phalerata Mart. ex Spreng.) stands in the dry season and higher in the rain season, when agoutis occupy a larger proportion of the habitat (Cid et al. Reference CID, OLIVEIRA-SANTOS and MOURÃO2013). However, in spite of changes in habitat use, agouti activity range remains constant between seasons. Another factor that can influence agouti activity is predation risk by cats (Suselbeek et al. Reference SUSELBEEK, EMSENS, HIRSCH, KAYS, ROWCLIFFE, ZAMORA-GUTIERREZ and JANSEN2014). In Panama, agoutis living in areas with greater food availability avoided the twilight hours where predation by ocelot Leopardus pardalis (Linnaeus, 1758) is higher. In this study, there is little reason to believe that predation risk varies between seasons.
The results we present may reflect a trade-off between activity time and thermoregulation during the diurnal period. Agoutis seem to explore the habitat more continuously when the temperature eases and to stop around noon when temperature is too high. Nevertheless, these animals always keep their activity range constant, ensuring the same amount of time to perform their regular activities (e.g. food intake, search for mates, find shelters), regardless of temperature. We conclude that temperature is an important external environmental determinant of agouti daily activity behaviour.
ACKNOWLEDGEMENTS
We acknowledge the Brazilian Agricultural Research Corporation (Embrapa-Pantanal) for financial and logistic support at Nhumirim ranch, and the owners of Ipanema, Chatelodo, Don Valdir and Porto Alegre ranches for allowing the study inside their properties. We also thank Carlos André Zucco for useful contribution in data analysis and text writing and Bernardo Araújo, Clarissa Pimenta and Nina Attias for revising the English version.