Quartz veins are a universal feature of regional metamorphic terrains: they range from minor veins crystallised from locally-sourced fluid during a single event, to the giant, km-scale quartz veins that consist of many individual veins, and formed from fluids of uncertain provenance.
It is generally considered that minor quartz veins in metamorphic rocks form by the segregation, dissolution and deposition of quartz in local, m-scale, largely closed systems. In the systems there is a balance, for example, between quartz being removed by pressure solution from grain–grain contacts in the host rock, and that being deposited, via the pore fluid, in quartz veins growing nearby. The possible involvement of regional-scale circulation of metamorphic fluids is not entirely excluded (Yardley & Bottrell Reference Yardley and Bottrell1992; Yardley Reference Yardley2009), whereas open-system behaviour is commonly invoked in the case of large to giant-sized veins.
The most common types of minor quartz vein are crack-seal and crack-fill (vuggy) veins. In crack-seal veins, the quartz fibres grow in synchrony with the opening of the vein, and the resulting wall-to-wall, optically continuous, quartz fibres track the incremental opening direction (Ramsay Reference Ramsay1980). These fibres are commonly oblique to the margin of the crack-seal vein, whereas in crack-fill veins, prismatic quartz crystals grow orthogonal to the vein wall, and do not preserve a record of the opening direction. In the latter case, the rate of opening of the original fluid-filled crack outpaces the growth of crystals nucleated on its walls, leading in some cases to the development of vugs in which the quartz prisms grow radially towards the centre of the void and develop rhombohedral terminations. These contrasting scenarios illustrate the differences between veins formed in response to brittle/ductile deformation at depth in the Earth's crust, and those resulting from brittle deformation in the upper part of the crust, respectively.
Large, m-scale quartz veins have been extensively studied because they commonly host gold mineralisation, in the form of lode-gold deposits. The quartz in these bodies ranges widely in texture from coarsely crystalline to crack-seal and crack-fill types (the displacement- and face-controlled categories of Cox & Etheridge (Reference Cox and Etheridge1983)). Attempts to classify these vein infillings, and identify those textures that are most commonly associated with economic gold mineralisation, have met with some success (Dowling & Morrison Reference Dowling and Morrison1988; Vearncombe Reference Vearncombe1993). It appears that the different types of lode-gold deposit form a continuous series, with the nature of the quartz fabric being indicative of depth of formation (Groves et al. Reference Groves, Goldfarb, Robert and Hart2003).
Giant quartz veins, which are tens of metres thick and several km long, are rare and generally poorly documented. They pose a problem because to form such large bodies, an enormous volume of Si-rich fluid has to pass through a narrow fracture in the crust. As an example, it was estimated that 8×10¹² kg of fluid were required to form the Hollinger–McIntyre deposits in Ontario, Canada (Colvine et al. Reference Colvine, Fyon, Heather, Marmont, Smith and Troop1988). If the origin of such bodies is to be understood, a source of fluid needs to be identified, as well as a mechanism for creating the space necessary to accommodate them.
Bons (Reference Bons2001) addressed these problems and proposed, following Weertman (Reference Weertman1971) and Secor & Pollard (Reference Secor and Pollard1975), that Si-bearing fluids were introduced into the rock mass as ‘large fluid-filled fractures’, termed mobile hydrofractures. These were thought to move rapidly through the rock mass and only form crystalline deposits when a physical obstacle halted their progress towards the surface. Bons (Reference Bons2001) envisaged that successive episodes of this type could create giant quartz veins. As an example, he described a 50 m-thick vein from the Adelaidean sequence of New South Wales that consisted entirely of white quartz with very rare wallrock inclusions and intermittent cm-scale laminations, which would have required ‘millions’ of such events for its formation.
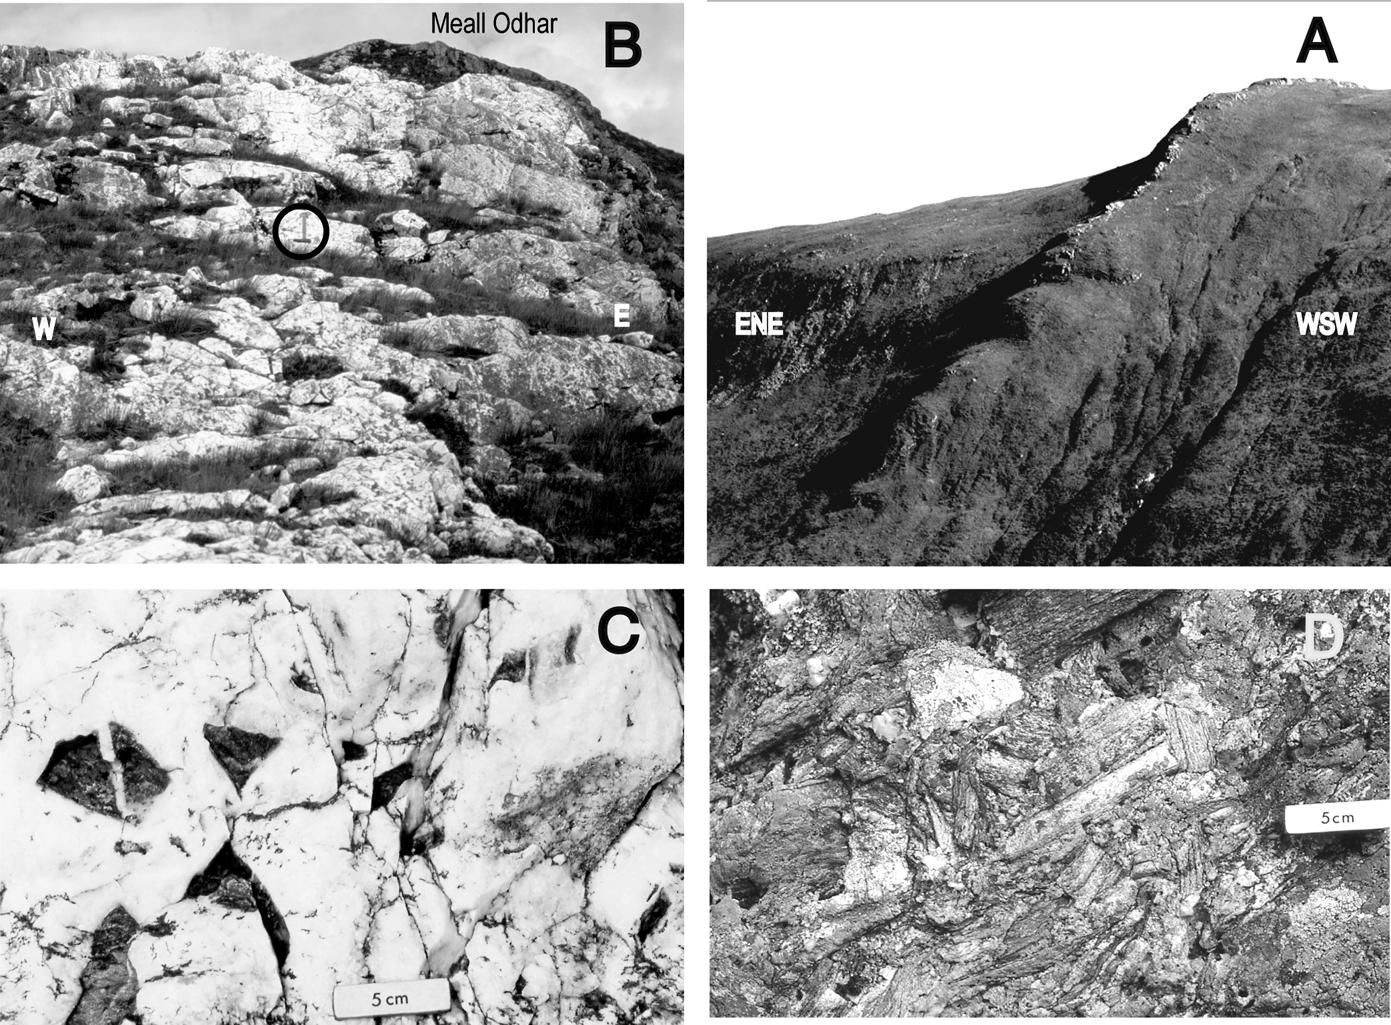
Some of the giant veins in the Tyndrum–Dalmallly area contain economic Au–Ag deposits (i.e. at Cononish), but they are accompanied by numerous m–km-scale dyke-like bodies of largely barren quartz and quartz breccia, such as the Mother Vein (Fig. 1A and B). Treagus et al. (Reference Treagus, Pattrick and Curtis1999) considered that both the mineralised vein at Cononish and the non-mineralised Mother Vein originated within shear zones as ‘hydrothermal breccias’, and were later affected by simple shear. However, this interpretation is disputed in the present paper, as both of these major veins contain a population of well-separated, angular fragments of the local country rocks which, although the breccia bodies occupy a fault plane, have not been affected by shearing. The angular shapes of the clasts and the preservation of cusps on some of the fragments (Fig. 1C), together with the lack of shear fabrics, preclude a tectonic, attritional origin for the breccia. A characteristic feature of this type of breccia, which holds the clue to the origin of the giant veins in the Tyndrum–Dalmally area, is the development of a ‘jigsaw’ texture, with the clasts seemingly ‘floating’ in the quartz matrix (Fig. 1C); this and other vein textures are described and interpreted in section 4.
(A) The Mother Vein S of Lochan na Bi viewed to the SSE. The vein is 0–8 m thick. (B) The Mother Vein on Meall Odhar viewed to the NE, showing a quartz-rich core flanked by damage zones injected by open-space quartz veins. The hammer shaft (ringed) is 47 cm long. (C) The Mother Vein S of Meall Odhar, showing the angular nature of the country rock fragments, which are separated by massive-looking quartz. (D) A collapse texture of randomly orientated slabs and blocks of semi-pelite and psammite, seen on a vertical face, in an explosion breccia pipe SE of Glen Orchy Farm [NN 2666 3383]. See Figure 4 for locations.

This study of the Tyndrum–Dalmally area began in 1990 as a part-time project and work was completed in 2003. Field mapping was at 1:6000 on enlarged aerial photographs, aided latterly by the use of a GPS receiver for location.
The aims of this paper are to:
1. Determine the regional structural control responsible for the development of numerous intersecting, km-scale, dyke-like, quartz-breccia veins in the Tyndrum–Dalmally area, which are unique in the British Isles.
2. Identify the mechanism(s) responsible for formation of the individual quartz-breccia veins.
3. Integrate these findings into a model that, together with published radiometric, geochemical, isotopic and fluid inclusion data, enables deductions to be made on the sources of the fluids responsible for the formation of the quartz-breccia veins; the conditions under which they were emplaced; and their age.
The comparison with other Au–Ag deposits in the Dalradian Supergroup, and farther afield, is discussed elsewhere.
1. Geological setting
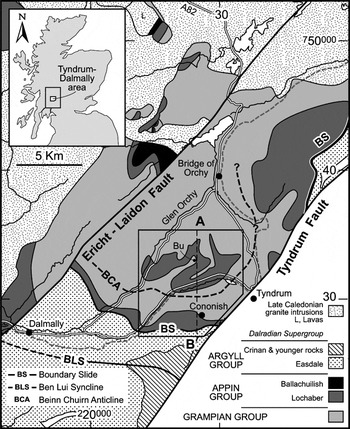
The study area is located W of Tyndrum, Perthshire, in the Grampian Highlands of Scotland (see box, Fig. 2). Three glacially sculpted valleys, Glen Orchy, Glen Lochy and Cononish Glen, dissect this mountainous tract, with the highest peaks being Beinn Chuirn (880 m) and Beinn Udlaidh (840 m) (Figs 3 and 4). A thick cover of glacial till and moraine obscures bedrock in the valley bottoms and on the lower slopes, and in many places access is made difficult by mature pine forest.
Simplified geological map showing the location of the study area (boxed), and the line of cross-section A–B (Fig. 3).

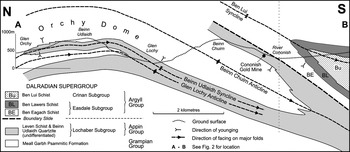
Simplified true-scale N–S geological cross-section across the study area (see Fig. 2 for location) (after Tanner & Thomas Reference Tanner and Thomas2010, fig. 14). This figure shows the location of the Cononish gold mine on the right-way-up (south) limb of the Beinn Chuirn Anticline, and the relationship of this fold to the Orchy Dome.

Geological setting of the Cononish gold mine, showing the axial trace of the D2 Beinn Chuirn Anticline (in black). For clarity, the traces of the other major D2 folds are omitted (see Tanner & Thomas Reference Tanner and Thomas2010, fig. 5, for these). A–E are referred to in the text.

The network of major quartz veins described here occurs in rocks belonging to the Dalradian Supergroup that had already undergone polyphase deformation (D1–D4) during the ∼470 Ma Grampian Orogeny (Oliver Reference Oliver2001; Baxter et al. Reference Baxter, Ague and Depaolo2002). All of the Dalradian rocks in the study area have been regionally metamorphosed to garnet grade (lower amphibolite facies), and most of them have been affected by widespread retrogression, resulting in the alteration of biotite and garnet to chlorite.
The Dalradian succession ranges in age from Neoproterozoic to Early Ordovician (Tanner & Sutherland Reference Tanner and Sutherland2007), and is divided, from the base upwards, into the Grampian, Appin, Argyll, Southern Highland and Trossachs groups. The rocks in the Tyndrum–Dalmally area span the conformable boundary between the Grampian and Appin groups, with the Appin Group rocks being separated from those of the overlying Argyll Group by the Iltay Boundary Slide (Bailey Reference Bailey1922; Roberts & Treagus Reference Roberts and Treagus1975) (Figs 2, 3). The latter was considered to be a major structural break, but is now recognised as a regional stratigraphical disconformity (see Tanner & Thomas Reference Tanner and Thomas2010), and referred to as the ‘Boundary Slide’. The Dalradian sequence that lies beneath it comprises three formations: the Meall Garbh Psammitic Formation (Grampian Group); the Beinn Udlaidh Quartzite Formation; and the Coire Daimh Pelite Formation (Leven Schist). The two latter units belong to the Lochaber Subgroup (Appin Group) (Fig. 4).
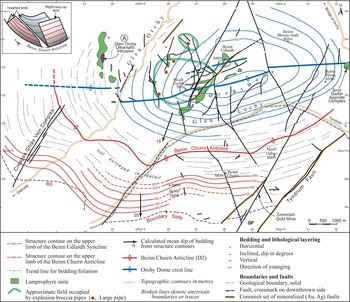
Bailey & Macgregor (Reference Bailey and Macgregor1912) established the tripartite stratigraphical sequence and recognised that the overall structure consists of two major isoclinal folds, now referred to as the Beinn Chuirn Anticline and Glen Orchy Syncline (now Beinn Udlaidh Syncline (Tanner & Thomas Reference Tanner and Thomas2010)), folded over a late antiformal structure. Thomas & Treagus (Reference Thomas and Treagus1968) deduced the presence of a further major isocline, the Glen Lochy Anticline (Fig. 3). Recent work has clarified the tectonic interpretation, and the structure is now seen as a stack of three major, SE-facing isoclines of D2 age folded by a large-scale E–W-trending periclinal structure termed the Orchy Dome (Fig. 3) (Tanner & Thomas Reference Tanner and Thomas2010).
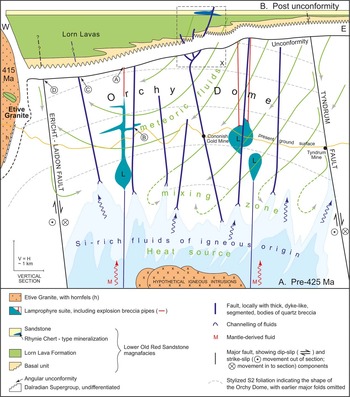
Originally named the ‘Orchy Anticline’ by Bailey & Macgregor (Reference Bailey and Macgregor1912), the true shape of the dome was only revealed recently by structure contours drawn on the quartzite–pelite boundary (shown in blue on Figure 5), on the upper limb of the isoclinal Beinn Udlaidh Syncline (Tanner & Thomas Reference Tanner and Thomas2010). It is slightly elongated, with an average trend of 087°, a southerly limb dipping at 15°, and periclinal closures to the east and west that plunge around 10–15° to the E & W, respectively. A further set of structure contours (in red, Fig. 5; see inset) has been drawn on the same interface on the top limb of the synformal Beinn Chuirn Anticline, that shows that this limb dips at around 25°S. In order to link these two sets of contours, trend lines for bedding/foliation have been drawn (pecked lines, Fig. 5). This combination of structure contours and trend lines reveals the regional scale of the Dome.
Simplified geological map of the Tyndrum–Dalmally area and its extension westwards. The shape of the Orchy Dome is outlined by structure contours drawn on the boundary between the Beinn Udlaidh Quartzite and the Coire Daimh Pelite: those on the lower limb of the Beinn Chuirn Anticline are shown in blue, and on the upper limb in red. The bold black arrows are accompanied by calculated dip values. The inset 3-D sketch shows the relationship between the two sets of structure contours on the limbs of the curvilinear Beinn Chuirn Anticline. For A, see text.

Numerous sills, dykes and irregular bodies of the lamprophyre–appinite suite, mainly vogesite, were emplaced into the Dalradian rocks following D4.
The lamprophyres were accompanied by explosion breccia pipes, which are roughly circular in cross-section and range up to 120 m in diameter. They are filled with well-cemented fragments of Dalradian country rock, with collapse textures (Fig. 1D), and at several localities early pipes are cut by the lamprophyric intrusions. As noted by Tanner & Thomas (Reference Tanner and Thomas2010), the main bodies of lamprophyre are clustered around Meall Garbh and lie astride, but slightly offset from, the axial trace of the Orchy Dome, suggesting that their intrusion was spatially influenced by this structure (Fig. 5). Most of the pipes occur in the two areas outlined by pale green shading on Figure 5.
The lamprophyre suite was followed by the intrusion of microdiorite dykes (s.l.) and Late Carboniferous quartz-dolerites (Fig. 4). The Tyndrum–Dalmally area is bound to the SE by the Tyndrum Fault, a major strike-slip fault with a left–lateral displacement of ∼4 km, and a vertical downthrow to the SE of some 2 km (Treagus Reference Treagus1991). Similarly, the Ericht–Laidon Fault (Fig. 2), which marks the NW limit of this crustal compartment, has estimated left-lateral displacement of 5·5 km and a downthrow of 0·2 km SE (Treagus Reference Treagus1991). The geometry and tectonic significance of the major transcurrent faults in the surrounding area was discussed by Jacques & Reavy (Reference Jacques and Reavy1994), Treagus et al. (Reference Treagus, Pattrick and Curtis1999) and Dewey & Strachan (Reference Dewey and Strachan2003).
1.1. Mineralisation
Lead mining had been carried out in the Tydrum district since 1741, mainly at Eas Anie and at Tyndrum Mine itself, but work ceased in 1925. Gold was discovered in-situ in a quartz vein at Cononish in 1984 and, as a result, Ennex International constructed an exploration adit there in 1986. The Cononish mine, which lies on the upper limb of the Beinn Chuirn Anticline (Fig. 4), is set to become Scotland's first commercial gold mine, with a total metal inventory of 163000 oz Au and 596000 oz Ag, at a Au cut-off grade of 3·5 g/t (Scotgold 2010). Details of the history of mining and exploration at Cononish are given by Earls et al. (Reference Earls, Parker, Clifford, Meldrum, Bowden, Earls, O'Connor and Pyne1992) and Dominy et al. (Reference Dominy, Platten, Xie, Sangster and Dominy2009).
The quartz veins in the Tyndrum–Dalmally area contain either precious- or base-metal mineralisation, or are barren. Gold occurs in the Cononish Vein both as electrum (Aux Ag100-x), intergrown with pyrite or galena, and, to a lesser extent, as native gold in grains <0·2 mm across. It is always accompanied by silver, either as tellurides or as native silver (Parker et al. Reference Parker, Clifford and Meldrum1989; Earls et al. Reference Earls, Parker, Clifford, Meldrum, Bowden, Earls, O'Connor and Pyne1992; Treagus et al. Reference Treagus, Pattrick and Curtis1999), and in places by galena. Pyrite is the main sulphide mineral, with galena, sphalerite and chalcopyrite as minor constituents of the ore. Regarding mineral exploration, pyrite is the pathfinder for gold mineralisation, especially where it is finely disseminated in quartz, and accompanied by pink to reddish-coloured metasomatic alteration of the country rock at the vein margin, that is probably due to the introduction of K-feldspar. The only evident structural control for the Au–Ag mineralisation is that it occurs along 042°- and 326°-trending major faults of the Cononish and River Vein sets (see Section 6). The former are slightly curved to sigmoidal along strike, possibly giving rise to local releasing bends where mineralisation might be concentrated, in contrast to the generally non-mineralised Barren and Mother Vein sets, which consist essentially of planar veins. The following sequence of mineralisation episodes has been recognised:
1. Gold–silver mineralisation in major quartz veins, and in adjacent metasomatic haloes. Referred to here as the Au–Ag mineralisation (the ‘A-min’ at Cononish of Earls et al. (Reference Earls, Parker, Clifford, Meldrum, Bowden, Earls, O'Connor and Pyne1992)).
2. Base-metal, Pb–Zn mineralisation (B-min) generally spatially associated with the Au–Ag-bearing veins (for example, the Lower Adit Vein at Cononish) but also forming a major orebody in the Tyndrum Fault zone at Tyndrum Mine. The locations of small Pb workings are shown on Figure 6.
3. Emplacement of the so-called ‘barren’ veins, some of which, such as the Mother Vein, have been found subsequently to be weakly mineralised (Au and Ag).
4. Emplacement of a rare set of veins at Tyndrum containing a variety of uranium- and tellurium-bearing minerals (Pattrick Reference Pattrick1985).
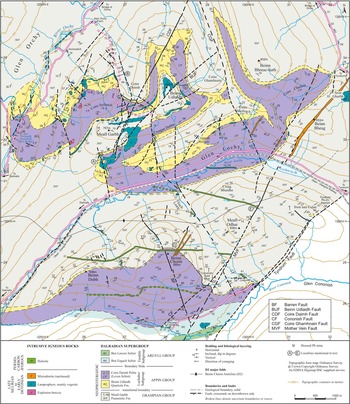
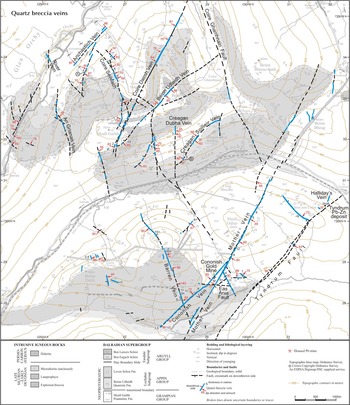
Geological map showing the spatial distribution, orientations and thicknesses of bodies of quartz breccia and massive quartz (both shown in blue) in the Tyndrum–Dalmally area. For A and B, see text.

In an endeavour to find further gold reserves, Scotgold have recently investigated a number of explosion breccia pipes in the area (Scotgold 2010). One 12 m core yielded 1·45 g/t Au and 8·9 g/t Ag, and a further six pipes yielded 1–2 g/t Au over 3–14 m. However, the related, and more widely distributed, sills, dykes and bosses of lamprophyre gave low Au values of <1 g/t.
2. The quartz-breccia veins
The veins range in thickness from a few cm to >20 m, exceptionally 50 m, and in length from decimetres, to >3 km. Most of the major veins form wall-like features in the landscape (Fig. 1A), and the larger ones can be seen from several km away. In this paper, the term ‘quartz breccia’ is used in a descriptive, non-genetic sense to describe veins that consist of massive grey or white quartz with abundant, angular fragments of the local country rock, generally up to 10 cm across (Fig. 1C). These quartz-breccia veins are invariably located along fault planes, show little evidence of having been affected internally by subsequent fault movement, and take their name from the parent fault. All known veins >1 m thick are shown on Figure 6. A consistent feature of the large quartz veins in the Tyndrum–Dalmally area is that they are discontinuous, and consist of a number of discrete, almost perfectly aligned (‘in-line’) segments.
Early workers (Kynaston & Hill Reference Kynaston and Hill1908; Bailey & Macgregor Reference Bailey and Macgregor1912; Thomas & Treagus Reference Thomas and Treagus1968; Roberts & Treagus Reference Roberts and Treagus1975) made no reference to these veins. The Creagan Ghlas vein complex is the sole exception: it was shown as a ‘Quartz Vein’ on the 1897 edition of the BGS Sheet 45 (Oban) but reduced to the status of a fault on the subsequent edition (Dalmally Sheet 45E, published 1992).
Although some of the faults give rise to marked topographic features, the amount of displacement on them is small, typically less than a few tens of metres (Tanner & Thomas Reference Tanner and Thomas2010, fig. 7). They appear to be normal faults, but as they have a steeper dip than is the norm for this type of fault, some may be oblique-slip faults. Fault breccia and gouge are associated with these faults, but cataclasite and mylonite are absent.
Several major faults clearly cut and displace members of the lamprophyre suite, for example at locality A (Fig. 4), and 0·6 km to the west of it. In addition, the quartz breccia veins cut lamprophyre bodies at a number of places including B (Fig. 4), and also locally contain angular fragments of lamprophyre as at A and B on Figure 6. However, the outcrop patterns of the lamprophyres suggest that, in some cases (e.g. Fig. 4B and C), they may have been intruded along pre-existing fault planes (Tanner & Thomas Reference Tanner and Thomas2010). If this is correct (the rock exposure is not good enough to be absolutely certain of this), the above relationships, when taken together, suggest that faulting and lamprophyre emplacement were broadly contemporaneous. In this scenario, the earliest lamprophyre intrusions were emplaced into barren fault planes, brecciated during fault reactivation and, together with the existing fault breccia, were repeatedly injected by pulses of silica-rich fluid to form quartz breccia.
The NNE- trending faults are intruded by microdiorite (s.l.) dykes, for example, at D (Fig. 4). Quartz-dolerite dykes either cross the faults without deflection, or terminate against them, as at E (Fig. 4).
Contacts between the veins and the country rock are either planar and sharply-defined, possibly due to later fault movements along the contact, or are gradational on a metre scale (Fig. 1B), with ‘ghost bedding’ being preserved within the vein along one or both margins. In places, there is a transition zone up to a few metres wide, with abundant centrimetre-scale quartz veins marking the vein/country rock contact.
At many localities, bedding and foliation in the country rock have a similar orientation on both sides of the vein, but localised brittle folding or brecciation of the country rock can also be present at either contact. In several cases, such as in the Beinn Udlaidh and Mother veins, the main quartz breccia is flanked by a narrow, deeply-weathered, sulphide-rich band, with field relationships showing that the sulphide-rich mineralisation predated formation of the barren quartz vein (D. Catterall, pers comm. 2011), indicating an extended event history for these faults/fractures/veins.
2.1. Field relationships of individual quartz-breccia veins
2.1.1. Cononish Vein
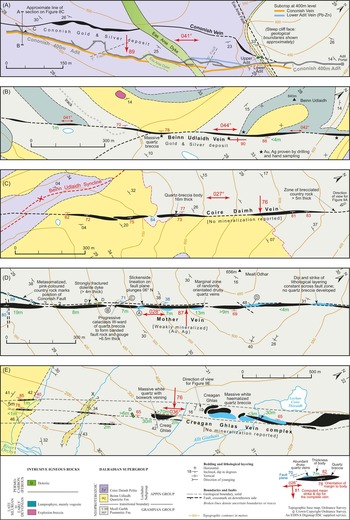
The Cononish Vein (Scotgold 2007), previously named the Eas Anie Vein, or Eas Anie structure (Earls et al. Reference Earls, Parker, Clifford, Meldrum, Bowden, Earls, O'Connor and Pyne1992) hosts the Cononish Au–Ag mineral deposit (Fig. 7A). It lies along the Cononish Fault in Cononish Glen 1 km SE of the summit of Beinn Chuirn (Fig. 6) but unlike most of the other major veins, it lacks topographic expression. This is clearly seen in Figure 8A, which shows the geographical and geological setting of the Cononish gold mine. The Vein is cut by the 15 m-thick Eas Anie quartz-dolerite dyke, and affected by several minor faults, none of which has a displacement >9 m (Dominy et al. Reference Dominy, Platten, Xie, Sangster and Dominy2009).
A series of geological maps (A–E) showing the spatial distribution of selected major quartz-breccia veins, and their relationship to the local stratigraphy and structure of the Dalradian rocks. Note that although true N is the same for all of the maps, it is not in its normal orientation; also, the maps are at different scales. A–D on map D are referred to in the text.

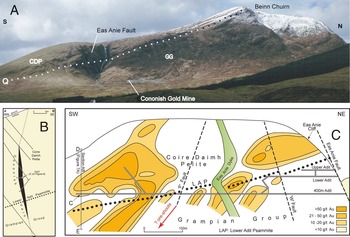
Geological setting of the Cononish gold mine with transverse (A) and longitudinal (B) sections through the Cononish mineral deposit: (A) location of the mine on the flank of Beinn Chuirn viewed looking NE. The dotted line (Q) shows the approximate location of the outcrop of the Beinn Udlaidh Quartzite, separating the stratigraphically-older Grampian Group (GG) below, from the Coire Daimh Pelite (CDP), above; (B) vertical cross-section A–B (see location on Fig. 7A), showing the lensoid shape of the Cononish Vein (after Earls et al. Reference Earls, Parker, Clifford, Meldrum, Bowden, Earls, O'Connor and Pyne1992). It cuts the longitudinal section shown on (C), along D–C–E; (C) contoured Au-values (g/t=gram per m) drawn on the surface of the Cononish Vein, showing the existing adits, raises, and faults. The dotted line (LAP) marks the inferred position of the Lower Adit Psammite (Beinn Udlaidh Quartzite), and corresponds to that shown in (A) (after Earls et al. Reference Earls, Parker, Clifford, Meldrum, Bowden, Earls, O'Connor and Pyne1992).

The Vein is very poorly exposed, and surface outcrop was only obtained in 1984 when Ennex International excavated trenches normal to strike at intervals of 10–20 m. The trenches were back-filled and the Vein is now only exposed in a few places. Almost all of the information on the Cononish Vein comes from diamond drilling, and from continuous exposure in a 1·2 km-long exploration adit driven SW from the gold mine portal at [29122 28575]. This adit is at 400 m OD and runs parallel to, or within, the Vein (Fig. 7A). The following account of the Cononish Vein is based largely on published information, as the mine has been held on a care-and-maintenance basis since 1995; for safety reasons, access to the adit was not permitted during the present study.
The Cononish Vein cuts the right-way-up limb of the Beinn Chuirn Anticline that, in the area around the adit, has a mean orientation of strike 089°, dip 29°S (N=26) giving a line of intersection with the Cononish Vein of 22° to 223°. This line is seen as the subcrop of the Lower Adit Psammite on the surface of the Vein on Figure 8, where it has a pitch of 17°SW.
The host rocks at the adit portal are psammites and semipelites of the Grampian Group (Meall Garbh Formation; Tanner & Thomas Reference Tanner and Thomas2010), and the adit passes SW through a thin band of the Lower Adit Psammite (Beinn Udlaidh Quartzite), into a banded garnet-bearing pelitic unit, the Coire Daimh Pelite (the local equivalent of the Leven Schist) (Fig. 7A). The apparent vertical displacement across the Cononish Vein is <5 m (Parker et al. Reference Parker, Clifford and Meldrum1989).
The Cononish Vein has a mean trend, measured over >1 km, of 041°, and a calculated dip in the central portion of 89°SE. In detail, the dip in the adit varies from 70°SE, through the vertical, to 70°NW as it is traced from the portal area SW to the end of the adit (Earls et al. Reference Earls, Parker, Clifford, Meldrum, Bowden, Earls, O'Connor and Pyne1992). The Vein has a slightly sinuous outcrop (Fig. 7A), varies markedly in thickness along strike from a few cm to 6 m, but is generally <4 m thick. The longest continuous section of the Vein is 90 m long and the longest break in continuity is 4–10 m (Dominy et al. Reference Dominy, Platten, Xie, Sangster and Dominy2009). Similar variations in thickness are also shown in the only published vertical cross-section through the deposit (Fig. 8B), based on the results of early diamond drilling, which when combined with the outcrop pattern, suggests that the body comprises several, large, oblate or pancake-shaped segments.
Gold values plotted in the plane of the vein show a nodal distribution (Fig. 8C). The linear elements of this pattern plunge steeply SW, and are interpreted as ore-shoots (Dominy et al. Reference Dominy, Platten, Xie, Sangster and Dominy2009). This pattern is linked to the variations in vein thickness noted above, the higher Au values coinciding with the thickest part of the Cononish Vein. However, this is not necessarily a straightforward relationship, because the Vein consists essentially of two main components: a massive quartz breccia, which acts as a marker and is only relatively weakly mineralized, and the ore zone, which varies in thickness from 20 cm to 100 cm. Thus the zonal variation in Au values (Fig. 8C) could be related to variations in thickness of the ore zone, and be independent of the 3-D shape of the quartz breccia. A similar anomaly pattern at a comparable scale, but in this case for Ag, was reported by Paez et al. (Reference Paez, Ruiz, Guido, Jovic and Schalamuk2011) from a longitudinal section of the Martha epithermal silver mine in Argentina. From detailed underground mapping, they correlated this pattern of second-order, steeply-plunging ore-shoots, with the presence of dilatational jogs and step-overs. A similar interpretation may hold for Cononish gold mine.
The Vein varies considerably in character along strike, from a few weakly mineralised quartz veins contained within a 5 m-wide bleached-looking zone in the portal area, to a massive quartz breccia 6 m thick at its maximum development some 400 m SW along the adit (Earls et al. Reference Earls, Parker, Clifford, Meldrum, Bowden, Earls, O'Connor and Pyne1992). After the first 400 m, where it crosses Grampian Group rocks, there is a 500 m-long section in which the Vein is thicker and shows higher gold values. This section, shown by diamond drilling to extend for at least 500 m vertically, comprises the Cononish Au–Ag deposit (Earls et al. Reference Earls, Parker, Clifford, Meldrum, Bowden, Earls, O'Connor and Pyne1992) (Fig. 7A).
Arrays of sub-parallel minor quartz veins, and a several m-wide zone of characteristic pink to red metasomatised country rock, mark one or both margins of the Vein. The pink colouration is due to the introduction of K-feldspar and this zone passes out into sericitised and chloritised country rock (Earls et al. Reference Earls, Parker, Clifford, Meldrum, Bowden, Earls, O'Connor and Pyne1992).
Apart from the quartz breccia, the other constituents of the Vein form a complex pattern of discontinuous lenses on a 1–50 m-scale. These lenses are cut by both minor shear zones, the ‘pyritic shears’ of Earls et al. (Reference Earls, Parker, Clifford, Meldrum, Bowden, Earls, O'Connor and Pyne1992), and in places by shear zones that may be traced for >100 m (Dominy et al. Reference Dominy, Platten, Xie, Sangster and Dominy2009), but no shear sense was recorded by these workers.
The continuation of the Vein outside of the area covered by Figure 7A is uncertain. Southwest from the portal, the vein passes laterally into a zone of metasomatised country rock before it meets the Barren Vein, and this may mark the termination of the quartz breccia body. However, the Cononish Fault, which hosts the deposit, can be followed along strike to two disused Pb mines above the Allt an Rund (Fig. 6), and there may be further Au–Ag mineralisation in this section. A 1·6 m-thick quartz breccia vein, which was formerly worked on both banks of the Allt an Rund, strikes at 040° and dips at 73°SE, an orientation very close to that of the Cononish Vein farther NE.
Northeast of the adit portal, the last known exposure of the Cononish Fault occurs 40 m before its inferred intersection with the Mother Vein, on the SW bank of the burn (Allt Eas Anie) at [NN 2995 2898], where there is a 7 m-long trench exposing pink metasomatised psammite with thin quartz veins.
2.1.2. Beinn Udlaidh Vein
The outcrop of this quartz-breccia vein, which approaches within 150 m of the summit of Beinn Udlaidh, is partially obscured by glacial deposits. The parent Beinn Udlaidh Fault brings rocks of the Grampian Group, on the SE side, into contact with lamprophyre sills and the Beinn Udlaidh Quartzite to the NW (Fig. 7B). However, the displacement on the fault is small because the locality is close to the crest of the Glen Orchy Dome, where the rocks dip at <15° and only a small vertical movement was necessary to give the present outcrop pattern. The Beinn Udlaidh Vein can be traced for >1·4 km and consists of at least four segments (Fig. 7B). It trends at 043° and varies in dip from 70°SE, at the SW end, through the vertical, to ∼80°NW, at the NE end. The mean orientation of the quartz breccia bodies is strike 044°, dip 88°SE (N=5). The thickness of the vein has not been measured consistently but averages around 4 m.
Ennex International investigated the economic potential of the Beinn Udlaidh Vein in 1985 by channel samples taken across the full width of the Vein and by diamond drilling. This operation showed that significant Au–Ag mineralisation was present (Au: 11·1–167 g/t over 1 m), and recent diamond drilling has yielded, for example, 2·8 g/t Au and 359 g/t Ag over 1 m (Scotgold 2010).
2.1.3. Coire Daimh Vein
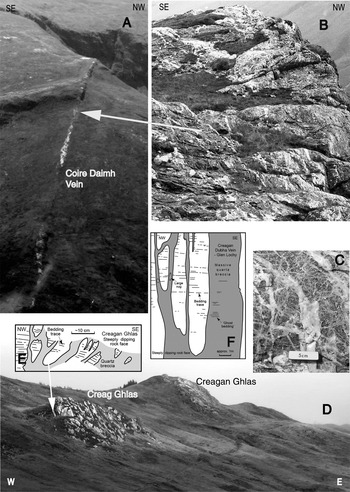
This well-exposed, apparently non-mineralised vein crosses the ridge that runs north from Beinn Udlaidh and can be traced for 1·2 km. It is divided into four segments, of which most of the terminations are clearly seen, and two overlap in plan view (Figs 7C and 9A). The vein is up to 16 m thick and consists of a stockwork of quartz veins with units of massive white quartz (Fig. 9B). At either end of its outcrop, the vein passes into a zone of brecciated country rock, with the host fault continuing to the SE across Coire Daimh, and to the NE to the Allt Ghamhnain (Fig. 6). The vein has a calculated strike of 026° and a dip of 80°SE; the mean orientation for the margins of the quartz breccia is: strike 027°; dip 76°SE (N=7).
(A) The segmented nature of the Coire Daimh Vein (Q 1–4 on Fig. 7C) as seen on the steep valley side above the Allt Ghamhnain; the photograph, taken from a light aircraft, was provided by Peter Thomas. (B) Cross-sectional view of part of the Coire Daimh Vein, viewed to the SSW, showing the random orientation of the quartz veins and lenses, and their irregular nature. (C) A boxwork of quartz veins in the country rock, adjacent to the margin of the Mother Vein SW of Meall Odhar. (D) Major segments of quartz-breccia, with massive white quartz constituting the Creagan Ghlas Vein complex in Glen Orchy, viewed to the NE. (E) Field sketch of the relationship between the quartz breccia and the country rock on Creagan Ghlas (location on Fig. 7E). (F) Massive quartz and quartz breccia (Creagan Dubha Vein) invading flat-lying Dalradian psammite/semi-pelite on the N side of Glen Lochy at [NN 2822 3217] (Fig. 6).

For most of its length, the Coire Daimh Vein cuts across and displaces the upper, gently dipping and inverted limb of the D2 Beinn Udlaidh Syncline, whose axis plunges at 06° to 064° and axial plane dips at 20°N. This Vein, although apparently lacking mineralisation, is important in that it sheds light on the geometry of major segmented veins. For example, a photograph taken of the most northeasterly segment (Fig. 9A, location on Reference Browne, Smith and AitkenFig. 7C) shows that it terminates vertically downwards, rather than becoming thicker, or being connected to a parent vein at depth.
2.1.4. Mother Vein
Previously called the ‘Mother Reef’ (Treagus et al. Reference Treagus, Pattrick and Curtis1999), it is best exposed on Meall Odhar (Fig. 6) where it comprises over eight distinct segments, each 150–250 m long, arranged in-line (Fig. 7D). These segments were previously reported to form an en-echelon array (Treagus et al. Reference Treagus, Pattrick and Curtis1999), but field measurements and examination of aerial photographs fail to support this interpretation.
The Mother Vein consists mainly of quartz breccia and massive white quartz; it is 4–7 m thick, but locally reaches 19 m. Although the vein is generally considered to be non-mineralised, electrum was reported by Pattrick (Reference Pattrick1985). Treagus et al. (Reference Treagus, Pattrick and Curtis1999) found Pb–Zn mineralisation at the western, faulted margin of the vein, and Scotgold have reported low but consistent Au and Ag values from a number of localities along the Vein (Scotgold 2010).
Distant bearings taken along strike of the Vein on Meall Odhar, together with clinometer readings, and GPS mapping of the line of the fault for >3 km, all combine to show that it has a strike of 028°, and a dip of 87°SE. This orientation is in agreement with those recorded from the margins of the quartz breccia vein whose mean value is strike 027°, dip 89°SE; (N=27).
The combined fault–vein structure can be followed for over 5 km, but there is a lack of stratigraphical markers or boundaries to indicate the amount or sense of displacement across it. However, where the Mother Vein crosses the Boundary Slide it causes little displacement (Fig. 4).
The contact between the Vein and the country rock varies between a sharp faulted margin, and a gradational boundary across which the foliation in the Dalradian rocks can be traced without deflection, and is indicative of in-situ replacement. Locally, the bedding/foliation is preserved as a ghost fabric in the Vein. West of the Vein, bedding and foliation in the country rock generally retain their regional orientation up to the contact, but this is seldom the case on the east side, where drag folds occur. The observation of Treagus et al. (Reference Treagus, Pattrick and Curtis1999, fig. 3d) that drag folds generated by fault displacement (amount unknown) occur on both sides of the vein, and can be used to determine the sense of displacement, could not be substantiated.
Areas of silicified country rock, which in places preserve minor D2 folds, occur along the margins and between the ends of both adjoining, and overlapping, segments. These silicified rocks are generally separated from the unaffected host rock by a complex of thin (cm-scale) quartz veins (Fig. 9C) (shown in blue on Fig. 7D). Certain orientations of the veins are dominant, e.g. a random selection from locality A, Figure 7D gives a mean of strike 201°; dip 84°NW (N=11), but the veins at a single locality cannot be grouped into clearly defined sets, as suggested by Treagus et al. (Reference Treagus, Pattrick and Curtis1999).
A late, brittle fault runs along part of the western margin of the Vein and is marked in places by a zone of banded cataclasite and fault gouge (Fig. 7D, loc. B). The adjoining quartz breccia is crushed and progressively transformed into a fault rock with relict isolated angular fragments of quartz breccia. At locality C (Fig. 7D), the fault gouge is itself crossed obliquely by a band of quartz breccia. Highly fractured portions of a quartz-dolerite dyke, up to 4 m thick, are found within the fault zone 18 m farther SW, and probably correlate with the dyke to the west (Fig. 4). Hence, at least localised fault movement clearly took place after the Late Carboniferous.
Farther SW, near Eas Anie, at [NN 2913 2837], the Mother Vein has a different character and comprises two dyke-like bodies of quartz breccia, 6 m and 9 m thick with 31 m of brecciated country rock sandwiched between them.
2.1.5. Significant features of other major veins
Creagan Ghlas Vein complex
This vein system is located on the NW side of Glen Orchy, near Catnish (Fig. 5). In the SW it consists of a plexus of three faults, each marked by a 1–3 m-thick quartz breccia dyke, but farther NE, three bodies of quartz rock tens of metres thick lie between the faults (Figs 5, 7E and 9D). Due to a lack of rock exposure around these large bodies, it is uncertain how some of the faults link up. The complex has been studied in reconnaissance detail here, but merits further work.
The approximate orientation of the quartz-breccia/massive quartz–country rock contact, on the NW side of the complex, is strike 036°, dip 76°SE (N=3), and is apparently intermediate between the Cononish and the Coire Daimh veins. Excellent examples of vein/country rock relationships are seen in places along the margins of the massive quartz lenses. For example, at the locality labelled on Figure 7E, ‘tongues’ of quartz appear to have been introduced passively into the country rock, in part preserving the main foliation (Fig. 9E). The thicker bodies in the complex consist mainly of barren, massive, white quartz.
Halliday's Vein
This quartz breccia vein, which trends at 045°, was reported by Halliday (1962; in Pattrick et al. Reference Pattrick, Boyce and MacIntyre1988). It crops out in a burn a few tens of metres NNE of, and aligned with, the shaft of the Tyndrum Pb–Zn mine (Fig. 6). Earlier reports that it is gold-bearing have recently been confirmed by Scotgold (2010), with Au=57 g/t. However, it is not aligned with the Cononish Vein, and no extension of it has been found elsewhere along strike.
Lower Adit Vein
Named after the Lower Adit on Cononish cliff (Figs 7A and 8C), this Pb–Zn vein follows approximately the line of the Cononish Vein underground, but diverges considerably from it in places. It is probably the source for the Pb formerly mined along the extrapolated line of the Cononish Fault to the Allt an Rund.
Creaghan Dubha Vein
This vein consists of a number of parallel pendant-like lenses of vuggy quartz. The near-horizontal trace of the adjacent bedding and concordant D2 foliation continues undeflected from side-to-side of the Vein, and is preserved locally within it (Fig. 9F).
Creaghan Soilleir Vein
comprises a number of N-trending quartz lenses, which have a laterally offset arrangement and give the impression from a distance that the composite vein is curved and trends approximately NE (Fig. 6). Evidence of small-scale mining of this vein for Pb–Zn mineralisation is seen at several places.
Coire Seileach Vein
This N-trending vein (Fig. 6) provides a good example of a quartz breccia body with overlapping segments.
Barren Vein
The precise orientation of this vein, which passes close to the summit of Beinn Chuirn (Fig. 6), has been determined from structure contours as strike 155°, dip 69°SW, and provides the standard for the NNW vein set.
River Vein
This gold-bearing vein is located in the River Orchy (Fig. 6) and was discovered by Scotgold (Scotgold 2010). Other veins belonging to this set are distinctive in that they have bright red metasomatic selvedges along their margins (especially in psammite) and trend in an unusual direction: 300–330°.
The River Vein is cut by a number of mineralised fractures and thin veins that trend NE and displaying their igneous parentage by the presence of abundant molybdenite (D. Catterall, pers. comm. 2012). Similar Mo-bearing veins are found at Blackmount close to the Moor of Rannoch Granite. Curtis et al. (Reference Curtis, Pattrick, Jenkin, Fallick, Boyce and Treagus1993) and Lowry et al. (Reference Lowry, Boyce, Fallick and Stephens1995) showed that they have a magmatic isotopic signature.
3. Segmentation of the quartz-breccia veins
Segmentation is a fundamental feature of veins, major fractures and faults, but the factors that control the relationship between the thickness of a vein, width of a fault zone etc., and the length and separation of the segments, have yet to be quantified.
All of the major quartz veins in the area are divided into a string of ‘in-line’ segments that taper at their ends. For example, the Mother Vein on Meall Odhar consists of five segments, up to 250 m in length, that are parallel to the mean orientation of the vein for >1·2 km (Fig. 7D). With the exception of the Barren and Coire Seileach Track veins (Fig. 6), the individual segments neither meet, nor overlap.
The Coire Daimh Vein, which is partly exposed on flat ground, and partly on the steeply inclined N-facing valley side in Coire Ghamhnain (Fig. 7C), provides a rare opportunity to examine the 3-D geometry of the vein segments. An along-strike view of this vein from the NNE (Fig. 9A) shows that the segments terminate downwards as well as horizontally, suggesting that they may have a circular or elliptical shape in plan view. The Mother Vein shows similar features, but less clearly.
3.1. The formation of individual segmented veins
There are a number of ways in which segmented quartz veins may form, including: (1) en-echelon veins formed during simple shear; (2) pull-apart veins due to simple shear; (3) bladed single veins due to rotation of the principal stress axes at a free surface; (4) boudinage of a once-continuous vein; and (5) formation of crack-fill veins normal to the minimum principal stress direction.
1. Treagus et al. (Reference Treagus, Pattrick and Curtis1999) proposed that the Mother Vein originated as five discrete, offset segments within dilating R fractures, each at 7° anticlockwise to the margins of a shear zone. The later was parallel to the Tyndrum Fault and both formed in response to regional left-lateral transtension. The segments consisted of hydrothermal quartz-breccia, and were later cut by a set of en-echelon, extensional quartz veins at 45° to its margin, which were subsequently rotated by simple shear to their present orientation. The same model was suggested for the Cononish Vein.
There are several obstacles to accepting this model: (i) the major vein segments are in-line, anchored to the country rock (Fig. 9E and F) and do not have an en-echelon or stepped configuration; (ii) there is no evidence to show that veins within the breccia have been rotated; and (iii) the only sign that simple shear has affected these breccia bodies is recorded by mm–cm shear zones, which cross the vuggy veins. They are best seen in underground exposures of the Cononish Vein (Earls et al. Reference Earls, Parker, Clifford, Meldrum, Bowden, Earls, O'Connor and Pyne1992), where they are called ‘pyritic shears’, but are uncommon in the other major veins.
2. As described earlier, there is no evidence to suggest that the individual segments are linked to a single, thicker parent vein at depth.
3. Pull-apart structures form due to the overlap of adjacent strands in a strike-slip fault zone. Possible examples of this type of vein infill are seen in the Creagan Ghlas Vein complex in Glen Orchy (Fig. 7E).
4. In the Tyndrum–Dalmally area, features characteristic of boudinage, such as the development of quartz nodes and/or neck folds that would be expected to be evident between the terminations of adjacent breccia bodies, are absent. Bedding/foliation in the Dalradian host rock passes without deflection across the gap between adjacent tips, for example at location D (Fig. 7D).
5. The internal morphology of the quartz-breccia veins provides clear evidence that the whole edifice was generated in a dilational environment.
3.2. Summary
It is envisaged that silica-rich fluids utilised newly-formed fault planes as conduits to move to higher levels in the Earth's crust, and that the bodies of quartz breccia resulted from the passive in-situ modification of the fault breccia, probably in a series of pulses. Hence, the geometry of the quartz-breccia bodies at Cononish could have been controlled by a pre-existent irregular distribution of breccia pods along the fault plane, as described by Phillips (Reference Phillips1972) from faults in mid-Wales. Such features give rise to lateral variations in hydraulic properties: certain fault segments act as barriers to fluid flow, whereas others function as conduits, or show mixed behaviour. A case study of such a system, albeit in carbonate rocks, was presented by Matonti et al. (Reference Matonti, Lamarche, Guglielmi and Marié2012) (compare their figure 13 with Fig. 7D).
4. Internal morphology of the quartz-breccia veins
Each quartz-breccia body, regardless of its size or orientation, consists largely of a complex network of vuggy quartz veins, individually up to a few cm in thickness, that wrap around, and isolate, angular fragments of the country rock. The breccia contains vugs lined with euhedral quartz crystals, which are lightly dusted with haematite, and preserve internal crystal surfaces outlined similarly. In many of the major veins, rusty-looking films (? of haematite) are seen on fracture surfaces within massive quartz or quartz breccia, giving the rocks a pink hue.
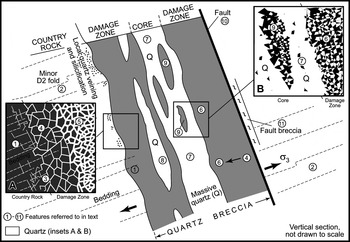
Only the Cononish Vein (Parker et al. Reference Parker, Clifford and Meldrum1989; Earls et al. Reference Earls, Parker, Clifford, Meldrum, Bowden, Earls, O'Connor and Pyne1992; Dominy et al. Reference Dominy, Platten, Xie, Sangster and Dominy2009) and the Mother Vein (Treagus et al. Reference Treagus, Pattrick and Curtis1999) have been described previously. Most of the early workers considered them to be ‘hydrothermal breccias’ (Pattrick Reference Pattrick1985), but gave no specific details of their morphology. There is only passing mention in the literature of occasional vuggy and crustiform structures in some of the major veins, possibly because freshly-cut surfaces or ‘clean’ fractures do not generally show details of the internal structure of the quartz breccia (Fig. 1C). However, even these surfaces do reveal some clues as to the origin of the quartz matrix, such as radiating aggregates of quartz crystals and relict vugs. Crack-seal quartz fabrics and ‘stretched’ quartz crystals are absent from even the thinnest veins associated with the breccias. Representative types of quartz-breccia vein are now described in more detail, with reference to Figures 10 and 11. The latter is an idealised, composite, vertical cross-section, designed to show the relationship between the different features seen in these quartz-breccia veins. It is stressed that no single major vein displays all of these features: some consist mainly of massive quartz and others of quartz breccia. The veins are either symmetrical with a gradational boundary on either side, or have one faulted contact.
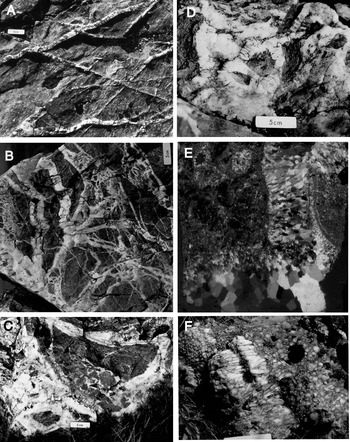
Representative examples of open-space quartz veins in the major quartz-breccia bodies of the Tyndrum–Dalmally area. In all cases except E the scale is 5 cm long: (A) a network of hydrothermal quartz-breccia veins in the country rock psammite adjacent to Creagan Ghlas Vein complex; (B) angular fragments of country rock wrapped by crack-fill veins with vuggy central zones, representing an early stage of cockade formation; (C) cockade texture consisting of breccia fragments encased in several generations of crack-fill veins; (D) internal structure of comb-textured quartz veins in a cockade structure as revealed by weathering; (E) scanned image showing the internal structure of a crack-fill vein nucleated upon a rock fragment, which shows the internal development of minute vugs (0·50 mm across); (F) the morphology of face-controlled, comb textured quartz veins seen in 3-D. Terminology based on Vearncombe (Reference Vearncombe1993).

Conceptual model of a typical quartz-breccia vein, incorporating features (1)–(11) (see text) characteristic of such bodies in the Tyndrum–Dalmally area.

As the major vein is approached, sets of widely spaced, narrow, rectilinear quartz veins, with differing orientations, appear in the country rock along the outer margins of some of the major veins (Fig. 10A). The small veins have a vuggy texture and enclose numerous angular portions of host rock and are a representation, in miniature, of the parent body. At the contact, the country rock contains either a few thin quartz veins (Fig. 11, 1), or develops minor vein complexes (Fig. 11, 3). Minor D2 fold structures (Fig. 11, 2) are preserved in the silicified zone adjacent to the main vein and generally have the same vergence and orientation on the opposing side of the vein.
In the outer part of the quartz breccia, the minor veins become thicker, branch, and sub-divide (Fig. 10B). Bedding and S2 commonly retain their original orientation in blocks within the damage zone (Fig. 11, 4). Farther into the breccia body, angular fragments of protolith become subdivided and mantled by thicker and more complex sets of crack-fill veins (Fig. 11, 5), to give a cockade texture (Fig. 10C), as defined by Genna et al. (Reference Genna, Jébrak, Marcoux and Milési1996). As the core of the original fault zone is approached, successive generations of vuggy or open-space quartz veins have crystallised along newly-formed fractures that split the wall-rock breccia fragments into progressively smaller units (Fig. 11, 6), resulting in them being mantled by multiple sets of encrusting veins (Fig. 10C), and developing crustiform textures. In the more quartz-rich portions of the parent breccia, this process has resulted in a chessboard pattern of vugs alternating with wallrock fragments, as quartz crystals growing out from the fragments met those rooted on their neighbours. Vuggy zones developed between them, in which the quartz crystals grew in a fluid-filled cavity, and developed rhombohedral terminations (Fig. 10D). The ‘core’ consists either of massive quartz, or quartz breccia with widely separated, matrix-supported, angular rock fragments (a cryptic cockade texture) (Fig. 11, 7; Fig. 1C). Bodies of massive quartz or quartz containing only a few rock fragments are present in the damage zone (Fig. 11, 8), and units of wallrock breccia fragments identical to that in the inner part of the damage zone occur within the core (Fig. 11, 9). Some of the fragments in the core possibly preserve a pre-silicification shear fabric. A (?) late fault, with a highly polished slickenside and accompanying cataclasite, defines the margin of some of the breccia bodies (Fig. 11, 10 and 11).
Thin sections of the cockade veins illustrate (i) the growth pattern of the prismatic quartz crystals that developed orthogonal to the vein margin; and (ii) the presence of minute vugs inside the wallrock fragments (Fig. 10E). Deeply weathered and frost-shattered examples of these veins show clearly the 3-D internal arrangement of the quartz prisms in the cockade structure (Fig. 10F), and the contrast in morphology between the two sides of the vein.
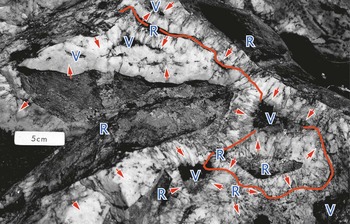
The cockade texture annotated in Figure 12 indicates how the space problem resulting from the synchronous growth of crystals from all of the breccia fragments is resolved. This Figure shows discontinuities (highlighted in red) between the quartz veins mantling adjacent rock fragments (R), which, although they give the impression that pressure dissolution has occurred, are almost certainly ‘compromise boundaries’ between different sets of actively growing quartz crystals.
Analysis of the growth pattern shown by cockade-textured quartz veins mantling rock fragments (R), with prismatic quartz growing into vugs (V) in a quartz-breccia vein. The growth directions of the quartz crystals are shown by red arrows and a compromise boundary in the growth pattern is marked by a red line.

The effects of simple shear on such textures is illustrated by Genna et al. (Reference Genna, Jébrak, Marcoux and Milési1996) and involves the deformation and rotation of individual cockades and the development of duplex-like sets of dislocations, none of which are seen in the vein complexes studied here.
4.1. Summary
The quartz breccias from the Tyndrum–Dalmally area have most of the characteristics of hydrothermal, fluid-assisted brecciation (Phillips Reference Phillips1972), which include jigsaw puzzle and open-space breccias; very angular, non-rotated fragments that tend to be of uniform size at a given level in the structure; and little or no comminution of fragments (Jébrak Reference Jébrak1997). A common feature is the subdivision of large breccia fragments into a series of smaller units, which individually retain their same relative orientations and have only undergone dilational displacement (Fig. 1C). Fluids were channelled from lower levels in the crust and injected forcibly at a higher level into the major faults, utilising the pre-existing pattern of fractures in the damage zones and core. The fragments were forced apart by the invading fluid and layers of crystalline material, in this case quartz, were deposited as a series of concentric shells around the wallrock fragments to form a cockade texture.
In the above situation, pore fluid pressure was greater than lithostatic pressure, causing brecciation, followed by leakage of the fluid along the fault plane to the surface. The conduit was then sealed by crystallisation, fluid pressure built up again, movement on the major fracture was renewed and the process of hydraulic pumping (Sibson Reference Sibson1977, Reference Sibson, Knipe and Rutter1990) and crystallisation of quartz was repeated.
5. Geometry of the fault–vein array
The majority of faults in the Tyndrum–Dalmally area trend between NE–SW and NW–SE (Figs 4 and 6), and it is significant that four NE-trending faults, namely, the Tyndrum, Cononish, Beinn Udlaidh and Arichastlich faults, are noticeably discordant to the general conjugate pattern. It is also evident from Figure 6 that, in many cases, individual NNE- and NNW-trending faults change direction and become N-trending structures, suggesting that these particular faults were contemporaneous and formed a linked system. Most of the faults in the Tyndrum–Dalmally area dip at a high angle, with 80% having a dip of >65°, which is atypical for normal, dip-slip faults.
In order to determine the sequence of events, it is necessary first to establish the timing of the fault movements, and their relationship to the Orchy Dome, which has an axial trace trending at 087°, and limbs dipping to north and south at <25°. Examining first the mineralised veins, the Beinn Udlaidh Vein is near vertical, and cuts the Dome close to its highest point, and the Cononish Vein has a dip that, though ranging from 75°SE to 75°NW, is also essentially vertical. These simple relationships suggest strongly that the Orchy Dome formed before the faulting took place. If the converse were true, and both veins were sub-vertical prior to doming, the Beinn Udlaidh Vein, on the crest of the structure would have retained its original orientation, but the Cononish Vein, which cuts the southerly dipping limb of the Dome, would have been rotated to dip NW, instead of steeply SE, as at present. Had it been rotated to its present orientation during the development of the Dome, the Cononish Vein would have had an initial dip of ∼50°SE and been markedly oblique to the Beinn Udlaidh Vein; an unlikely configuration. Similar reasoning applies to the other near-vertical veins and faults that cut the Orchy Dome. It seems likely that they also formed in the late stages of, or following, the formation of the Dome.
In the absence of clear cross-cutting relationships between the Cononish Vein Set and the other major vein sets, it is difficult to be certain of the order in which they formed. However, individual veins belonging to the Cononish set all appear to terminate just before, or against, through-going veins/faults belonging to other sets and it seems most likely that they pre-dated the other vein sets but had some influence on their spatial development.
5.1. Stereographic analysis
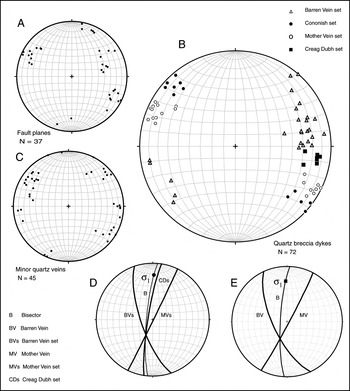
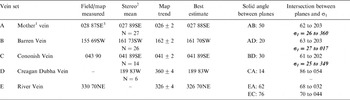
In the Tyndrum–Dalmally area, the orientations of the faults unaccompanied by quartz breccia, and traceable for >10 m, are shown on Figure 13A. There are clear similarities between this scatter plot and that for the faults accompanied by quartz breccia veins (Fig. 13B), and especially for minor quartz veins from the quartz breccia/country rock transition zone (Fig. 13C). Although these comparisons are not statistically valid, because the sampling was not random, and some quartz breccia veins are over-represented, the plots suggest that it is valid to sub-divide the data into sets represented by a mean value (Table 1). The rare steeply dipping set of E–W faults, which are associated with minor quartz veins, but not quartz breccia or massive quartz bodies, are excluded, as they are probably late fractures associated with the emplacement of the quartz-dolerite dykes (Fig. 4).
Equal-area stereographic projections showing the relationships between the major quartz-breccia veins (either individually or in sets), faults, and minor quartz veins from the Tyndrum–Dalmally area: (A) scatter plot showing poles to fault planes (see text for further explanation); (B) scatter plot showing poles to quartz-breccia dykes, divided into sets by inspection according to their orientation; (C) poles to minor quartz veins (see text); (D) great circle plot showing the calculated measured mean orientations of veins making up the conjugate Mother Vein and Barren Vein sets; the plane that bisects the acute angle between them; the derived σ1 direction; and the mean orientation of the Creagan Dubha set; (E) great circle plot showing the orientations of the individual Mother and Barren veins; the plane that bisects the acute angle between them; and the derived σ1 direction.

Geometry of the quartz-breccia vein sets. All values are in degrees

1 Includes proto-Mother Vein.
2 Calculated from equal-area stereographic projection.
3 Strike/dip/dip direction.
Inspection of the scatter plot for the quartz breccia veins (Fig. 13B), and of Figure 6, shows that the NNE- and NNW-trending quartz breccia veins form a conjugate pair bisected by the N–S set, with the NE-trending faults forming a separate group.
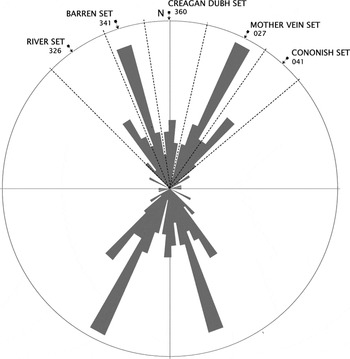
In order to overcome the sampling bias noted above, the azimuths of the total population of faults, excluding the E–W set mentioned above, were plotted on a rose diagram, against the corresponding length of the fault trace on the map (total length measured=34·8 km at 1:3700 ) (Fig. 14). For this purpose, each fault trace was divided into consecutive segments in which the azimuth was constant to within a couple of degrees: the more curved the trace, the greater the number of segments. This technique is defensible, as the faults are nearly all steeply dipping to vertical, and the fault trace is very little affected by topography. Structure contours were used where this is not the case.
Rose diagram showing the calculated mean azimuths of faults and of the associated quartz-breccia bodies versus their length (total length=34·8 km). The sets are delimited by natural breaks in distribution, as highlighted by pecked lines; mean values are marked by an arrow, with strike direction in degrees.

The rose diagram (Fig. 14) shows that the readings fall naturally into five clearly-defined sectors that correspond to the four main vein sets identified above, together with a sector representing the River Vein set. There is a very close agreement between the means calculated from the stereographic analysis, and from the rose diagram (compare Fig. 14 with Table 1).
As a check on the precision of using the mean values for the orientation of each set, the measured orientations of the best-exposed individual vein in each set, i.e. the Mother Vein and the Barren Vein, are plotted on Figure 13E; they give σ1=25° to 358°, that is almost identical to σ1 obtained from the mean values (26° to 360°).
5.2. Application of the modified Coulomb model
This model is based on the Coulomb criterion for brittle failure in rocks and describes the orientation of conjugate shear fractures with respect to σ1 (the maximum principal stress) in brittle and brittle-ductile shear zones. It has been tested extensively by analogue modelling, notably by Riedel (Reference Riedel1929), Cloos (Reference Cloos1955) and Wilcox et al. (Reference Wilcox, Harding and Seely1973), and by numerous field studies (Sylvester Reference Sylvester1988), and is recognised as one of the tenets of structural geology.
The theoretical angle between the synthetic (R) and antithetic (R′) conjugate Riedel fractures and the direction of σ1, is given by the equation 45°±φ/2, where φ is the internal angle of friction of the rock, and is typically close to 30° for the average dry, intact, crustal rock. P shears form parallel to the margin of the shear zone, and pure tensional (T) fractures develop at 45° to it. However, when considering these angular relationships, other factors have to be taken into account such as Griffith's cracks, which reduce the strength of the rock, and pore fluid pressure, which reduces the effective stress across the fracture plane and hence the frictional resistance to movement (Hubbert & Rubey Reference Hubbert and Rubey1959). These factors were quantified by Sibson (Reference Sibson2000) who, by combining the Coulomb and Griffith criteria, derived an expression for brittle failure of intact rock in the presence of pore fluid. He obtained an optimal value of 54° for the acute angle subtended by conjugate shear planes under these conditions.
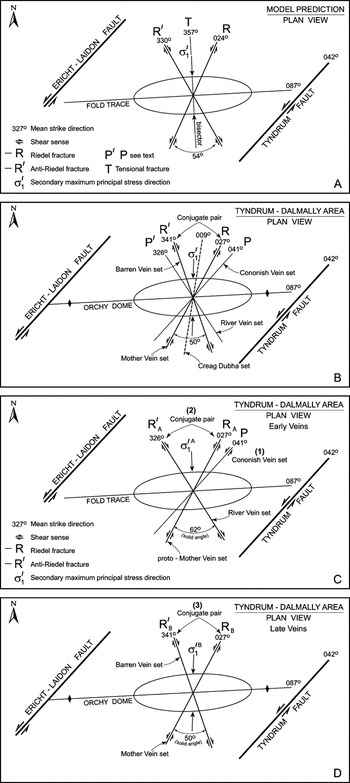
The implications of this model for the geometry of fractures in the Tyndrum–Dalmally area are now examined. The first problem is that the age of the Orchy Dome is not known and it could have formed either in response to a far-field regional stress (pure shear) or to simple shear arising from sinistral movement on the Tyndrum and Etive–Laidon fault pair. In the first case σ1 would trend at 042°–30°=012° and in the second, the shear couple would result in a secondary maximum principal stress (σ1′) trending 357°, generating a fold trending 087°, cut symmetrically by conjugate faults (Fig. 15A). Doming may have been caused by a buried igneous intrusion, but this seems unlikely, as the nearest negative gravity anomaly lies well to the north of the Dome (Scotgold 2012).
Comparison of the angular relationships between the sets of quartz-breccia veins and faults a predicted by the Coulomb–Sibson model, with the observed values: (A) geometry of the Mother Vein (R) and Barren Vein (R′) sets as predicted by the Coulomb model, modified after Sibson (Reference Sibson2000), and based on the orientation of the bounding faults. The solid angle between the fractures is 54°; (B) plan view of the present angular relationships between the major vein sets, the Orchy Dome, and the bounding transcurrent faults (for key, see A above); (C) plan view of the geometrical relationships between the proto-Mother Vein (RA) and the River Vein (R′A) sets, the Orchy Dome, and the bounding transcurrent faults; (D) plan view of the geometrical relationships between the Barren Vein (R′B) and Mother Vein (RB) sets, the Orchy Dome, and the bounding transcurrent faults.
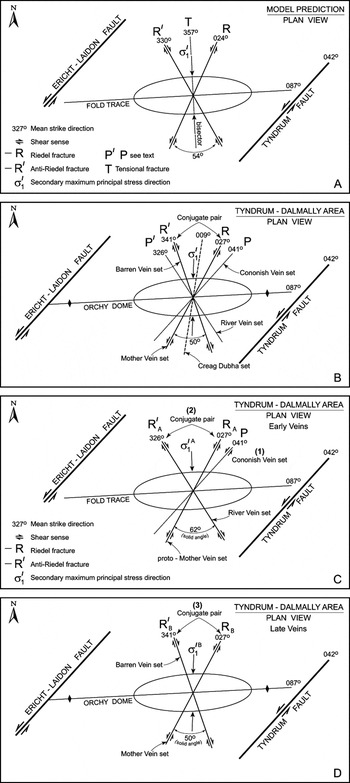
The angular relationships between all of the sets of major fractures, and the Orchy Dome, are shown in Figure 15B. The sets lie almost symmetrically about a N–S line, with the trends of the Mother Vein–Barren Vein pair being in close agreement with those predicted for Riedel shears formed in the same stress field as the Orchy Dome (their bisector is within 6° of being orthogonal to the trace of the Dome). The solid angle between the Mother and Barren vein sets is 50°, compared with the theoretical value of 54–60°. The Creagan Dubha set equates with the extensional T fractures and, although it divides the angle between the other vein sets disproportionately, being at 12° clockwise to the modelled orientation of the T direction (a discrepancy probably due to the small sample size), all three planes intersect in a single point and have a combined σ1=27° to 002°.
The above relationships clearly favour the simple shear model, and a temporal link between the fractures and the Dome is further indicated by the observation that many of the faults and quartz-breccia bodies occur in the central part of the Dome.
The remaining River Vein set, although of minor importance and under-represented, poses a problem, as it has no obvious partner (the Cononish Vein being parallel to the Tyndrum Fault, the compartment boundary). A possible explanation is that the Mother Vein Fault was active more than once; firstly, as an early mineralised fracture (the proto-Mother Vein, RA on Fig. 15C) that formed a conjugate pair with the River Vein (R′A) and, secondly, as the main, non-mineralised component (Mother Vein, RB) that formed a conjugate pair with the Barren Vein (R′B). The River Vein set makes an angle of 75° with the Tyndrum Fault, and 62° with the Mother Vein, the latter being close to the angle predicted by the Coulomb criterion for the formation of R shears in dry rock. The calculated σ1=17° to 174°, is at 45° to that for the Barren Vein–Mother Vein pair.
5.3. Summary
The history of fold and fault development is as follows:
1. Formation of the Orchy Dome. The fold locked-up early in its development, possibly due to it being ‘pinned’ by the lamprophyre intrusions and breccia pipes.
2. The mineralised Cononish Vein set formed parallel to the Tyndrum Fault as a series of well-spaced P-fractures cutting the Dome.
3. The River Vein and proto-Mother Vein sets formed as Riedel R and R′ shears, with classical Coulomb geometry for ‘dry’ rock.
4. The Barren Vein and (reactivated) main Mother Vein sets formed as Riedel shears, but with modified Coulomb geometry, as predicted for ‘wet’ rock.
5. σ1 switched from 17° to 174° about the horizontal to 27° to 002° during events 2--4, but maintained its overall N–S orientation.
6. Age of the quartz-breccia veins
There are probably two distinct populations of quartz-breccia veins in the Tyndrum–Dalmally area, the River Vein–proto-Mother Vein conjugate pair and the Barren Vein–Mother Vein conjugate pair, which may be significantly different in age. Field relationships described in the previous section suggest that the Cononish Vein set is possibly older than both of them, but there are no radiometric age data with which to quantify any age differences. The younger Pb–Zn-bearing veins associated with the mineralisation are not considered here, as they are poorly exposed at the surface, and have been little studied. In the absence of minerals suitable for radiometric dating, the only age determination directly linked to the formation of the quartz-breccia veins, is a K–Ar age of 410±14 Ma on K-feldspar from the metasomatised wallrock of the Cononish Vein (Treagus et al. Reference Treagus, Pattrick and Curtis1999).
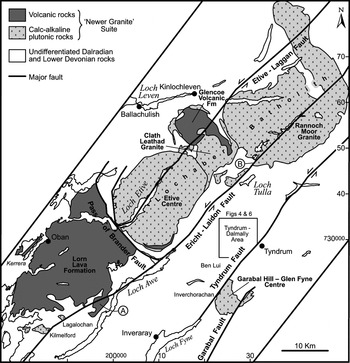
The age of the lamprophyre suite in the Tyndrum–Dalmally area is of critical importance, as it is of approximately the same age as the major veins and faults. It has not been dated radiometrically but belongs to the Scottish Highlands Silurian Suite (also termed the ‘Newer Granites’), members of which crop out between the Garabal Hill–Glen Fyne Centre, south of Tyndrum, and Rubha Mhor, near Ballachulish (Fig. 16). Previous U–Pb ages on these two intrusions (Rogers & Dunning Reference Rogers and Dunning1991) were revised by Neilson et al. (Reference Neilson, Kokelaar and Crowley2009), to 428±9·8 and 426·5±4·2 Ma, respectively. The latter concluded that the entire suite was emplaced 430–415 Ma ago. In general the lamprophyres were associated with the emplacement of the ‘Newer Granites’, but locally pre-dated the intrusion of individual plutons. A maximum age of 430 Ma may therefore be inferred for a putative igneous intrusion present beneath the Tyndrum–Dalmally area, which could have provided Si-rich fluids to form the major quartz veins (see further discussion below) (Table 2).
Regional setting of the Tyndrum–Dalmally area (boxed) in relation to major transcurrent faults and to the Lochaber Batholith (modified from Neilson et al. Reference Neilson, Kokelaar and Crowley2009). For A and B, see text.

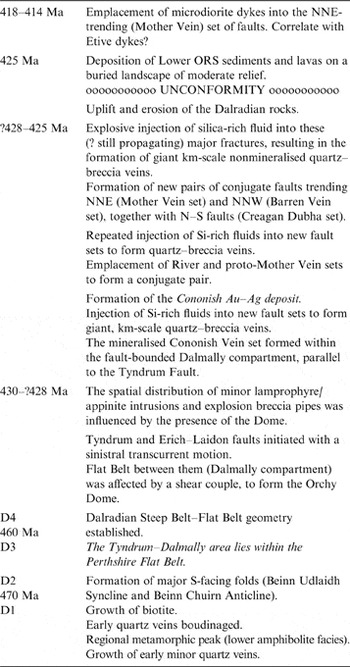
Major events in the geological history of the Tyndrum–Dalmally area

New high-precision U–Pb (zircon) and Re–Os (molybdenite) radiometric dating of certain plutons and lavas in the region around Tyndrum places limits on the age(s) of movement(s) on the faults that bound the Dalmally compartment, and hence on the age(s) of the major quartz-breccia veins. All of the plutonic rocks NW of the Tyndrum–Dalmally area as far as Loch Linnhe, currently designated the Argyll and Northern Highland Subsuite of the Scottish Highland Silurian Suite (‘Newer Granites’), together with contemporaneous volcanic rocks, were collectively termed the Lochaber Batholith by Neilson et al. (Reference Neilson, Kokelaar and Crowley2009) (Fig. 16). Part of this batholith, the Cruachan Monzodiorite Pluton of the Etive Centre yielded an ID-TIMS U–Pb (zircon) age of 414·9±0·7 Ma (Neilson et al. Reference Neilson, Kokelaar and Crowley2009), an emplacement age recently confirmed by Porter & Selby (Reference Porter and Selby2010) who obtained a Re–Os date of 414·7±2·1 Ma from the skarn to the Cruachan Monzodiorite. As elements of the Etive Centre cut across both limbs of the Orchy Dome, albeit NW of the Ericht–Laidon Fault, their emplacement at 415 Ma provides a minimum age limit for the formation of the veins that transect the Dome. Similarly, if the microdiorite dykes intruded into the Mother Vein set of faults (Fig. 4) are equated with the Etive dykes, they provide a minimum age for the early, River and proto-Mother conjugate vein set of 418–414 Ma (Neilson et al. Reference Neilson, Kokelaar and Crowley2009).
The age and field relationships of the Lorn Plateau Lava Formation provide another indirect line of evidence for the age of the veins. The formation belongs to the Scottish Lower Old Red Sandstone magnafacies, and has given a U–Pb (zircon) age of 425±0·7 Ma from a sample near the top of the lava pile (Neilson et al. Reference Neilson, Kokelaar and Crowley2009). It consists of sub-horizontal, largely basaltic to andesitic, lavas, sills and ignimbrites, with a minimum known thickness of 800 m (Browne et al. Reference Browne, Smith and Aitken2002) and lies above, and interfingers with, the Kerrera Sandstone Formation.
South-west of the Tyndrum–Dalmally area (Fig. 16) the Lorn Lavas onlap unconformably on to the Dalradian rocks, and Treagus et al. (Reference Treagus, Pattrick and Curtis1999) concluded that the base of the lava pile W of Loch Awe (Fig. 16, location A) had been little, if at all, displaced by the Ericht–Laidon Fault. Examination of Sheet 37W (Furnace) shows that a line drawn SE across Loch Avich from the base of the lava succession between [NM 935 155] and [NM 950 139], E of the Ericht–Laidon Fault, is within 1° plunge of its equivalent position on the opposing hillside, W of the fault (i.e. the lavas are not displaced, unless the movement vector on the fault plane is precisely horizontal).
North of Tyndrum and NE of location B (Fig. 16), Hinxman et al. (Reference Hinxman, Carruthers and MacGregor1923) and Jacques & Reavy (Reference Jacques and Reavy1994) inferred that the Rannoch Monzodiorite–granite Pluton (formerly Rannoch Moor Pluton) had been affected by a sinistral strike-slip displacement of up to 7 km on the Ericht–Laidon Fault. However, the offset is difficult to confirm in poorly exposed ground where the upper surface of the granite may be undulating and gently dipping. In order to resolve this problem, Treagus (Reference Treagus1991) suggested that the major sinistral displacement on the Ericht–Laidon Fault occurred before the ∼425 Ma Lorn Lavas were laid down, and that a later transcurrent movement on this fault N of the northern tip of Loch Awe (Fig. 16) was taken up by the Pass of Brander Fault, which acted as a ring fault to the Etive Centre. The 422·5±0·5 Ma age of the Rannoch Pluton, and the 425 Ma age of the Lorn Lavas (Neilson et al. Reference Neilson, Kokelaar and Crowley2009) provide a further upper age limit for movement on the Ericht–Laidon Fault and, by association, for the age of the quartz-breccia veins.
Taking into account the inferred upthrow of ∼2 km W of the Ericht–Laidon Fault (Treagus Reference Treagus1991), the base of the Lorn Lavas in Lower ORS times was probably not more than a few kilometres above the present-day hill summits in the Tyndrum–Dalmally area. The intrusions of the Kilmelford Diorite–granodiorite complex SW of locality A (Fig. 16) probably acted as a feeder for the Lorn Lavas: they abut against, but are not cut by, the Ericht–Laidon Fault. This interpretation is supported by the Re–Os (molybdenite) age on the Kilmelford intrusions of 425·8±1·7 Ma (Conliffe et al. Reference Conliffe, Selby, Porter and Feely2010).
The constraints provided by these recent age data, indicate that the Ericht–Laidon–Tyndrum shear couple was operative for a short period between 428 Ma and 425 Ma. The age bracket is coincident with the inferred age of 428±1·9 Ma for the commencement of left-lateral movement on the related Great Glen Fault (Stewart et al. Reference Stewart, Strachan, Martin and Holdsworth2001), and is 2 Ma from being within error of the 410±14 Ma age of the Cononish Vein (Treagus et al. Reference Treagus, Pattrick and Curtis1999).
7. Source of the Si-rich fluids
The source(s) of the fluids that gave rise to most lode-gold deposits is not known for certain, and it is difficult to reconcile some of the competing hypotheses. Possible sources that have been proposed, include:
1. Regional-scale circulation of fluids originating from metamorphic dehydration reactions;
2. Fluids resulting from the crystallisation and cooling of igneous rocks, in particular those with a granitoid composition;
3. Meteoric and basinal fluids.
Craw (Reference Craw1990) and Craw & Chamberlain (Reference Craw and Chamberlain1996) proposed that metamorphic fluids were responsible for the formation of the major veins in the Tyndrum–Dalmally area, whereas Pattrick et al. (Reference Pattrick, Boyce and MacIntyre1988), Curtis et al. (Reference Curtis, Pattrick, Jenkin, Fallick, Boyce and Treagus1993) and Treagus et al. (Reference Treagus, Pattrick and Curtis1999) inferred that the fluids were, in part at least, of igneous origin. Thus, gold present in some of the quartz veins could have originated either from fluids released during crystallisation of igneous rocks, especially those linked to granite and lamprophyre intrusions, or have been scavenged from the host rocks by circulating meteoric or basinal fluids. Quantitative assessment of the source of the fluids responsible for forming the quartz veins relies upon the determination of H, O and S isotopic ratios, backed up by fluid inclusion studies, and is outwith the scope of this paper. A brief synopsis of available data and hypotheses is presented below.
7.1. Fluids of metamorphic origin
From a fluid inclusion study of an early generation of pyrite-bearing quartz veins in the Dalradian rocks between Tyndrum and the Highland Boundary Fault, Craw (Reference Craw1990) concluded that a small amount of gold found in these veins, had been deposited from fluids of metamorphic origin. Craw stated that such veins are most abundant in the vicinity of the Hjghland Border Downbend, and formed during D4, a conclusion based on his observation that the overwhelming majority of these veins were either closely associated with, or axial-planar to, D4 minor folds. Craw speculated that, as the D4 event was somewhat earlier than the formation of the Tyndrum quartz-breccia veins, some of this fluid had been stored at depth and only released during later faulting, to form the major gold-bearing veins.
Craw & Chamberlain (Reference Craw and Chamberlain1996) studied the late quartz veins in the same area, and showed by O-isotope analysis that meteoric water, whose circulation was topographically driven, played a major role in the formation of the Au-bearing veins at Tyndrum.
There are a number of factual errors in the structural observations made by Craw (Reference Craw1990), and it is argued below that these make this hypothesis untenable. Two traverses were mapped by the present author at 1:200 across the Dalradian rocks from the Highland Boundary Fault NW across the Downbend Antiform (D4) to the Flat Belt. The unpublished conclusions from this work are that, in the region SW of Crianlarich to the Highland Boundary Fault: (i) the peak of the regional metamorphism and the main development of quartz veins in these rocks occurred around D2, >470 Ma ago, and there are few examples of veins that definitely formed during D4; (ii) any metamorphic fluids generated during D4 would need to have been ‘stored’ at depth for >40 Ma if they were to contribute to the formation of the Tyndrum–Dalmally veins: and critically, (iii) at the time of generation of the giant quartz veins this hypothetical source invoked by Craw & Chamberlain (Reference Craw and Chamberlain1996) for the metamorphic fluids lay structurally above the present-day Tyndrum–Dalmally area.
Of relevance to the present work is the conclusion of Craw & Chamberlain (Reference Craw and Chamberlain1996) that Au in the early, pyrite-bearing quartz veins had been scavenged from the country rock, and precipitated by reaction with meteoric fluid.
7.2. Fluids of igneous origin
The hypothesis that the fluids responsible for the development of the quartz-breccia dykes were derived from an underlying magmatic source, probably an easterly extension of the Etive ‘Granite’, was proposed by Curtis et al. (Reference Curtis, Pattrick, Jenkin, Fallick, Boyce and Treagus1993) from H and O, and to a lesser extent S, isotopic data. This hypothesis was supported largely by circumstantial evidence, such as a negative gravity anomaly north of the area in the vicinity of the Bridge of Orchy that may be related to this hypothetical buried intrusion (Curtis et al. Reference Curtis, Pattrick, Jenkin, Fallick, Boyce and Treagus1993).
The strongest support for this hypothesis comes from the timing of the structural and magmatic events in the area, as summarised in Table 2 and section 6. Specifically, that fluids of magmatic origin, linked to the lamprophyric or granitic intrusions, could be available from a buried source in the Tyndrum–Dalmally area over the same time range, 430–415 Ma, in which the quartz-breccia dykes were thought to have formed.
7.3. Depth of emplacement
Fluid inclusion studies on quartz from Au-bearing veins at Tyndrum (Halliday's Vein; Pattrick et al. Reference Pattrick, Boyce and MacIntyre1988) and at Cononish (Cononish Vein; Curtis et al. Reference Curtis, Pattrick, Jenkin, Fallick, Boyce and Treagus1993) showed that the veins were emplaced at a shallow depth in the Earth's crust of around 3–4 km. This agrees well with the conclusions of Hamidullah (Reference Hamidullah2007) who calculated first, that lamprophyre-appinite members of the Argyll–Northern Highlands Subsuite correlated with those in the Tyndrum–Dalmally area, crystallised under ∼1 kb fluid pressure and, secondly, that the associated explosion breccia pipes probably reached the (then) surface (as shown in cartoon form on Fig. 17).
A two-part model (A and B) for the origin and development of quartz-breccia veins of Lower Devonian age in the Tyndrum–Dalmally area. The Si-rich fluid that gave rise to these bodies is inferred to be of igneous origin, but the possibility of a meteoric or ‘mixed’ origin is not totally discounted. A–D and box marked X are referred to in the text.

A line drawn from the base of the lava pile east of Loch Avich to the summit of Ben Lui, (the highest peak in the area (1130 m), 4 km SW of Cononish), along which the Dalradian rocks are not affected by any major faults, plunges at 1·6°SW. Thus, the base of the lava pile when it was laid down could have been almost horizontal across the whole of the Tyndrum–Dalmally area, and was probably not far above the present-day hill summits in that area. However, fluid inclusion studies (e.g. Curtis et al. Reference Curtis, Pattrick, Jenkin, Fallick, Boyce and Treagus1993) show that the cover above Cononish was ∼4 km thick. When this is taken into account, the required apparent dip along the above line increases to 7°, as shown in Figure 17.
8. Discussion
According to the new structural data for the Tyndrum–Dalmally area presented here, the Orchy Dome and the sets of P, R, R′ and T fractures developed under the same kinematic regime, within a geologically short period of time. A possible alternative model is one in which the Orchy Dome formed independently of the other structures and was later cut by several generations of kinematically unrelated faults, that formed whilst the Dalradian basement was being eroded and uplifted. This alternative is rendered unlikely by the temporal links between the emplacement of the lamprophyre suite and the formation of the Dome, and between this igneous event and the faulting.
The most striking feature of the Tyndrum–Dalmally area is the array of major faults marked by giant quartz-breccia veins that display, with surprising precision, the conjugate geometry predicted by the (modified) Coulomb model for brittle failure in rocks. This is unexpected, as major Riedel shear fractures (R, R′), and extensional T fractures, are seldom preserved in their initial configuration, either in model experiments or in the field. The reason for this is that typically they form in a dynamic setting, undergo rotation due to further shearing and, in some instances, are overprinted by new sets of fractures. The result is an almost indecipherable network of fractures.
The original fault geometry is preserved in the study area for two reasons. First, only a small amount of shortening has affected the Tyndrum–Dalmally compartment. The formation of the Orchy Dome, which has an inter-limb angle >140°, required <26% N–S shortening, and the major faults show only a small displacements. Secondly, crystallisation of massive bodies of quartz along the Riedel shears, early in their development, dramatically halted further movement by sealing individual faults and bonding the hangingwall to the footwall.
The reason for the change from simple shear to dilation across the embryonic major Riedel shears is not known, but it was probably due to a relaxation of the regional maximum principal stress, σ1, coupled with the injection of a highly pressurised fluid into the fractures, and changes in σ2 and σ3 with progressive uplift and erosion of the Dalradian cover.
No evidence has been found that simple shear occurred on the major faults before they were dilated, and plugged by quartz veins. Any fabrics developed at this time would be difficult to separate from those formed by late shearing along the margin of the major quartz veins, or would be overprinted by them, as is the case with the western side of the Mother Vein (Fig. 7D). Future study of the fabrics in the country rock fragments in the extensively silicified ‘cores’ of these faults may, however, provide such evidence.
It is envisaged that, prior to invasion by hot, Si-rich fluids, each major fault was a fully developed structure with a central core of fault breccia, flanked on either side by a ‘damage zone’ (i.e. see Caine et al. Reference Caine, Evans and Forster1996) (Fig. 15). Hydraulic pumping (Sibson Reference Sibson, Knipe and Rutter1990) was almost certainly responsible (see section 4) for the development of the numerous 1–5 cm-thick crack-fill veins, which constitute the giant quartz breccias in the study area. The criteria that must be met for this mechanism to function (Sibson Reference Sibson, Knipe and Rutter1990), are all satisfied. They include the stipulation that there should be no pre-existing cohesionless faults present that are favourably orientated for re-activation to occur before new faults can develop in the intact rock mass. All of the faults in the study area fulfill this criterion, being the first generation of fractures to develop in rocks previously made mechanically coherent by ductile deformation and metamorphism during the Grampian orogeny.
Regarding the internal structure of the veins, a model experiment designed to illustrate the formation of a hydrofracture (extensional joint) (Davis & Reynolds Reference Davis and Reynolds1996, pp. 247–249) provides an excellent illustration of how an individual open-space vein may develop by the injection of slurry with elevated fluid pressure into a homogeneous medium. On a larger scale, Haney et al. (Reference Haney, Snieder, Sheiman and Losh2005), working in the Gulf of Mexico, used seismic reflection imaging to show how fluid moves up a fault plane in a series of discrete pulses. They identified a pulse of fluid approximately 600 m high by 200 m wide that had moved up a fault plane at about 140 m per year (in contrast to Bons' (Reference Bons2001) estimate of 10 km in three hours). This single pulse is comparable in width with the horizontal extent of individual quartz breccia segments in the Coire Daimh and Mother veins (Fig. 7).
A further alternative is that these segments were of mechanical origin, due to abrasion of an initially irregular fault surface by a later strike-slip displacement, to form elongated voids filled with fault breccia that could have later provided a pathway for mineralising fluids (Park & McDiaraid Reference Park and MacDiarmid1975). However, none of these mechanisms explain the regular, systematic, ordering of quartz-breccia segments.
In the previous study (Tanner & Thomas Reference Tanner and Thomas2010), it was noted that the Orchy Dome largely controlled the distribution of the minor lamprophyre intrusions and explosion-breccia pipes. The occurrence of phlogopite-, hornblende-, and augite-bearing picrites in the Glen Orchy Ultramafic Complex, a related intrusive body on the NW side of Glen Orchy at [NN 2362 3325] (Fig. 5, loc. A) (Kynaston & Hill Reference Kynaston and Hill1908), is significant, as it indicates that at least part the lamprophyre suite was derived by partial melting of mantle lithosphere at a depth of ∼100 km (Atherton & Ghani Reference Atherton and Ghani2002). This conclusion is supported by the recent finding of Platinum Group minerals, indicative of a mantle source, in the Glen Orchy Complex (D. Catterall pers. comm. 2012); in the Sron Garbh Appinite Complex (Scotgold 2012); and in low, but anomalous, amounts in the explosion breccia pipes on Beinn Udlaidh (Fig. 4) (Scotgold 2012). The Sron Garbh body closely resembles a small appinite complex found at Talnotry in the Southern Uplands of Scotland, which has been ascribed a possible mantle provenance on the basis of its content of Platinum Group minerals (Power et al. Reference Power, Pirrie, Jedwab and Stanley2004). As the lamprophyre suite is virtually coeval with the formation of the giant quartz veins, this raises the possibility that mantle-derived fluids contributed to the formation of the veins.
The origin of the fluids responsible for the mineralisation remains to be resolved, but the structural setting and possible mechanism of emplacement of the quartz-breccia bodies are now clearly defined. The future aim should be to quantify, by means of fluid inclusion and stable isotope analysis, the physical conditions such as temperature and lithostatic pressure under which the various sets of veins formed. Due regard should be taken of the fact that the present-day topographic relief is a sizeable (0·8 km) proportion of the total cover at that time (4 km), and that it may be difficult to interpret the fluid inclusion data because of the effects of the fluid-pumping mechanism in causing large fluctuations in pore fluid pressure and temperature in a single open-space vein. U–Pb (zircon) radiometric dating of the main appinite bodies would give a good indication of both the age of the Dome and of the faulting. An upper age limit for the formation of the veins would be given by dating the suite of microdiorite dykes.
9. Conclusions
Towards the end of the (∼470 Ma) Grampian orogeny, Dalradian rocks of Neoproterozoic–Ordovician age in the Grampian Highlands of Scotland were intruded by numerous plutons of the Scottish Highlands Silurian Suite (‘Newer Granites’). The previously deformed (D1–D4) and regionally metamorphosed Dalradian rocks were dissected into a series of parallel, NE- trending compartments, 10–15 km across, by major left-lateral transcurrent faults, including the Great Glen Fault.
The Tyndrum–Dalmally area is located within the Dalmally compartment, between the Ericht–Laidon and Tyndrum faults (Fig. 16). According to the model proposed here, a regional-scale structure, the Orchy Dome, formed from flat-lying Dalradian rocks in response to the shear couple generated by sinistral displacements on this pair of faults (Fig. 15). Members of the Argyll–Northern Highlands Subsuite, notably appinitic and lamprophyric sills and dykes, hypabyssal intrusions and explosion breccia pipes, were emplaced into the Dalradian rocks, synchronous with or following the formation of the Orchy Dome (Tanner & Thomas Reference Tanner and Thomas2010).
Several sets of faults, mainly in conjugate pairs, then cut the Dome, some at least being contemporaneous with the emplacement of the lamprophyre suite. Si-rich fluids were then injected into the core and damage zones of the embryonic major fractures, at an early stage in their development. This fluid was at a higher hydrostatic pressure than the pore fluid in the country rock, leading to the opening up of pre-existing fractures in the damage zone, accompanied by hydraulic fracturing, and the development of vuggy quartz veins, with cockade and crustiform textures. Breccia fragments in the core of the fault zone were buoyed up by this fluid and became encased in sheets of outward-facing, radiating, prismatic crystals of quartz, up to a few cm in length.
Although the initial effect of this process was to facilitate movement on the fault, the accretion of thick webs of open-space quartz veins at a higher level in the crust, due mainly to cooling of the fluid, inhibited further movement and caused the faults to lock-up before they had achieved a significant displacement. Pore fluid pressure then built up again, the seal was fractured and the process of fault-valve pumping (Sibson et al. Reference Sibson, Robert and Poulsen1988) was repeated. The giant quartz-breccia veins, which resulted from the multiple crack-fill events of this type, are up to 19 m thick, several km long, and consist of a series of in-line, dyke-like segments within each fault zone.
The following sequence of structural events occurred (see also Table 2), based on field relationships and geometry:
1. The near-vertical Cononish Vein set (trend 041°) developed along P-shears parallel to the Tyndrum Fault, transecting the Dome and hosting economic Au–Ag mineral deposits (including Cononish gold mine).
2. The River Vein set (∼030°) formed at 75° to the Cononish Vein set, to form a conjugate pair with the proto-Mother Vein set.
3. A near-vertical pair of conjugate Riedel fractures, the NNE-trending Mother Vein (027°) and the NNW-trending Barren Vein (161°) developed, together with a group of tensional T fractures trending N–S.
These pairs of major fractures have a geometry compatible with that predicted by the Coulomb model for brittle failure in rocks, as modified by Sibson (Reference Sibson2000) to allow for the effect of elevated pore fluid pressure in reducing the predicted angle between the conjugate pairs from 60° to 54° (Fig. 15). The calculated σ1 direction is precisely parallel to that required to form the Orchy Dome (trend 087°), suggesting strongly that the folding and fracturing are part of a single continuous kinematic sequence. The system was driven by regional transcurrent faulting, with the putative hidden granite body providing heat, fluid and, if it was still rising, the force to uplift the Dalradian basement.
Such a concentration of fault-related quartz breccias within a small area is unique in the British Isles. These giant, km-scale veins differ from others that have been reported worldwide in that they are not linked to terrane boundaries (Kerrich & Feng Reference Kerrich and Feng1992), nor do they form giant quartz gashes, sourced from metamorphic fluids in major shear zones (Hippertt & Massucatto Reference Hippertt and Massucatto1998: Jia & Kerrich Reference Jia and Kerrich2000; Lemarchand et al. Reference Lemarchand, Boulvais, Gaboriau, Boiron, Tartèse, Cokkinos, Bonnet and Jégouzo2012).
The timing of the quartz-breccia-related faulting, which was broadly synchronous with the emplacement of sills and irregularly-shaped bodies of lamprophyre, is fairly well constrained due to new high-precision U–Pb (zircon) and Re–Os (molybdenite) radiometric ages of plutons and lavas in the region around Tyndrum. They define a very narrow age range of 428–425 Ma for left-lateral displacement on the bounding faults, and hence for the formation of the major quartz-breccia veins (Table 2).
It was concluded earlier that fluid arising from the crystallisation of an extension of the Lochaber Batholith, lying at a shallow depth beneath the area, was probably primarily responsible for the formation of the quartz-breccia veins. The lower part (A) of Figure 17 is a vertical E–W cross-section through the Tyndrum–Dalmally area, showing a hypothetical reconstruction of the geology between 430 Ma and 425 Ma ago, when silica-rich fluids originating from the crystallisation of a putative underlying intrusion(s) mingled with meteoric fluids, and possibly regional metamorphic and mantle-derived fluids, and were channeled into steeply dipping Riedel fractures, resulting in the formation of quartz-breccia veins at the present level of erosion.
According to published fluid inclusion data, the major veins formed at a depth of some 4 km beneath the contemporaneous ground surface. By this time, the Dalradian rocks had been uplifted and eroded, and explosion breccia pipes emanating from lamprophyric intrusions would have reached the Dalradian erosion surface (A). A few of them were later cut and displaced by the conjugate faults (B), possibly allowing some of the Au-bearing fluid supplying the quartz-breccia bodies to escape up the truncated pipes and yield the anomalous Au assay values in the explosion breccias, as in a comparable example from Arizona (Barrington & Kerr Reference Barrington and Kerr1961). The pipes may have also functioned as escape valves, to enable the pump-valve model of Sibson (Reference Sibson, Knipe and Rutter1990) to operate.
The upper part (B) of Figure 17 depicts the situation immediately following deposition of the Lorn Lavas in Lower Devonian times, ∼425 Ma ago. The Dalradian rocks were onlapped by the Lower ORS sequence, and cut by the Etive Granite. However, as the main transcurrent movement on the Ericht–Laidon Fault predates the Lorn Lavas, a possible extension of this fault from D upwards to cut the Lower Devonian rocks is due to fault rejuvenation, as are the faults shown in box X (Fig. 17), with their hypothetical relationship to a Rhynie Chert-type mineral deposit, as suggested by Rice et al. (Reference Rice, Trewin and Anderson2002). An actual link between the Cononish veins and the Rhynie Chert appears to be ruled out by the much younger age of the latter (U–Pb (zircon): 411·5±1·3 Ma; Parry et al. Reference Parry, Noble, Crowley and Wellman2011) and its inferred link to a local andesitic source.
There is a growing body of evidence to support the hypothesis that much of the mineralisation in the Western Highlands is linked to late Caledonian magmatism. This conclusion does not preclude a contribution from meteoric or metamorphic fluids and, indeed, their interaction with magmatic fluids, including some from the mantle, may prove to be essential in the formation of such lode-gold deposits.
10. Acknowledgements
Many thanks to Judith Tanner for unswerving support and assistance; Mike Shand for draughting most of the Figures; and David Catterall (Farscape Exploration), Chris Sangster and Jeff Smith (both of Scotgold Resources) for many informative discussions, and for making their data freely available. Thanks also to Mark Cooper, Jack Treagus and Richard Pattrick for helpful comments on the manuscript, and to EESTRSE referees, Graham Leslie and John Mendum, for incisive and constructive comments that prompted a significant improvement in both presentation and interpretation. I am grateful to the Burton family of Cononish Glen for allowing me access. BGS Grant No. GA/99E/16 covered some of my field expenses; the Leverhulme Trust helped with draughting costs; and Scotgold Resources Ltd covered the cost of the colour printing.
With sadness, I would like to acknowledge the contribution made by Peter Thomas, who died in 2011, towards our understanding of the structural geometry of the Dalradian rocks, a vital basis for the present study.