Introduction
Energy evaluation systems for cattle all rely on estimates of animals’ net energy (NE) requirements for maintenance and production. The amount of energy that cattle obtain from feed is determined, at least initially, in terms of metabolisable energy (ME). Some systems translate the ME supplied by feed into some form of NE supply such as VEM (van Es, Reference Van Es1978), UFL (Institut National de la Recherche Agronomique (INRA), 1989) or NEL (National Research Council (NRC), 2001), while other systems (Commonwealth Scientific and Industrial Research Organisation (CSIRO), 1990; Agricultural and Food Research Council (AFRC), 1993) translate requirements for NE into ME requirements (MER). For this translation, most systems rely on estimates of the efficiency of ME utilisation for maintenance (k m), for lactation (k l) and for gain (k g).
Previous respiration experiments have shown that k m, k l and k g are dependent on feed quality (Agricultural Research Council (ARC), 1980) and this dependency is part of all energy evaluation systems mentioned above. Feed quality may be quantified by the amount of ME that a kg of feed supplies (e.g. NRC, 2001) or by feed metabolisability q, i.e. ME supplied divided by the gross energy content of the feed (e.g. van Es, Reference Van Es1978; INRA, 1989; CSIRO, 1990; AFRC, 1993), sometimes specified per feed type (ARC, 1980).
Tolkamp and Ketelaars (Reference Tolkamp and Ketelaars1994) (T&K) proposed an energy evaluation system for lactating as well as non-lactating cattle that are fed (near) ad libitum, which is much simpler than any of the systems mentioned above. They accepted that, for a given feed, the partial efficiency of ME utilisation will differ between maintenance, growth and lactation. They also accepted that, measured at the same ME intake level, the efficiency of ME utilisation will be affected by feed quality. They proposed, nevertheless, their system by defending the hypotheses that in ad libitum-fed cattle the overall efficiency of ME utilisation, i.e. total NE intake divided by total ME intake (i) is similar in lactating and non-lactating cattle that maintain weight, grow or lose weight and (ii) is similar for cattle consuming feeds of different quality. T&K proposed using a single parameter, k = 0.6, for the efficiency of ME utilisation in ad libitum-fed cattle. This is in sharp contrast with the many parameters that other systems require to express the effects of animal and feed characteristics on the efficiency of ME utilisation.
This may well seem a simplification too far, at least at first sight. However, the Feed into Milk project (FiM; Agnew et al., Reference Agnew, Yan, France, Kebreab and Thomas2004) reported the analysis of a large number of more recent respiration experiments with dairy cows. In this data set, no significant effect of feed quality on the relationship between the amount of NE in milk and ME intake could be established (Agnew et al., Reference Agnew, Yan, France, Kebreab and Thomas2004). Because dairy cows are usually fed (near) ad libitum, this observation is in agreement with T&K’s second hypothesis. On the basis of its analyses, FiM proposed a new applied energy evaluation system for dairy cows that is now being used in the UK dairy industry. Although in this system feed quality has virtually no effect on ME requirements, FiM still requires nine parameters for the translation of NE requirements into MER.
In the absence of information on feed quality and voluntary feed intake, the effects of milk yield (MY), body weight (W) and body weight change (ΔW) on MER, predicted by either T&K or FiM, cannot be compared directly with predictions by other energy evaluation systems. A comparison between T&K and FiM is, however, feasible without such information. The first aim of our study is to compare the underlying rules and assumptions of the two systems, also in view of other existing systems. In addition, we analyse the specific effects of the parameters that are used and discuss the differences between the two systems in MER predictions and their biological justification. The analysis is intended to contribute to the design of an improved practical energy evaluation system for dairy cows.
Material and methods
Estimates for NE requirements
The FiM and T&K systems both rely on NE requirements based on W, ΔW and MY as inputs but they use different methods to translate requirements for NE into MER.
NE content of milk and live weight change
FiM uses AFRC (1993) estimates for the NE content of a kg of ΔW (19.3 MJ) and for the NE content of milk (we assumed NEmilk = 3 MJ/kg). These parameters were used for MER predictions by FiM as well as T&K to facilitate comparison.
NE requirements for maintenance
The NE requirements for maintenance (NEm) consist of two components in FiM. Fasting heat production (FHP), including part of the activity allowance, is estimated at 0.453 × W 3/4 (MJ/d). The NEm associated with the horizontal component of the activity allowance is estimated as 0.0013 × W (MJ/d). This increases the total NEm estimates per unit metabolic size but these values remain almost independent of W (Table 1). NEm requirements in T&K were derived from ARC (1980), with FHP = 0.53 × (W/1.08)0.67 (MJ/d) and an activity allowance of 0.0043 × W (MJ/d), which were added and expressed per unit metabolic size. This estimate varied with W between 0.319 and 0.329 (Table 1) and a rounded mean value of 0.325 × W 3/4 (MJ/d) was used for simplicity.
Estimates of the fasting heat production (FHP), activity allowance and total net energy requirements for maintenance (NEm) according to Feed into Milk (FiM) and Agricultural Research Council (ARC) (1980), all expressed in MJ/W 3/4 d, in relation to cow body weight (W, kg)

Translating requirements for NE into ME requirements
The FiM system: FiM calculates NE output in milk (NEl) from MY and NEmilk and this value is expressed per unit metabolic size to predict MER/W 3/4. For cows that lose weight, milk NE output is corrected with 19.3 × ΔW × 0.78 before scaling with metabolic size. The parameter k mob = 0.78 in this calculation is the estimated efficiency with which NE mobilised from the body is utilised for NE in milk. Subsequently, the MER for maintenance and lactation is calculated as MERml = (loge((5.06 − NEl)/(5.06 + 0.453)))/−0.1326 (MJ/W 3/4 d). In this equation, parameter NEm = 0.453 is fixed (second column in Table 1). The values of 5.06 and −0.1326 were obtained after fitting a Mitscherlich model to describe the relationship between NEl and ME intake as observed in a data set. The model was constrained by MER for maintenance fixed at 0.647 × W 3/4 (MJ/d), which corresponds to an efficiency of ME utilisation for NEm of k m = 0.453/0.647 = 0.7. Then a check on overall efficiency of use of ME for lactation is provided by calculating k l = NEl/(MERml−0.647). If k l is lower than 0.59, the previous MER estimate is replaced with MERml = NEl/0.59 + 0.647 (MJ/W 3/4 d). MERml is then multiplied by W 3/4 and MER for horizontal activity is added as (0.0013 × W)/k m (MJ/d). Parameter k m is estimated from the ME yield per kg DM of the used ration (M/D) measured with sheep fed at maintenance level, by k m = 0.019 × M/D + 0.503 (from ARC, 1980). For feeds with M/D increasing from 8 to 13 MJ/kg, this results in an increase in k m for locomotion from 0.655 to 0.750. The associated increase in efficiency of ME utilisation for maintenance is much smaller, however, from 0.6993 to 0.7007. This increase in k m results in a decrease in total MER for maintenance for a cow with W = 600 kg from 79.63 to 79.48 MJ/d. This compares with 79.55 MJ/d, which applies at k m = 0.7 and this estimate of k m was used here for all FiM predictions of MER. For cows that gain weight, the MER for gain is calculated as (ΔW × 19.3)/k g (MJ/d) with k g = 0.65. Total MER are the sum of ME requirements for maintenance and lactation, weight gain and horizontal activity. Finally, 10 MJ/d is subtracted from the predicted MER to correct for an overall difference of 9.6 MJ/d between observations and predictions of the original FiM model (Agnew et al., Reference Agnew, Yan, France, Kebreab and Thomas2004).
The T&K system: To predict requirements of ad libitum-fed cows, a single efficiency of ME utilisation (k = 0.6) is used: MER = (0.325 × W 3/4 + 3 × MY + 19.3 × ΔW)/0.6, or, for cows losing weight, MER = (0.325 × W 3/4 + 3 × MY + 0.84 × 19.3 × ΔW)/0.6, with k mob = 0.84.
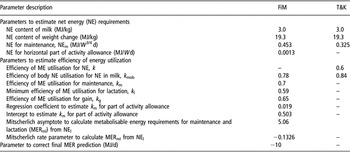
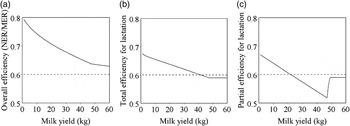
Summary of used parameters and their consequences for energetic efficiency: The systems share two parameter values and require an additional 11 (FiM) and three (T&K) parameters to predict the MER of dairy cows (Table 2). Figure 1 shows the (explicit and implicit) effects of FiM and T&K rules on overall energetic efficiency (NE requirements divided by MER), the total energetic efficiency for lactation (k l) and the partial energetic efficiency for lactation (the efficiency with which ME is utilised to produce the NE in the last kg of milk) in relation to MY.
Parameters, their description and the values that were used to predict metabolisable energy (ME) requirements of dairy cows according to the Feed into Milk (FiM) and Tolkamp & Ketelaars (T&K) systems

The overall energetic efficiency, i.e. total NE requirements (NER) divided by ME requirements (MER) (a), the total energetic efficiency of ME utilisation for lactation k l (b) and the partial energetic efficiency of ME utilisation for lactation (c) in relation to milk yield according to FiM (solid line) and T&K (broken line) for cows with W = 600 kg and ΔW = 0.

Comparing predictions of ME requirements by the two systems
We compared the predicted MER for ad libitum-fed cows with W between 450 and 750 kg, MY between 5 and 60 kg/d and ΔW of 0, +0.5 or −0.5 kg/d.
Results
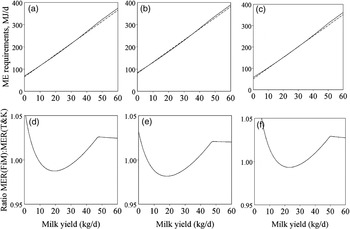
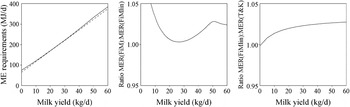
Figure 2a shows the MER in relation to MY as predicted by FiM and T&K for a cow with W = 600 kg and ΔW = 0. MER predictions by FiM were between 2.1 MJ/d lower (at MY = 22 kg/d) to 9.0 MJ/d higher (at MY = 60 kg/d) than those by T&K. The mean difference between the two systems (Figure 2d) for MY between 5 and 60 kg/d was +0.6% (s.d. = 1.5; range: −1.2 to +2.6). FiM predictions of MER are slightly higher than T&K predictions at a very low and high MY but are more similar or slightly lower in between.
Predicted metabolisable energy requirements (MER) (a–c) according to Feed into Milk (FiM) (solid line) and Tolkamp & Ketelaars (T&K) (broken line) and the ratio of MER as predicted by FiM and T&K (d–f). Requirements and ratios were calculated for cows with W = 600 and with ΔW = 0 kg/d (a and d), ΔW = +0.5 kg/d (b and e) or ΔW = −0.5 kg/d (c and f).

Figure 2b and e present the results for a cow with a daily weight gain of 0.5 kg. MER requirements for gain are slightly higher (+1.25 MJ/d) in T&K than in FiM. For MY between 5 and 30 kg, the absolute differences in MER predictions between the FiM and T&K systems ranged from −3.3 MJ/d (MY = 23 kg/d) to +0.2 MJ/d (MY = 5 kg/d). The mean difference between the two systems in this MY range was −1.3% (s.d. = 0.8; range: −1.8 to +0.2). FiM predictions of MER are slightly higher than T&K predictions at very low and very high MY but are more similar or slightly lower at intermediate MY.
Figure 2c and f show the results for a cow with a weight loss of 0.5 kg/d. For MY between 15 and 60 kg, the absolute differences in MER predictions between the FiM and T&K systems ranged from −1.1 MJ/d (MY = 24 kg/d) to +9.7 MJ/d (MY = 60 kg/d). The mean difference between the two systems was +1.0% (s.d. = 1.4; range: −0.7 to +2.8). A weight loss of 0.5 kg always reduces MER by 13.5 MJ/d in T&K. In FiM, however, the reduction first increases with MY from 12.0 MJ/d (for MY = 15 kg/d) to14.4 MJ/d (for MY around 49 kg/d) and is then constant at 12.8 MJ/d for MY > 50 kg/d.
The calculations that produced the graphs in Figure 2 were also carried out for cows with a range in W from 450 to 750 kg. The resulting graphs, however, had a very similar pattern to those presented in Figure 2d–f and they are, therefore, not reproduced here. For smaller cows, the ratio curves shifted to the right (i.e. similar curves applied at slightly lower MY) and for larger cows the opposite happened. In addition, ratio curves for small and large cows were slightly lower (around −0.01) and higher (around +0.01) compared to curves in Figure 2 for cows weighing 450 and 750 kg, respectively.
Discussion
Tolkamp and Ketelaars (Reference Tolkamp and Ketelaars1994) combined ARC (1980) predictions about effects of feed quality on feed intake with ARC (1980) predictions about the effects of feed quality on the efficiency of ME utilisation. They concluded that the overall efficiency of ME utilisation (i.e. total NE intake divided by total ME intake) was similar in ad libitum-fed lactating and non-lactating cattle and that this efficiency was unaffected by feed quality. They argued that, because cattle are generally fed (near) ad libitum, this could lead to a much simplified energy evaluation system that would require only a single parameter, k = 0.6, for efficiency of ME utilisation. FiM argued that there was a need to update and modify the AFRC (1993) system on the basis of data that were more representative of modern diets and dairy cows. In particular, they argued that existing systems severely underestimated the maintenance energy requirements of the high genetic merit dairy cow (Agnew et al., Reference Agnew, Yan, France, Kebreab and Thomas2004).
Both the T&K and the FiM system have been proposed as energy evaluation systems for use in livestock practice. Both systems deviate from other systems in the sense that feed quality is not considered to really affect the MER of dairy cows. We first discuss this difference between FiM and T&K and the other systems and its possible justification. Subsequently, we discuss the differences between the T&K and FiM systems. We analyse the contribution of each parameter, and their underlying assumptions, to the MER predictions. Finally, we discuss the differences in MER predictions between the two systems and possible adaptations that would make them more suitable for predicting the MER of dairy cows in practice.
Effects of feed quality and animal status on the efficiency of ME utilisation
MER predictions by FiM are independent of feed quality with the exception of the MER associated with a small component of the activity allowance. Table 1 shows that according to FiM estimates, the NEm associated with this component is less than 2% of total NEm. FiM provided no (biological, statistical or other) arguments for the assumption that the efficiency of ME utilisation for this component must differ from the efficiency that is used for the remainder (i.e. more than 98%) of total maintenance energy requirements. Our analysis shows that the use of a variable instead of a constant k m = 0.7 for this component has trivial effects on k m (mean 0.7, maximum range between 0.6993 and 0.7007) and on MER for the animal as a whole. As a result, efficiency of ME utilisation is essentially independent of feed quality in FiM. Although this contrasts sharply with the energy evaluation systems used in most countries, the possible causes of this discrepancy are not discussed in FiM.
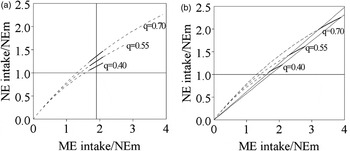
The efficiency of ME utilisation is also independent of feed quality in T&K. In addition, a single efficiency parameter, k = 0.6, is used for the overall efficiency of ME utilisation, i.e. for the NE required for maintenance, lactation and/or gain combined. Tolkamp and Ketelaars (Reference Tolkamp and Ketelaars1994) accepted, with other energy evaluation systems for ruminants, that there is no doubt that ME of a given feed is utilised for maintenance with a higher efficiency than for production. They also accepted, again in agreement with other energy evaluation systems, that cattle utilise the ME of high-quality feeds with higher efficiencies for maintenance and for production than the ME of low-quality feeds when compared at the same ME intake. Nevertheless, cows with ad libitum access to any of these feeds are estimated by T&K to have a similar overall efficiency of ME utilisation, i.e. k = 0.6. The principle behind this reasoning is demonstrated in Figure 3. The NE intake at the same ME intake increases from low- to medium- to high-quality feed (Figure 3a) because ME of high-quality feed is utilised with a higher efficiency for both maintenance and production than the ME of lower quality feeds (e.g. ARC, 1980). Such a comparison can only be carried out at low levels of ME intake, because animals do not consume large amounts of ME from low-quality feeds. However, if the overall efficiency of ME utilisation for the same feeds is compared at ad libitum intake, the overall efficiency of ME utilisation is expected to be affected very little by feed quality (Figure 3b). Figure 3 is based on ARC (1980) curvilinear relationships between NE and ME intake. However, when constant values for k m and k l are used, which results in straight lines in the form of ‘broken sticks’ to describe these relationships, the same principle applies. Despite the accepted effects of feed quality on the efficiencies of ME utilisation for maintenance, gain and lactation, the overall efficiency of ME utilisation is, therefore, not affected by feed quality in T&K as long as cattle are fed ad libitum. Cattle almost invariably have free access to at least one feed on farm, be it a mixed ration or forage. This proviso in the T&K system will then be met in practice.
Effects of metabolisable energy intake (MEI) on net energy intake (NEI) (both scaled with NEm) for feeds with metabolisabilities of 0.40, 0.55 and 0.70 according to B and p values in ARC (1980); graph (a) shows how NEI varies, if compared at MEI = 1.9, with feed quality from around 1.14 to 1.41, corresponding with overall energetic efficiencies (i.e. NEI/MEI) of 0.6 to 0.74; graph (b) shows that the overall energetic efficiency is expected to vary very little when measured with ad libitum-fed animals (see Tolkamp and Ketelaars, Reference Tolkamp and Ketelaars1994); the two straight lines through the origin in graph (b) represent overall energetic efficiencies of 0.58 and 0.62.

Although the experimental data that were analysed by FiM have not been fully published, they are essentially the same as those analysed by Kebreab et al. (Reference Kebreab, France, Agnew, Yan, Dhanoa, Dijkstra, Beever and Reynolds2003) and the references in that paper show that the cows producing these data were generally fed ad libitum (e.g. Cushnahan et al., Reference Cushnahan, Mayne and Unsworth1995; Gordon et al., Reference Gordon, Patterson, Yan, Porter, Mayne and Unsworth1995 and Reference Gordon, Patterson, Porter and Unsworth2000; Yan et al., Reference Yan, Patterson, Gordon and Porter1996 and Reference Yan, Gordon, Agnew, Porter and Patterson1997; Beever et al., Reference Beever, Cammell, Sutton, Rowe and Perrott1998; Sutton et al., Reference Sutton, Cammell, Beever, Humphries and Phipps1998 and Reference Sutton, Phipps, Cammell and Humphries2001). Agnew et al. (Reference Agnew, Yan, France, Kebreab and Thomas2004) concluded that the relationship between NEl and ME intake was not significantly affected by feed quality. This finding, based on recent data, is consistent with the T&K conclusion based on analysis of much older data. This conclusion, although it differs from assumptions underlying other systems, would allow for a considerable simplification of energy evaluation systems for cattle. It could, at the same time, avoid the errors that are associated with existing systems that ignore effects of diet type on energetic efficiency, especially for non-lactating cattle (Tolkamp and Ketelaars, Reference Tolkamp and Ketelaars1994).
Differences between FiM and T&K
FiM and T&K differ in the manner in which NE requirements are estimated as well as in the way energetic efficiency is quantified.
Parameters related to NE requirements in FiM and T&K
Parameters suggested by FiM for the NE content of milk and ΔW were used throughout and these were not, therefore, the cause of any differences in MER predictions between the systems. Although NE requirements for activity are likely related to W rather than to W 3/4, a single NEm parameter was used in T&K because this has only minor effects on total NEm estimates (Table 1). The NE estimate for activity used in T&K was based on ARC (1980), which is lower than a more recent estimate (AFRC, 1993). Incorporation of the latter into T&K would increase the NEm parameter from 0.325 to around 0.35 MJ/W 3/4 d, and this might well be more appropriate.
Table 1 shows that expressing NEm in a single parameter would have only minor effects on MER predictions by FiM and this would reduce parameter requirements by three (see below). The FiM estimates of NEm are much higher (by around 40%; Yan et al., Reference Yan, Gordon, Agnew, Porter and Patterson1997; Kebreab et al., Reference Kebreab, France, Agnew, Yan, Dhanoa, Dijkstra, Beever and Reynolds2003; Agnew et al., Reference Agnew, Yan, France, Kebreab and Thomas2004) than those used in earlier systems (van Es, Reference Van Es1978; INRA, 1989; CSIRO, 1990; AFRC, 1993; NRC, 2001), including T&K. The latter estimates are based on a large body of experimental work over several decades from laboratories in many countries, including the UK. Within the FiM data set, large unexplained discrepancies in estimated maintenance energy requirements exist between laboratories that are apparently using the same methodology (e.g. Yan et al., Reference Yan, Gordon, Agnew, Porter and Patterson1997; Kebreab et al., Reference Kebreab, France, Agnew, Yan, Dhanoa, Dijkstra, Beever and Reynolds2003; Agnew et al., Reference Agnew, Yan, France, Kebreab and Thomas2004). Until these discrepancies are understood and these estimates are confirmed, some scepticism with regard to the high value for NEm in FiM seems justified (see also below).
Parameters related to the efficiency of energy utilisation
Parameter k in T&K: A single parameter is used for the efficiency of ME utilisation in cattle that are fed (near) ad libitum. The T&K value for k (0.6) is very similar to the estimate that FiM obtained after linear regression of NEl on ME intake (k l = 0.59; Agnew et al., Reference Agnew, Yan, France, Kebreab and Thomas2004).
Parameters to estimate km from the feed M/D ratio in FiM: As shown, these parameters have trivial effects on MER and would not be required at all if a single NEm estimate were used.
Parameters for efficiency of ME utilisation for lactation and maintenance in FiM: FiM relies on two parameters (5.06 and −0.1326) that were obtained after fitting a curvilinear relationship between NEl (corrected for ΔW<0) and ME intake (corrected for ΔW > 0). The model was constrained to MEm = 0.647 × W 3/4 (MJ/d), which relies on the additional parameter k m = 0.7. Correction with an activity allowance first increases, but then a final correction with the parameter −10 MJ/d decreases, the effective MEm. In addition, the predicted MER for high-yielding cows is corrected by abandoning the original prediction and replacing it with the prediction of a linear model, similar to that used in T&K, for which FiM requires the additional parameter k l = 0.59. This parameter value seems to be based upon the regression coefficient that FiM obtained after fitting a straight line to all data (Agnew et al., Reference Agnew, Yan, France, Kebreab and Thomas2004).
The reason why FiM selected a curvilinear model to predict MER from NEl was not an obvious curvilinearity in the relationship between NEl and ME intake in their data. Agnew et al. (Reference Agnew, Yan, France, Kebreab and Thomas2004) and earlier papers describing similar data sets (Yan et al., Reference Yan, Gordon, Agnew, Porter and Patterson1997; Kebreab et al., Reference Kebreab, France, Agnew, Yan, Dhanoa, Dijkstra, Beever and Reynolds2003) all mention that no curvilinear model described the data statistically better than a simple linear regression line. The only motive for preferring a Mitscherlich curve over a linear model was the presumed underprediction of MEm by the parameters of the linear model (Agnew et al., Reference Agnew, Yan, France, Kebreab and Thomas2004). MEm according to the curvilinear model is 0.647 × W 3/4 (MJ/d), about 12% higher than the MEm implied by the linear model that was fitted to the same data set (0.34/0.59 = 0.576 × W 3/4 MJ/d; Agnew et al., Reference Agnew, Yan, France, Kebreab and Thomas2004). However, FiM applies a correction factor of −10 MJ/d to the MER of all cows, irrespective of their NEl. This strongly suggests that this correction serves to avoid the overprediction of MEm. For a 600 kg cow, the correction corresponds to −0.082 × W 3/4 MJ/d, which results in an effective predicted MEm of 0.647 – 0.082 = 0.565 × W 3/4 MJ/d. Effective MEm for cows with W = 450 kg or W = 750 kg are 0.545 and 0.577 × W 3/4 MJ/d, respectively. On average, these values are, if anything, lower than the 0.576 × W 3/4 MJ/d that was suggested by linear regression, but was initially rejected by FiM as too low. If the effective final prediction of MEm in FiM corresponds to 0.565 × W 3/4 MJ/d, then either k m is severely underestimated (see Figure 1a) or, perhaps more likely, NEm must have been overestimated. This shows that the FiM system relies on an internal contradiction for its prediction of MER. This supports the scepticism with regard to the very high NEm estimate in FiM. It also casts doubt on the justification for preferring a curve above a straight line for the basic model. This is strengthened by the necessity for a second correction that serves to avoid the overprediction of MER for high-yielding cows by FiM’s basic model, which seems to be a direct consequence of the model’s curvilinearity. These rules have the unfortunate consequence of resulting in a sharp discontinuity with increasing MY in the partial efficiency of ME utilisation for lactation (Figure 1c). This is unprecedented in the literature and we know of no biological (or otherwise) justification for such discontinuities and this seems, therefore, a very weak basis for an energy evaluation system.
Efficiency of ME utilisation for gain and mobilisation of body energy: FiM uses a constant k g = 0.65 and no arguments are provided for ignoring effects of feed quality on k g, as incorporated in most other energy evaluation systems. FiM estimated k g directly from the data set and such estimates seem to be very variable because earlier analyses of similar data sets with similar models resulted in very different estimates ranging from 0.83 to 0.92 (Yan et al., Reference Yan, Gordon, Agnew, Porter and Patterson1997; Kebreab et al., Reference Kebreab, France, Agnew, Yan, Dhanoa, Dijkstra, Beever and Reynolds2003). ME is utilised with an efficiency of 0.6 in T&K, which seems to be in better agreement with most, but not all (NRC, 2001), other energy evaluation systems than the value used by FiM. The effect of the difference between systems in k g on MER predictions remains, however, very limited (Figure 2).
T&K adopted the ARC (1980) value for k mob (0.84), which is close to k mob estimates in many energy evaluation systems, such as 0.84 (AFRC, 1993), 0.82 (NRC, 2001) and 0.80 (INRA, 1989; CSIRO, 1990). FiM used a slightly lower estimate of k mob (0.78) that was obtained directly from the analysis of their data set. Direct estimates of k mob in this manner appear to be highly variable, because in previous analyses of similar data sets with similar models, estimates of k mob ranged from as low as 0.66 (Kebreab et al., Reference Kebreab, France, Agnew, Yan, Dhanoa, Dijkstra, Beever and Reynolds2003) to as high as 0.93 (Yan et al., Reference Yan, Gordon, Agnew, Porter and Patterson1997). The effect of a given weight loss on predicted reductions in MER depends on MY in FiM, which contrasts with other energy evaluation systems, including T&K. This is a direct consequence of the typical pattern of changes in partial energetic efficiency for lactation that is implicit in FiM, as depicted in Figure 1c. We know of no empirical evidence or biological arguments that could justify such an effect of production level on the ME-sparing effects of weight loss. The consequence of this unusual pattern on the comparison of MER as predicted by FiM and T&K remains very limited, however, as evidenced by Figure 2.
Causes of the differences between systems in predicted ME requirements
Despite large differences between FiM and T&K in parameter requirements and basic assumptions, the predicted MER are very similar, certainly in view of the generally observed considerable variation in respiration data (see, for instance, Kebreab et al., Reference Kebreab, France, Agnew, Yan, Dhanoa, Dijkstra, Beever and Reynolds2003). Since FiM reports that, after corrections, their MER predictions were satisfactory we must assume this will also be the case for the T&K predictions. The similarity between FiM and T&K predictions of MER is partly due to the corrections applied in FiM. The FiM estimate of total NEm is 42% higher than that in T&K (Table 1). The different k values (0.6 v. 0.7) reduce the initial difference between systems to 21% in terms of MEm. Application of the −10 MJ/d final correction in FiM reduces the effective difference between systems in predicted MEm to only 7% (Figure 2). Similarly, the use of an entirely different model in FiM for high MY reduces the differences in predicted MER for high-yielding cows between T&K and FiM’s basic model (Figure 2). The remaining differences seem to be primarily caused by the effects of the curvilinear FiM model and the linear T&K model. We compared the MER predicted by FiM’s basic fitted curvilinear model with the predicted MER using the parameters of the linear model that was fitted by FiM to the same data (Figure 4). Surprisingly, predicted MER on the basis of the Mitscherlich model were all higher than those predicted on the basis of the linear model. Apart from that, the shape of the curve in Figure 4b is very similar to that of the curve in Figure 2d, showing that the remaining differences between FiM and T&K are mainly the result of the (curvi-) linear nature of the underlying models. Figure 4c shows that the MER predicted by the FiM linear model are generally higher than those predicted by T&K. This is likely related to the overestimate of MER in the FiM data (as suggested by the need for an overall correction factor of −10 MJ/d). Although a direct comparison with other energy evaluation systems is impossible without information on feed quality, it should be pointed out that these other systems (such as van Es, Reference Van Es1978; ARC, 1980; INRA, 1989; CSIRO, 1990; AFRC, 1993) are also based on linear relationships between NEl and MEI. The relatively high MER predicted by FiM in comparison with T&K for cows with very low and very high MY and the relatively low MER for cows in between is, therefore, expected to be present as well in comparisons between FiM and other energy evaluation systems.
The metabolisable energy requirements (MER) predicted by Feed into Milk (FiM) (broken line) and by the linear regression line fitted by FiM to the same data set (a); the ratio of FiM’s non-linear and linear MER predictions (b) and the ratio of FiM’s linear MER predictions and Tolkamp & Ketelaars (T&K) predictions of MER. Requirements and ratios were calculated for a cow with W = 600 kg and ΔW = 0 kg/d.

Conclusions
FiM and T&K both predict MER of cows without considering effects of feed quality on energetic efficiency, which differs from other systems. FiM found no effects of feed quality on the relationship between NEl and ME intake in ad libitum-fed cows. This empirical evidence is highly relevant but FiM give no biological explanation for this finding. T&K not only predicted that this would be the case but also provide a biological explanation for this independence by pointing at the systematic effects of food quality on both voluntary ME intake and energetic efficiency.
The absence of effects of feed quality on MER leads to a significant reduction in parameter requirements compared to AFRC (1993) in T&K, but not in FiM. According to the principle of Ockham’s razor, a simpler explanation is to be preferred over a more complicated one if it has the same predictive power. Despite considerable differences between the two systems in underlying assumptions, predicted MER are very similar. The T&K system is not only simpler than the FiM system, in terms of model structure and parameter requirements, but also has much wider application than FiM because it can be used to translate requirements for NE into MER in ad libitum-fed beef cattle and other ruminants (Tolkamp and Ketelaars, Reference Tolkamp and Ketelaars1994).
The NEm parameter value in FiM is high compared with that in T&K and earlier estimates, but its effect on effective final MEm is much reduced as a result of the correction parameter −10 MJ/d. This leads to an internal contradiction in the FiM model and that is a weak basis for any energy evaluation system. No similar correction is required in the T&K system.
The high NEm estimate was the reason for FiM to fit a curvilinear model to a relationship that is essentially linear. The associated overprediction of MER for high-yielding cows is avoided by using an entirely different model to predict MER for such cows. This has very unattractive consequences for the estimated partial energetic efficiency for lactation and the MER-sparing effects of weight loss, resulting in discontinuities for which there are no biological explanations. This contrasts with the single model proposed by T&K that does not rely on such discontinuities.
The values for T&K’s parameters NEm and k were estimated in an analysis of a compilation of older data. Any new evaluation system should incorporate the latest available information, which should lead to better MER predictions. The comparison presented here with MER predictions by FiM, based on such an analysis of more recent data, suggests that any corrections, if required, are likely to be small.
Acknowledgement
SAC is supported by funding from RERAD.