When a person migrates to a new language environment, they obviously face challenges in learning to communicate in that new language. However, they may well assume that their children, if raised and fully educated in that environment, will be able to communicate just like a native speaker of that language. The present research examines whether this is actually the case, with a particular focus on an increasingly common group of adult second-generation bilinguals, namely the offspring of parents who migrated to an English-speaking country from a morphosyllabic Asian language environment (e.g., Chinese and Vietnamese). These are bilingual individuals for whom the lexical structure of L1, the native language of their parents, is very different from that of the language in which they were educated (i.e., their L2), and which is now their preferred language of use. So, the question is whether the morphosyllabic lexical structure of L1 makes their processing different from a bilingual with a non-morphosyllabic background.
It is well established that the incompatibility between the lexical structure of a dominant L1 and a subordinate L2 gives rise to non-optimal processing of the latter (e.g., Huang and Hanley, Reference Huang and Hanley1994; Holm and Dodd, Reference Holm and Dodd1996; Ho and Bryant, Reference Ho and Bryant1997; Akamatsu, Reference Akamatsu1999; Wang, Koda and Perfetti, Reference Wang, Koda and Perfetti2003), though with a focus on differences between L1 and L2 orthographic structure (logographic versus alphabetic) rather than differences in morphosyllabicity per se. If negative transfer effects arising from lexical structure are detectable even when L1 has become subordinate, it would indicate that the order of acquisition has a lasting impact on L2 performance independent of language dominance.
Previous studies of the L2 performance of adult “early L2-dominant bilinguals” have indicated that L1 has some impact on syntactic processing (e.g., Weber-Fox and Neville, Reference Weber-Fox and Neville1996, Reference Weber-Fox and Neville2001; McDonald, Reference McDonald2000), pronunciation (e.g., Flege, Munro and MacKay, Reference Flege, Munro and MacKay1995; Flege, Frieda and Nozawa, Reference Flege, Frieda and Nozawa1997b; Flege, Yeni-Komshian and Liu, 1999; Yeni-Komshian, Flege and Liu, Reference Yeni-Komshian, Flege and Liu2000; though see Flege, MacKay and Piske, Reference Flege, MacKay and Piske2002) and picture naming (e.g., Gollan and Acenas, Reference Gollan and Acenas2004; Gollan, Montoya, Fennema-Notestine and Morris, Reference Gollan, Montoya, Fennema-Notestine and Morris2005). Therefore, there is reason to believe that transfer effects can be found within the domain of lexical processing for this population.
The impact of L1 on the processing of L2 lexical structure
Speech is comprised of sequences of syllables, which are themselves composed of the subsyllabic units of onset and rime which, in turn, are composed of phonemes. Thus, there may be varying levels of phonological awareness on the basis of which spoken input is analyzed, and it is well known that the level attained is influenced by the phonological structure of the particular language (e.g., Liberman, Shankweiler, Fischer and Carter, Reference Liberman, Shankweiler, Fischer and Carter1974; Cossu, Shankweiler, Liberman, Katz and Tola, Reference Cossu, Shankweiler, Liberman, Katz and Tola1988; Caravolas and Bruck, Reference Caravolas and Bruck1993; Durgunoglu and Oney, Reference Durgunoglu and Oney1999; Cheung, Chen, Lai, Wong and Hills, Reference Cheung, Chen, Lai, Wong and Hills2001).
In a language where the syllable is typically the smallest meaningful unit (i.e., a morpheme), it makes sense for that to be the lowest level of phonological analysis. Chinese and Vietnamese are examples of such morphosyllabic languages (e.g., DeFrancis, Reference DeFrancis1989), in which there is a limited set of syllables from which all words are composed. New words are made up of novel combinations of existing syllables, and not through the coining of new syllables. This contrasts with other languages, such as English, where syllables might sometimes correspond to meaningful morphemes (as in monosyllabic words like cat, or polymorphemic words like seeing or blackboard), but often do not (such as the val and ue of value, or the ath and lete of athlete). In fact, polymorphemic words can sometimes be monosyllabic, such as cats or fourth. This means that word recognition in such non-morphosyllabic languages requires more than the mere identification of component syllables. Instead, the lowest level of sublexical analysis is below the level of the syllable, namely, at the phoneme level. It may not be the case that the recognition of known words requires such a low level of analysis, but it is most relevant when new words are encountered. In contrast to morphosyllabic languages, new words are often made up of novel combinations of existing phonemes (e.g., blog, Voldemort) which means that optimal processing of such novel stimuli (i.e., “nonwords”) requires an analysis into those known phonemes.
It should be noted that differences in phonological structure are often reflected in the orthographic system of the language: graphemes typically represent phonemes in non-morphosyllabic languages in the form of letters and letter clusters, and syllables in morphosyllabic languages in the form of characters (with a notable exception being Vietnamese, which is an alphabetically scripted morphosyllabic language). It is possible that the processing and retention of novel spoken words is expedited by the activation of their orthographic representation (see, e.g., Taft, Castles, Davis, Lazendic and Nguyen-Hoan, Reference Taft, Castles, Davis, Lazendic and Nguyen-Hoan2008). That is, orthographic recoding of the spoken utterance might allow the information to be held in a memory buffer in a different modality to that of the incoming information. Thus, for speakers of a non-morphosyllabic language, the phonemic analysis that allows a ready conversion of the utterance into its corresponding graphemes facilitates the processing of novel stimuli. On the other hand, phonemic analysis is not required for logographically scripted morphosyllabic languages (such as Chinese), but may be helpful in the case of alphabetically scripted morphosyllabic languages (such as Vietnamese). It might, therefore, be expected that bilinguals with a logographic L1 would have poorer phonemic awareness and greater difficulty decoding spoken English nonwords than either bilinguals with an alphabetic L1 or English monolinguals.
Holm and Dodd (Reference Holm and Dodd1996) showed exactly this pattern of results with adult Cantonese–English late bilinguals from Hong Kong, who had learned character-to-pronunciation mappings without the mediation of any alphabetic system (such as the pinyin system adopted in the People's Republic of China). This group performed more poorly than adult Vietnamese–English late bilinguals in phoneme manipulation tasks and when spelling nonwords to dictation, but not when spelling real words. Thus, the difficulties for the Cantonese arose when sublexical decoding was required. However, the Vietnamese bilinguals did not perform as well in these tasks as monolingual English speakers, despite the fact that both groups had been exposed to an alphabetic script from an early age. So, Vietnamese bilinguals were less able than monolinguals to analyze spoken English nonwords at the subsyllabic level, even though it is well established that knowledge of alphabetic script enhances phonemic awareness (e.g., Morais, Cary, Alegria and Bertelson, Reference Morais, Cary, Alegria and Bertelson1979; Read, Zhang, Nie and Ding, Reference Read, Zhang, Nie and Ding1986; Goswami and Bryant, Reference Goswami and Bryant1990; Cheung and Chen, Reference Cheung and Chen2004). The poorer performance of the Vietnamese may have been due to the fact that they were late learners of English and so were less familiar with L2 speech sounds than native speakers. Alternatively, the syllabic processing emphasized by the phonological structure of Vietnamese may have overridden the subsyllabic processing emphasized by its orthographic structure, leading to difficulty in performing phoneme manipulations.
So, what might be expected in the case of the adult early L2-dominant bilinguals with a morphosyllabic background? The present study sought to examine this question by comparing such bilinguals to monolingual English speakers, as well as bilinguals from a non-morphosyllabic background. The comparison with the latter group allows conclusions to be drawn about the impact of morphosyllabicity over and above any potential effects of knowing a second language per se. If phonemic awareness develops as a result of learning to read an alphabetic script (e.g., Morais et al., Reference Morais, Cary, Alegria and Bertelson1979; Read et al., Reference Read, Zhang, Nie and Ding1986; Goswami and Bryant, Reference Goswami and Bryant1990; Cheung and Chen, Reference Cheung and Chen2004) then, based on the fact that all the bilinguals in the present research were exposed to the alphabetic principle when learning to read English from an early age, they should have developed the same phonological sublexical processing skills as native English speakers. However, if having a morphosyllabic L1 exerts an influence on the development of phonological awareness in L2, then morphosyllabic bilinguals should differ from both monolinguals and non-morphosyllabic bilinguals in the way they process lexical structure. Because many early L2-dominant bilinguals with a Cantonese L1 are unable to read or write Chinese, any impact of L1 on English L2 might be assumed to reflect only the phonological characteristics of L1. If so, Cantonese early L2-dominant bilinguals should process spoken English in the same way that Vietnamese do. Regardless of any differences that might be found between these two morphosyllabic groups, however, their distinctive L1 phonological structure would still be expected to lead to a difference in English processing compared to bilinguals with an alphabetic and non-morphosyllabic L1. For the latter, the lexical structure of L1 is more similar to English than morphosyllabic languages and, therefore, is more likely to promote appropriate analysis and processing of L2.
The purpose of the present study, then, was to establish whether early L2-dominant bilinguals utilize an L2-appropriate level of analysis in processing spoken L2 (i.e., English) despite L1 and L2 having dissimilar lexical structures.
Description of participants
In order to be included in the study, it was necessary for a bilingual participant to report having learned their non-English language prior to learning English, but to nominate English as their dominant language (i.e., the language in which they felt they were more proficient). An explicit self-rating of L1 and L2 proficiency was also obtained in the study itself. None of the participants reported having any hearing or speech problems. The majority of bilinguals were born, raised and educated in the English-speaking environment of Australia, all having arrived before the age of six. All participants were current students at the University of New South Wales (UNSW) or recent graduates, and therefore had passed the Australian secondary-school English exam required for entry into university. Four language groups were tested.
(a) English-only monolinguals (EM)
The monolingual English speakers were all born and educated in Australia and had parents who were also native English speakers. Although some may have learned another language at school, all classified themselves as being able to speak only the one language.
(b) Cantonese–English bilinguals (CB)
All CB participants were able to speak only Cantonese and English. Their parents were all from Hong Kong. Cantonese is phonologically and orthographically different from English because it is morphosyllabic and non-alphabetic (i.e., logographic).
(c) Vietnamese–English bilinguals (VB)
The participants in the VB group could speak only Vietnamese and English. Vietnamese is orthographically similar to English inasmuch as it uses an alphabetic script, but it is morphosyllabic and hence more phonologically similar to Chinese.
(d) Other-English bilinguals (OB)
All the bilinguals in the “Other” language group had an L1 that was non-morphosyllabic and alphabetic. Due to the difficulty in obtaining enough participants in this condition from a single language group, the OB group necessarily comprised bilinguals from a range of different language backgrounds (e.g., Arabic, French, Greek, Hindi, Indonesian, Macedonian, Spanish, Tagalog). Although the diversity of languages prevents definitive arguments to be made about specific aspects of the performance of OB, it was important to include such a group in the analyses in order to provide a bilingual baseline against which the impact of morphosyllabicity could be evaluated. Without the inclusion of such a group, we cannot know if any difference that might be observed between EM and the morphosyllabic groups (CB and VB) arose from the morphosyllabicity of L1 or merely from being bilingual per se.
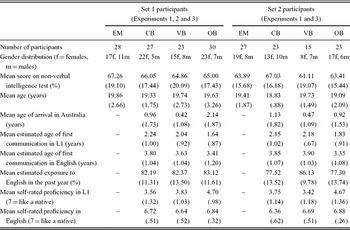
Owing to the large number of tasks administered (not all of which are reported in this paper) and the repetition of materials across some tasks, it was necessary to test two independent sets of participants. All four language groups were represented in each set and their characteristics are presented in Table 1. Mean non-verbal intelligence scores, based on a short version of the Raven's Advanced Progressive Matrices (RAPM: Bors and Stokes, Reference Bors and Stokes1998), did not differ between any of the groups (all ts < 1). The only significant difference in age was between CB and VB in Set 2, with VB being older [t(36) = 2.36, p < .05; all other ts < 1.5].
Language group characteristics (S.D. in parentheses).

Bilingual participants were given a questionnaire enquiring about their language background and experience, along with other demographic dimensions, in order to ascertain group characteristics and determine the equivalence of the groups in terms of exposure to and use of English. Participants were encouraged to record their best guess in relation to the approximate age at which they were first able to communicate in L1 and L2.
When looking at just the bilingual groups, OB in Set 1 might have been at a disadvantage in English relative to CB and VB because of their later age of arrival in the English-speaking environment of Australia [t(55) = 2.47, p < .05; t(51) = 3.93, p < .001, respectively] and their earlier estimated age of communicating in L1, though only compared to CB [t(55) = 2.42, p < .05]. The bilingual groups were matched on their estimated age of communicating in L2 (all ts < 1.6). The “exposure to English” score found in Table 1 is taken from responses to the question: “Of your time exposed to language in the last year, what percentage of that was English?” The only difference on this measure was for VB in Set 2 who estimated a greater exposure to English during the past year than CB and OB [t(36) = 2.13, p < .05; and t(36) = 2.15, p < .05, respectively]. As will be seen, there was nothing in the obtained results that could be systematically accounted for by differences in age, language experience or gender distribution.
The measure found in Table 1 of overall self-rated proficiency in L1 and English was based on the average of the participants’ rating of their ability to read, speak and understand L1 and L2 on a seven-point scale (with a rating of 1 representing “no knowledge” and 7 representing proficiency “like a native”). The main purpose of these ratings was to obtain a measure of the relative strength in each language of the bilingual participants, and hence confirm that L2 was their dominant language. Self-ratings of dominance have been employed elsewhere (e.g., Cutler, Mehler, Norris and Segui, Reference Cutler, Mehler, Norris and Segui1992; Golato, Reference Golato2002; Gollan et al., Reference Gollan, Montoya, Fennema-Notestine and Morris2005), and were chosen over the use of a direct measurement of L1 performance for comparison with L2 performance (e.g., Bahrick, Hall, Goggin, Bahrick and Berger, Reference Bahrick, Hall, Goggin, Bahrick and Berger1994; Flege et al., Reference Flege, MacKay and Piske2002). This was for two reasons. First, it is not always easy to equate the difficulty of the materials used in L1 and L2 tasks, and second, even if they could be equated, the considerable diversity of language backgrounds of the OB group meant that the testing of participants in their L1 would have been impracticable.
The rating data in Table 1 clearly show that English was the dominant language of the bilinguals. The vast majority rated their proficiency in all aspects of English use as a 7, and everyone assessed their English ability as being superior to their L1 ability. No differences were observed between the two morphosyllabic groups on self-rated language ability in L1 or L2 in either set (ts < 1.7). However, OB gave a higher rating of their L1 proficiency than CB and VB in both Set 1 [t(55) = 3.74, p < .001; t(51) = 3.15, p < .005, respectively] and Set 2 [t(44) = 2.46, p < .05; t(36) = 2.90, p < .01, respectively]. The only difference in ratings of English ability was between OB and CB in Set 2, with OB giving a higher score [t(44) = 3.73, p < .005; all other ts < 1.56].
Experiment 1: phoneme awareness
The goal of Experiment 1 was to determine whether adult early bilinguals with a morphosyllabic L1 who are dominant in English (i.e., their L2) analyze spoken words and nonwords in the same way as native English speakers, namely, at the phoneme level. The ability to manipulate phonemic units of speech (i.e., phonemic awareness) was tested through a phoneme deletion task. While most tests of phonemic awareness are positively correlated, phoneme deletion tasks have been consistently shown to have high test–retest reliability and to be more difficult than other tasks (e.g., Stanovich, Cunningham and Cramer, Reference Stanovich, Cunningham and Cramer1984; Yopp, Reference Yopp1988), which is important for avoiding ceiling effects. In the task given here, monosyllabic word and nonword stimuli were used, and deletion in both initial and final position was tested. Rather than instructing participants to remove a particular phoneme, they were asked to delete the first or last “sound” of the utterance, which means that it was left up to the individual to decide what grain-size was being referred to. As such, the responses given by participants were neither correct nor incorrect, but indicated their preferred grain-size of analysis.
If L1 phonological structure affects L2 processing, then differences in the interpretation of grain-size might be expected between the groups, despite all groups having had their entire education in a non-morphosyllabic language (i.e., English). Monolinguals (EM) and bilinguals with a non-morphosyllabic L1 background (OB) were expected to interpret the concept of a “sound” as referring to a phoneme. However, bilinguals with a morphosyllabic L1 (CB and VB) might remove grain-size units larger in size than phonemes because their L1 emphasizes phonological analysis at a level higher than the phoneme.
Method
Participants
Both sets of participants were given the same phonemic awareness task and so an analysis over all the participants was carried out.
Materials and procedure
A random mixture of monosyllabic real-word and nonword items (24 of each) were orally presented to participants, who were then asked to say aloud each item without either its initial or final sound. The items were presented in two counterbalanced blocks based on deletion position, with participants being informed beforehand whether initial or final deletion was required. In the initial deletion block, words and nonwords were matched on their onset which was either a singleton (e.g., /nεkst/, i.e., “next”; /nεʃ/, i.e., “nesh”) or a cluster (e.g., /flæt/, i.e., “flat”; /flæz/, i.e., “flaz”). For the final deletion block, words and nonwords were matched on their coda, which was again either a singleton (e.g., /sliːp/, i.e., “sleep”; /smiːp/, i.e., “smeep”) or a cluster (e.g., /dʒʌmp/, i.e., “jump”; /vʌmp/, i.e., “vump”). If participants were to remove a single phoneme (e.g., delete /n/ from /nεkst/ or /p/ from /vʌmp/), then the phoneme to be removed was always a consonant, and always produced a nonword on deletion. Participants were not told this nor given any practice or feedback on their performance. Stimuli were digitally recorded by a male native speaker of English using sound-editing software and were played to participants through headphones. Participants were allowed a time limit of 3 seconds to respond. Responses were recorded so that the accuracy of pronunciation could be analyzed by a native English speaker and verified by a second person.
Results
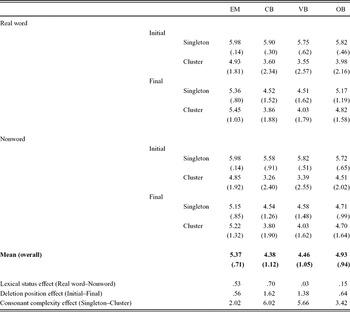
The occasions that the removed sound was a single phoneme are referred to as “phoneme-sized deletions”, and Table 2 gives the mean number of such responses for each language group separated into real-word and nonword, initial and final, and singleton and cluster. This meant there were eight cells per language group, each with a maximum score of 6. In this and all other experiments, four contrasts were tested in the ANOVA: CB, VB, OB vs. EM (i.e., bilinguals vs. monolinguals); CB, VB vs. OB (morphosyllabic vs. non-morphosyllabic bilinguals); CB vs. VB (logographic vs. alphabetic morphosyllabic bilinguals); and OB vs. EM (non-morphosyllabic bilinguals vs. monolinguals).
Mean number of phoneme-sized deletions on the phoneme deletion task of Experiment 1 across language groups (S.D. in parentheses). The maximum score for each cell is 6.

Collapsing over all types of item, monolinguals made significantly more phoneme-sized deletions than bilinguals [F(1,192) = 28.90, p < .001]. While bilinguals with morphosyllabic L1 (CB and VB) did not differ from each other (F < 1), they deleted fewer phoneme-sized units than OB [F(1,138) = 8.82, p < .005], who in turn made fewer phoneme-sized deletions than EM [F(1,106) = 8.34, p < .01].
There was a main effect of position, with more initial than final phoneme-sized deletions [F(1,192) = 11.32, p < .001], and a main effect of lexical status with more phoneme-sized deletions for real words than for nonwords, though this was only a strong trend [F(1,192) = 3.85, p = .051]. Since neither position nor lexical status interacted with language group (Fs < 1.1), however, further analyses collapsed across these two factors.
The effect of consonant complexity was significant, with more phoneme-sized deletions across language groups for singletons than clusters [F(1,192) = 84.95, p < .001]. Analyses revealed a significant interaction showing that phoneme-sized deletions for clusters relative to singletons were less prevalent for bilinguals than for monolinguals [F(1,192) = 8.64, p < .005]. There was also a significant interaction indicating that morphosyllabic L1 bilinguals (CB and VB) were less likely than OB to remove phoneme-sized units from cluster items than from singleton items [F(1,138) = 4.01, p < .05]. The interactions between CB and VB, as well as between EM and OB, were not significant (Fs < 1.7).
Despite the interaction of consonant complexity with language, the same pattern was observed for both clusters and singletons. In particular, monolinguals differed from bilinguals for both clusters [F(1,192) = 20.42, p < .001] and singletons [F(1,192) = 16.90, p < .001]. The morphosyllabic groups made significantly fewer phoneme-sized deletions for cluster items than OB [F(1,138) = 7.32, p < .01], with a strong trend in the same direction for singleton items [F(1,138) = 2.96, p = .088], while CB and VB did not differ from each other on either type of item (Fs < 1). Monolinguals made significantly more phoneme-sized deletions than OB for both consonant cluster and singleton items [F(1,106) = 5.01, p < .05; F(1,106) = 8.92, p < .005, respectively].
Discussion
The results from the phoneme deletion task showed that CB and VB were more likely to interpret the first or last sound of an utterance as something other than a single phoneme, and that the two groups did not differ from each other in this regard. In addition, bilinguals from a non-morphosyllabic background (OB) were more sensitive to the phoneme level than those with a morphosyllabic background. Such a result is consistent with the idea that morphosyllabicity in L1 emphasizes processing at a level higher than the phoneme and that this tendency transfers to L2 processing, even when L2 is the dominant language. This indicates that different L1s can have a differential effect on the processing of a dominant L2, depending on their phonological structure.
However, while OB were more phonemically aware than morphosyllabic L1 bilinguals, they were also biased towards using a larger grain-size than monolinguals. This was contrary to expectations, given that OB were selected on the basis that their L1 did not discourage subsyllabic processing and that the optimal unit of processing for any non-morphosyllabic language is the phoneme. It also seems to go against studies on bilingual children with an OB background (e.g., Spanish and Samoan) who displayed comparable phonemic awareness to English monolingual children (e.g., Bialystok, Majumder and Martin, Reference Bialystok, Majumder and Martin2003; Hamilton and Gillon, Reference Hamilton and Gillon2006). Based on the results of this experiment, it is apparent that at least some non-morphosyllabic languages may have characteristics that potentially affect the grain-size of sublexical processing. Potentially important characteristics might be consonantal complexity within the language or clarity of syllabic structure. However, owing to the heterogeneity of the OB languages, the true basis for the difference between OB and EM remains speculative and awaits a more direct examination using homogeneous OB groups of different language backgrounds. What is important about the OB results though, is that, despite the heterogeneity of their L1, they showed significantly greater sensitivity to the phoneme level than CB and VB. The common underlying feature of the OB languages, in contrast to Cantonese and Vietnamese, is their non-morphosyllabicity, which emphasizes the point that the lexical structure of L1 influences L2 processing even when the former has become subordinate.
Turning now to the types of responses that constituted a larger-than-phoneme-sized deletion, there were two main categories: deletion of consonant clusters (e.g., giving /oʊʃ/ when deleting the first sound of /froʊʃ/, or giving /moʊ/ when deleting the last sound of /moʊst/), and deletion of the vowel along with the onset or coda (e.g., giving /z/ when deleting the first sound of /flaz/, or giving /sl/ when deleting the final sound of /sliːp/). The nature of these responses provides a potential window onto the way in which a morphosyllabic L1 influences the processing of L2, given that CB and VB made more such responses than OB and EM. When pronouncing English words or pseudo-words, Cantonese ESL learners have been observed (e.g., by Lin, Reference Lin2003) to simplify consonant clusters by removing one consonant (e.g., simplifying /fr/ to /f/) or applying epenthesis, which is the insertion of a vowel between the consonants (e.g., pronouncing /fr/ as /fər/). Thus, it is possible that speakers of any L1 that lacks consonant clusters perceive clusters in this way, even though the majority of the bilinguals in the present research spoke with native or near-native Australian-English accents. Perceiving clusters as singletons can explain the deletion of whole consonant clusters, but cannot explain why deletion of onset-vowel or vowel-coda would occur, and the application of epenthesis cannot explain the deletion of whole clusters. So, it seems that responses were simply a result of the listener treating a cluster as an indivisible unit (be it CC, CV or VC), which reinforces the claim that the higher rate of larger-than-phoneme-sized deletions given by CB and VB indicates a lack of sensitivity to the phoneme as a sublexical unit.
In sum, the results suggest that L2-dominant bilinguals have less sensitivity to phoneme-sized units than monolinguals. The reduced awareness of L2 phonemes is particularly exacerbated for bilinguals with a morphosyllabic L1 because they are first exposed to a language that emphasizes syllabic rather than subsyllabic processing.
Experiment 2: spelling-to-dictation
The performance of participants on the phoneme deletion task relied on their interpretation of what they thought constituted a “sound”, and while this gave an indication of their preferred grain-size of analysis, a more direct measure of phonological skill warrants exploration. Thus, Experiment 2 sought to examine how the different language groups processed English monosyllabic nonwords and real words in a spelling-to-dictation task. While the spelling of a real word can be achieved by accessing its whole-word representation, no such access is available for nonwords. In order to accurately spell a novel utterance, the sublexical phonological components of the spoken input must be correctly identified and then converted into their corresponding orthographic units. Therefore, whether one is capable of phonological analysis at a subsyllabic level is relevant because spoken English monosyllabic nonwords are composed of novel combinations of phonemes, and it has been shown that native English speakers use phoneme–grapheme-sized relationships when spelling nonwords (e.g., Perry, Ziegler and Coltheart, Reference Perry, Ziegler and Coltheart2002). Hence, it was expected that bilinguals would demonstrate difficulty spelling nonwords relative to monolinguals. Furthermore, given that L1 phonological structure appears to have an influence on phonemic analysis, it was expected that the morphosyllabic L1 bilingual groups would have the most impaired nonword spelling ability. When spelling real words, sublexical structures are less important because the lexical representation can be accessed directly. If lexical-level processing in L2 is unaffected by language background, no differences between the groups should be observed for real-word spelling.
If an utterance is processed at the syllable level then, when that syllable does not have a lexical representation (i.e., when it is a monosyllabic nonword), any erroneous responses that one observes should be real words that are similar in sound to the utterance. This was tested by ensuring that each nonword item sounded similar to a real word (e.g., /zoʊm/, i.e., “zoam”, which is potentially confusable with /zoʊn/, i.e., “zone”). Such errors might be made, though, because the nonword is misheard rather than there being approximate access on the basis of the syllable. To test this, real-word items that were potentially confusable with a higher frequency phonological neighbor were also examined (e.g., /foʊm/, i.e., “foam”, which is potentially confusable with the more common word /foʊn/, i.e., “phone”). If the syllable is simply misheard (i.e., the processing problem occurs at reception rather than at access), then the same confusions should be found for real words as for nonwords.
Method
Participants
Only the participants from Set 1 were tested in this experiment.
Materials and procedure
Participants listened to auditory stimuli through headphones and were asked to write down the correct spelling. There were two conditions, each including 15 monosyllabic items: (1) real words that were only one phonetic feature different from another word of higher frequency (e.g., /foʊm/); and (2) nonwords that were only one phonetic feature different from a real word (e.g., /zoʊm/). Words and nonwords were intermixed and presented in a random order. Phonological neighborhood density (i.e., the number of words that were one phoneme different from the stimulus; e.g., Vitevitch and Luce, Reference Vitevitch and Luce1999) and frequency of the “potential error” (based on CELEX word frequency norms; Baayen, Piepenbrock and van Rijn, Reference Baayen, Piepenbrock and van Rijn1993) were matched across the word (68.1 per million) and nonword (62.7 per million) conditions (t < 1). Stimuli were recorded by a male native speaker of English.
Results
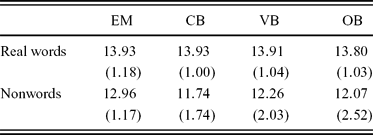
The mean spelling accuracy of the participants across conditions is shown in Table 3. For nonwords, any spelling that could represent the same pronunciation as the test stimulus was considered correct (e.g., zoam or zome for /zoʊm/, but not zom or zoom).
Mean spelling accuracy in Experiment 2 across language groups (S.D. in parentheses). Scores are out of 15.
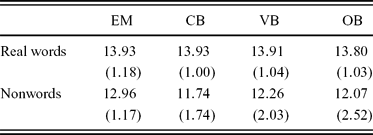
Across language groups there was a significant main effect of lexical status, with participants finding the spelling of nonwords more difficult than that of real words [F(1,104) = 82.00, p < .001]. There was also a significant interaction revealing that lexical status had a greater impact on bilingual performance than on monolingual performance [F(1,104) = 4.73, p < .05], but no significant interactions in the comparisons between the bilingual groups (Fs < 1.4). All four groups spelled real words equally well (Fs < 1), but monolinguals were able to spell nonwords significantly better than bilinguals [F(1,104) = 4.88, p < .05]. The three bilingual groups did not differ from each other on nonword spelling (all Fs < 1).
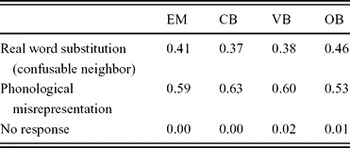
There were three types of errors made to nonwords: phonological misrepresentations (e.g., dit for /diːt/, veng for /væŋ/); substitutions with the word that was the confusable neighbor (e.g., deed for /diːt/, van for /væŋ/); and no response. Table 4 gives the mean proportion of error type made for each group. A chi-square test performed on the frequencies revealed that the types of responses were given in equal proportions across the language groups [χ2(6, N = 108) = 5.77, p = .45].
Mean proportion of nonword spelling error responses in Experiment 2 across language group.

Discussion
While the groups all performed equally well in their spelling of real words, bilinguals were found to have greater difficulty with nonwords relative to monolinguals. The fact that many of these errors were substitutions with a confusable word might suggest that the greater number of errors made by bilinguals arose from an imprecise perception of English pronunciation, leading to a phonologically approximate response that drew upon a stored lexical representation. However, the fact that bilinguals rarely made errors on the real-word items opposes this idea. That is, if the problem were perceptual, bilinguals should have also substituted a real word for its lower frequency neighbor (e.g., giving fan for /fæŋ/) just as often as they substituted a word for a nonword. Therefore, a more likely explanation is that the bilinguals had inferior sublexical processing skills to the monolinguals.
Nonword spelling-to-dictation involves an analysis of the phonological input into sublexical units and then a translation of those units into their corresponding graphemes. Poorer sublexical skills could potentially manifest themselves at either or both of these components of the task. However, the fact that bilinguals analyzed L2 spoken utterances differently from monolinguals in the phoneme deletion task supports the idea that bilinguals are less likely to analyze the phonological input into grain-sized units that are optimal for spelling English nonwords (i.e., phonemes).
Holm and Dodd (Reference Holm and Dodd1996) found that L1-dominant Cantonese–English bilinguals were poorer at spelling English nonwords than L1-dominant Vietnamese–English bilinguals, which was taken as evidence for the relevance of L1 orthography as a factor in the development of phonological awareness. In contrast, the present research found no difference between CB and VB, and this is readily explained by the fact that learning to read an alphabetic script (i.e., English) was likely to be the first exposure to a writing system for CB. In conjunction with the findings of Holm and Dodd (Reference Holm and Dodd1996), the results reported here suggest that early exposure to an alphabetic orthographic system may reduce the nonword spelling difficulties faced by Cantonese–English speakers, thus bringing them to the same level as Vietnamese–English speakers. However, difficulties still remain for the morphosyllabic bilinguals, since both groups demonstrated poorer nonword spelling than monolinguals. It seems that early and sustained exposure to L1 phonology may be sufficient to impair L2 auditory sublexical processing if the phonological structures of the two languages are different.
Given that morphosyllabicity was shown to affect phonemic awareness in Experiment 1, CB and VB were expected to be less able to spell English nonwords than OB because similar phonological analytical skills should be involved. However, it turned out that there was no difference on nonword spelling between the bilingual groups. One possible reason for not obtaining a morphosyllabic effect in Experiment 2 is that nonword spelling can potentially be completed by using units larger than the phoneme, such as onsets and rimes. For example, /zoʊm/ can be spelled by using its rime /oʊm/ to draw an analogy with the word /foʊm/, and hence spelling it as zoam by replacing the onset f with the onset z. Thus, the task may not necessarily require awareness at the phoneme level.
Another possible reason for the discrepancy between the pattern of bilingual performance on the nonword spelling and phoneme-deletion tasks is that the former requires the explicit translation of the sublexical phonological units into their orthographic form, whereas the latter does not. Although OB may have more readily analyzed the phonological input into its phonemes than the morphosyllabic groups, they may have experienced interference from the set of phoneme–grapheme conversions appropriate to their L1, leading to misrepresentations in the spelling of English sounds.
Generally speaking, though, if monolinguals outperform bilinguals irrespective of L1 structure, it can be taken to mean that there are general effects of the delayed and/or reduced exposure to English. In childhood, as a result of L1 being the primary language of communication in the home, bilinguals are given less exposure to their L2 than monolinguals of that language. Moreover, any English that the parents might have used with their children when growing up would have been non-native and hence phonologically degraded. It may therefore be the early poverty of exposure to English that reduces the sensitivity of adult bilinguals to the phonemic structure of English, despite it having become their dominant language. The phoneme deletion task may be a more sensitive measure of subsyllabic awareness than nonword spelling and, thus, was able to detect the added effect of having a morphosyllabic L1 over and above such exposure effects.
The results from both Experiments 1 and 2 demonstrate that early L2-dominant bilinguals do not attain a level of native-like performance in their phonological analysis of English speech, despite the fact that they were born and educated in an English-speaking environment and that English is their dominant language. It may be argued, though, that any preference for larger grain-size phonological units does not impair day-to-day language functioning. Whether this is true or not can be tested by examining the comprehension of spoken language, notably when there are novel lexical items.
Experiment 3: auditory comprehension
The aim of Experiment 3 was to build on the findings of Experiments 1 and 2 to determine whether the reduced use of phoneme-sized units in phonological analysis by bilinguals translates into a difficulty in processing English speech for meaning. In particular, an impaired ability to process novel speech sounds, as reflected in the poorer nonword spelling of bilinguals, might be a disadvantage in understanding spoken passages that contain novel words (i.e., nonwords). If it is assumed that comprehension ability is constrained by the availability of working memory resources (e.g., Just and Carpenter, Reference Just and Carpenter1992; Waters and Caplan, Reference Waters and Caplan1996; but see MacDonald and Christiansen, Reference MacDonald and Christiansen2002), then difficulty in higher-level comprehension might occur when low-level processes place greater demands on resources. For instance, when listening to passages of L2 speech on an unfamiliar topic, where there is a heavy reliance on bottom-up information from the speech signal for comprehension, non-native speakers show relatively greater working memory consumption than natives (e.g., Tyler, Reference Tyler2001). This is ostensibly because their low-level processing is inappropriate or less efficient than that of natives (e.g., Wolff, Reference Wolff1987; Tyler, Reference Tyler2001). Similarly, in processing passages that contain novel words, bilinguals may consume more resources when decoding nonwords because of their poorer phonological sublexical skills, thus reducing the available cognitive capacity required to understand the passage.
To examine this possibility, participants were presented with spoken passages that contained nonwords (i.e., unusual proper names), with comprehension tested through open-ended questions at the end of each passage. If the presence of novel words does cause bilinguals to have difficulty with auditory comprehension, then monolinguals should outperform bilinguals on this task. Moreover, if phonemic awareness is relevant to the processing of novelty, then CB and VB should have the most difficulty. Finally, when a passage is free of nonwords, no difference in auditory comprehension should be observed between any of the language groups, and this was also examined.
Method
Participants
Both sets of participants were tested.
Materials and procedure
All participants were given a series of passages containing nonwords (the “Nonword” condition), with different passages given to Set 1 and Set 2. This allowed the participants in Set 2 to also receive the same passages given to Set 1, but with real words replacing the nonwords (the “Real-word” condition). Thus, only Set 2 received both the Nonword and Real-word conditions. For each of the conditions, participants listened to ten short passages through headphones and were then asked open-ended comprehension questions, one per passage. To enable the inclusion in the Nonword condition of novel words (i.e., unusual proper names of characters or places), a variety of genres was used: fantasy, historical, geographical and science fiction. The passages were one to two sentences in length, thus ensuring that the task was not too taxing on memory. The Nonword condition presented to each set of participants used different nonwords, but the passages were similar in length and style, and encompassed a similar range of genres.
For the Nonword condition, the comprehension questions generally targeted any potential confusion that might have occurred if the participant had not processed the passage properly, and particularly where that confusion might have arisen directly after or soon after the nonword utterance. An example of a passage was: “There was no shame in going to see the witch doctor from Kamala, even though his name, Basanti Sushma meant ‘Black Stain’ and resonated an eerie sense of dread. But there was no other option, no-one else dared to treat my condition.”, and the question relating to this was: “What did the witch doctor's name mean?”.
For the Real-word condition (presented to Set 2 participants), the nonwords in the passages from the Set 1 Nonword condition were either replaced with well-known words or deleted altogether, so that new passages that were free from novelty were generated. For instance, the corresponding Real-word passage to the example given above replaced “from Kamala” with “in the jungle” and removed “Basanti Sushma”. The questions and answers were the same as for the Nonword condition presented to Set 1 participants. The order of presentation of the Nonword and Real-word conditions for Set 2 was counterbalanced. All stimuli were recorded by the same male native speaker of English.
Results
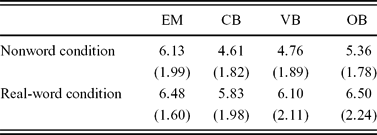
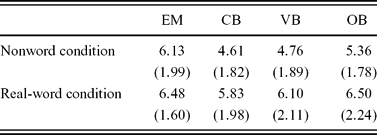
The mean number of correct responses to the comprehension questions for the language groups is shown in Table 5. In the Nonword condition, CB and VB performed significantly more poorly than OB [F(1,134) = 4.08, p < .05], who performed more poorly than EM [F(1,103) = 6.03, p < .05]. The two morphosyllabic groups did not differ (F < 1). There were no significant differences between groups for the Real-word condition (all Fs < 1).
Mean number of correct responses on the auditory comprehension tasks in Experiment 3 across language groups (S.D. in parentheses). Scores are out of 10.
Discussion
The analyses revealed that, while there were no group differences on the Real-word condition, bilinguals found the Nonword condition more difficult than did monolinguals. Moreover, CB and VB performed more poorly than OB. These results indicate that early English-dominant bilinguals, in particular those with an L1 that does not encourage subsyllabic processing, have difficulty processing spoken passages containing novelty in English relative to monolinguals. It may be that being capable of phonemic analysis enables participants to decode nonwords optimally, thus freeing up more resources for passage comprehension.
Therefore, the impact of differences in processing L2 phonological information arising from L1 structure is seen not only in tasks probing a low level of analysis (Experiments 1 and 2), but in having to understand new information when processing English speech for meaning. This means that bilinguals, especially those with a morphosyllabic background, might be at a disadvantage in such situations, for example in an educational setting.
General discussion
The present study revealed that adult early L2-dominant bilinguals process English auditory information differently from monolingual native speakers of English, with the clearest differences being observed for bilinguals with a morphosyllabic L1. This is a remarkable finding, given that these are individuals who have had all of their education in English, and who predominantly rate their auditory understanding of English at a native level, unlike their L1.
In seeking to explain the observed patterns of performance, it is necessary to consider the ways in which bilinguals differ from monolinguals. First, by virtue of their learning another language beforehand, bilinguals learn English at a later age than monolinguals. Based on the estimates found in Table 1, the delay in L2 learning for the bilinguals was only around 1.5 years (assuming that the monolinguals learned English at the same age that the bilinguals learned their L1, i.e., around the age of two). The differential performance of the adult bilinguals and monolinguals of the present study suggests that if there is a “sensitive period” for language acquisition (e.g., Long, Reference Long1990; Singleton, Reference Singleton2005), the window for optimal learning is very small.
A second difference between bilinguals and monolinguals is the obvious fact that the former know an extra language, with the first language possibly even remaining dominant up until the age of ten (see, e.g., Taft and Bodi, Reference Taft and Bodi1980; Kohnert, Bates and Hernandez, Reference Kohnert, Bates and Hernandez1999). The subsequent learning of L2 following the establishment of L1 means that there is likely to be cross-linguistic competition and transfer between languages such that L1 has an impact on the development of phonological processing skills in L2 (e.g., Bates and MacWhinney, Reference Bates, MacWhinney, MacWhinney and Bates1989; MacWhinney, Reference MacWhinney, de Groot and Kroll1997; Hernandez, Li and MacWhinney, Reference MacWhinney, Kroll and de Groot2005; Hernandez and Li, Reference Hernandez and Li2007). Indeed, the poorer performance of CB and VB relative to OB on phoneme deletion and novel auditory comprehension provide strong evidence for this. Such a finding suggests that the development of L2 processing skills may be determined by early (and prolonged) linguistic experience (e.g., Flege, Bohn and Jang, Reference Flege, Bohn and Jang1997a; Bialystok and Miller, Reference Bialystok and Miller1999; Yeni-Komshian et al., Reference Yeni-Komshian, Flege and Liu2000; Birdsong and Molis, Reference Birdsong and Molis2001; Pallier, Colome and Sebastián-Gallés, Reference Pallier, Colome and Sebastián-Gallés2001), rather than being constrained by the expiration of a sensitive period. Applying this to the present research, the syllabic processing promoted by a morphosyllabic structure in L1 interferes with the development of L2 phonological processing skills, such that non-optimal strategies are adopted when faced with novel spoken information in L2.
Hence, the results from the present research are most consistent with the Competition Model (e.g., MacWhinney, Reference MacWhinney and MacWhinney1987, Reference MacWhinney and Harris1992, Reference MacWhinney, de Groot and Kroll1997, Reference MacWhinney, Kroll and de Groot2005; Bates and MacWhinney, Reference Bates, MacWhinney, MacWhinney and Bates1989; Hernandez et al., Reference Hernandez, Li and MacWhinney2005), whereby L2 is parasitic on L1 and, as such, experiences intrusion and transfer effects from the language that was established first. While an L1 system that is deeply entrenched may well exert an influence on the way L2 is processed, the detection of L1 transfer effects in the present research demonstrates that the influence is long-lasting even when L1 has become markedly subordinate. The impact of early spoken language experience and phonological structure has been demonstrated in children (e.g., Cossu et al., Reference Cossu, Shankweiler, Liberman, Katz and Tola1988; Caravolas and Bruck, Reference Caravolas and Bruck1993; Ho and Bryant, Reference Ho and Bryant1997; Durgunoglu and Oney, Reference Durgunoglu and Oney1999; Cheung et al., Reference Cheung, Chen, Lai, Wong and Hills2001), so it is possible that having L1 as the dominant language in childhood shapes the development of the L2 system such that L1 transfer effects on L2 processing are detectable in adulthood many years later. The early linguistic experience not only includes the prior learning of L1, but also the possibility that the bilinguals, as children, were exposed to a non-native version of L2 from their parents, or even taught L2 prior to schooling in a non-optimal way.
What is not clear, though, is whether the impact of L1 on L2 processing in adulthood solely arises from the dominance of L1 during childhood, or whether the maintenance of L1 (i.e., further L1 entrenchment) continues to interfere with optimal performance in L2, despite L1 becoming subordinate. In the present research, the non-native performance of CB and VB may not simply be a result of their early exposure to a morphosyllabic L1, but may be contingent upon continued input from L1 helping to maintain a bias towards syllable-based strategies. In support of this idea, studies have shown that adult early bilinguals who continue to use L1 relatively often, speak L2 with a stronger foreign accent than those who seldom use L1 (e.g., Flege et al., Reference Flege, Frieda and Nozawa1997b; Yeni-Komshian et al., Reference Yeni-Komshian, Flege and Liu2000; Piske, MacKay and Flege, Reference Piske, MacKay and Flege2001).
To investigate the maintenance hypothesis directly, it would make sense to systematically examine the L2 ability of adults for whom L1 has been entirely supplanted, such as the adoptees tested by Pallier et al. (Reference Pallier, Dehaene, Poline, LeBihan, Argenti, Dupoux and Mehler2003) and Ventureyra, Pallier and Yoo (Reference Ventureyra, Pallier and Yoo2004). If L1-specific transfer effects were also observed in the performance of adoptees, this would indicate that early exposure to L1 is sufficient to influence L2 acquisition through to adulthood.
The finding of a morphosyllabic effect on the processing of spoken L2 draws attention to L1 phonological structure as a source of language transfer effects. In the past, such effects in adult bilinguals have been primarily attributed to L1 orthography (e.g., Read et al., Reference Read, Zhang, Nie and Ding1986; Holm and Dodd, Reference Holm and Dodd1996; Wang et al., Reference Wang, Koda and Perfetti2003; but see Yamada, Reference Yamada2004). The argument is that the whole-word processing strategy that is encouraged by a first-learned logographic script disadvantages late Cantonese–English bilinguals on L2 phonological tasks that require sublexical skills (e.g., Holm and Dodd, Reference Holm and Dodd1996). In contrast to Holm and Dodd (Reference Holm and Dodd1996), though, no differences were found between Cantonese–English and Vietnamese–English bilinguals on any of the tasks in the present study. This implies that early alphabetic experience (in English) helps the former overcome difficulties with subsyllabic processing, such that their performance is on a par with the latter. However, the finding that these two groups consistently performed more poorly than native English speakers in the present research suggests that these difficulties are not entirely eliminated by the early learning of an alphabetic script, and reinforces the importance of morphosyllabicity over and above orthographic experience. Such an idea is also supported by the fact that post-hoc analyses carried out to compare the performance of CB who reported being able to read L1 and those who could not failed to find an advantage for the non-readers on any measure.
Concluding remarks
The findings from the present study indicate that having been exposed to an L1, even one that becomes subordinate, may lead to subtle differences in processing for bilinguals relative to monolinguals, that have an impact on the optimal use of L2 in adulthood. In particular, there was evidence that an incompatibility in phonological structure between a morphosyllabic L1 and a non-morphosyllabic L2 can give rise to the development of non-native auditory processing skills in L2.
The present findings reveal that native competence in L2 cannot be assumed to arise merely from early and intensive exposure to that language, and are in line with previous research in this respect (e.g., Pallier, Bosch and Sebastian-Galles, Reference Pallier, Bosch and Sebastián-Gallés1997; Flege et al., Reference Flege, Yeni–Komshian and Liu1999; Bosch, Costa and Sebastian-Galles, Reference Bosch, Costa and Sebastián-Gallés2000; Yeni-Komshian et al., Reference Yeni-Komshian, Flege and Liu2000; Pallier et al., Reference Pallier, Colome and Sebastián-Gallés2001; Sebastian-Galles, Echeverría and Bosch., Reference Sebastián-Gallés, Echeverría and Bosch2005), though extending it to include bilinguals for whom L2 has become dominant. It is apparent, then, that the children of migrants may still face subtle challenges when communicating in the language of the country in which they have been raised.