


Introduction
All exposures discussed in this paper occur within the preglacial valley system in south-central Alberta, Canada. These exposures are at Carmangay and Travers Reservoir (in the Tee Pee preglacial valley) and at McGregor Reservoir (the McGregor preglacial valley) (Fig. 1). Extensive riverbank and reservoir shoreline erosion exposes up to 70 m of sediment. The Carmangay exposure lies within an area of fluted terrain, which is draped by Glacial Lake Carmangay sediments (Fig. 1). All other exposures lie within the McGregor moraine (Reference ShetsenShetsen, 1984; Buffalo Lake moraine of Reference StalkerStalker, 1977), a major north-south trending zone of hummocks (Fig. 1). This moraine was originally thought by Reference StalkerStalker (1977) to represent the late Wisconsinan maximum in Alberta, but was later reinterpreted to be interlobate (Reference ShetsenShetsen, 1984). More recent research indicates the hummocks are erosional rather than depositional (Reference Munro and ShawMunro and Shaw, 1997). Hence, the hummocky zone is not a moraine, and the sedimentary descriptions and interpretations presented here do not support a depositional model for hummocky terrain in south-central Alberta. The two youngest glaciogenic facies in the preglacial valleys are interpreted as subglacial aqueous deposits. This interpretation implies local storage of meltwater in subglacial reservoirs.
Study area and generalized geomorphology. The locations of places discussed in the text are marked.

Lithostratigraphy in the Preglacial Valleys
Deposits in the preglacial valleys of the study area are described in three major facies.
Facies 1 occurs throughout the study area, both in the preglacial valleys and on the Prairie surface. It is composed of massive, fissile, clayey, bluish-gray diamicton which often interfingers with thrust, bedrock or is sheared, or diapirically intruded into the overlying younger facies (Reference Munro and ShawMunro and Shaw, 1997; Figs 3 and 4). Erratic clasts transported by continental Laurentide ice appear first in these beds and record initial Laurentide glaciation in the region. Most clasts are striated, faceted, or bullet-shaped, indicating they were transported by this ice sheet. Clasts are weakly oriented, probably as the result of the widespread disturbance.
Properties of Facies 1 indicate it is likely lodgement till (cf. Reference Dreimanis and SchlüchterDreimanis, 1982; Reference ClarkClark and Hansel, 1989). Although clast fabric relates to post-depositional disturbance and gives no indication of ice direction, fold noses in thrust bedrock indicate that flow was towards the southwest. A similar till extends over much of southern Alberta and is named the Labuma Till and, although there is much argument over its age (cf. Reference Harris and WatersHarris and Waters, 1977), it is inferred here, on the basis of stratigraphy, and spatial relationships, to be late Wisconsinan. This age is supported by evidence for a single continental glaciation in other parts of Alberta, both up-glacier and down- glacier from the study area (Reference Liverman, Catto and RutterLiverman and others, 1989; Reference Young, Burns, Smith, Arnold and RainsYoung and others, 1994; Reference Jackson, Little, Leboe and HolmeJackson and others, 1996).
Facies 2 (Fig. 2) is complex with multiple interbedded subfacies. Subfacies include thick units (metres) of compact, silty diamicton and massive diamicton with rip-up clasts (Fig. 3). Beds of this subfacies are thinner (tens of cm thick) in the top 10 m of Facies 2, where they commonly occur as part of rhythmically bedded sequences (Fig. 3a). Sorted pebble and cobble beds, rippled sand, rhythmically bedded silt and clay, and laminated silt, sand and clay are also common (Figs 3a and 4). While Facies 2 continues over the entire length of McGregor Reservoir, Travers Reservoir and the Little Bow River exposures, subfacies are limited to 200 m in length. Contacts between subfacies may be gradational, but most are abrupt. While the lowermost beds of Facies 2 are intensely sheared, faulted, and folded (Fig. 5), the upper beds are undisturbed (Fig. 6) Laminated and rhythmically bedded silt of Facies 2 grades upwards into, and interfingers with, Facies 3 (Figs 4 and 6). Cross-cutting shear planes document multiple phases of thrusting southward and southwestward. Facies 2 is restricted to the preglacial valley system (Fig. 2). It is at least 70 m thick in places (e.g. Fig. 7), but this may be exceeded where the lower contacts are not exposed.
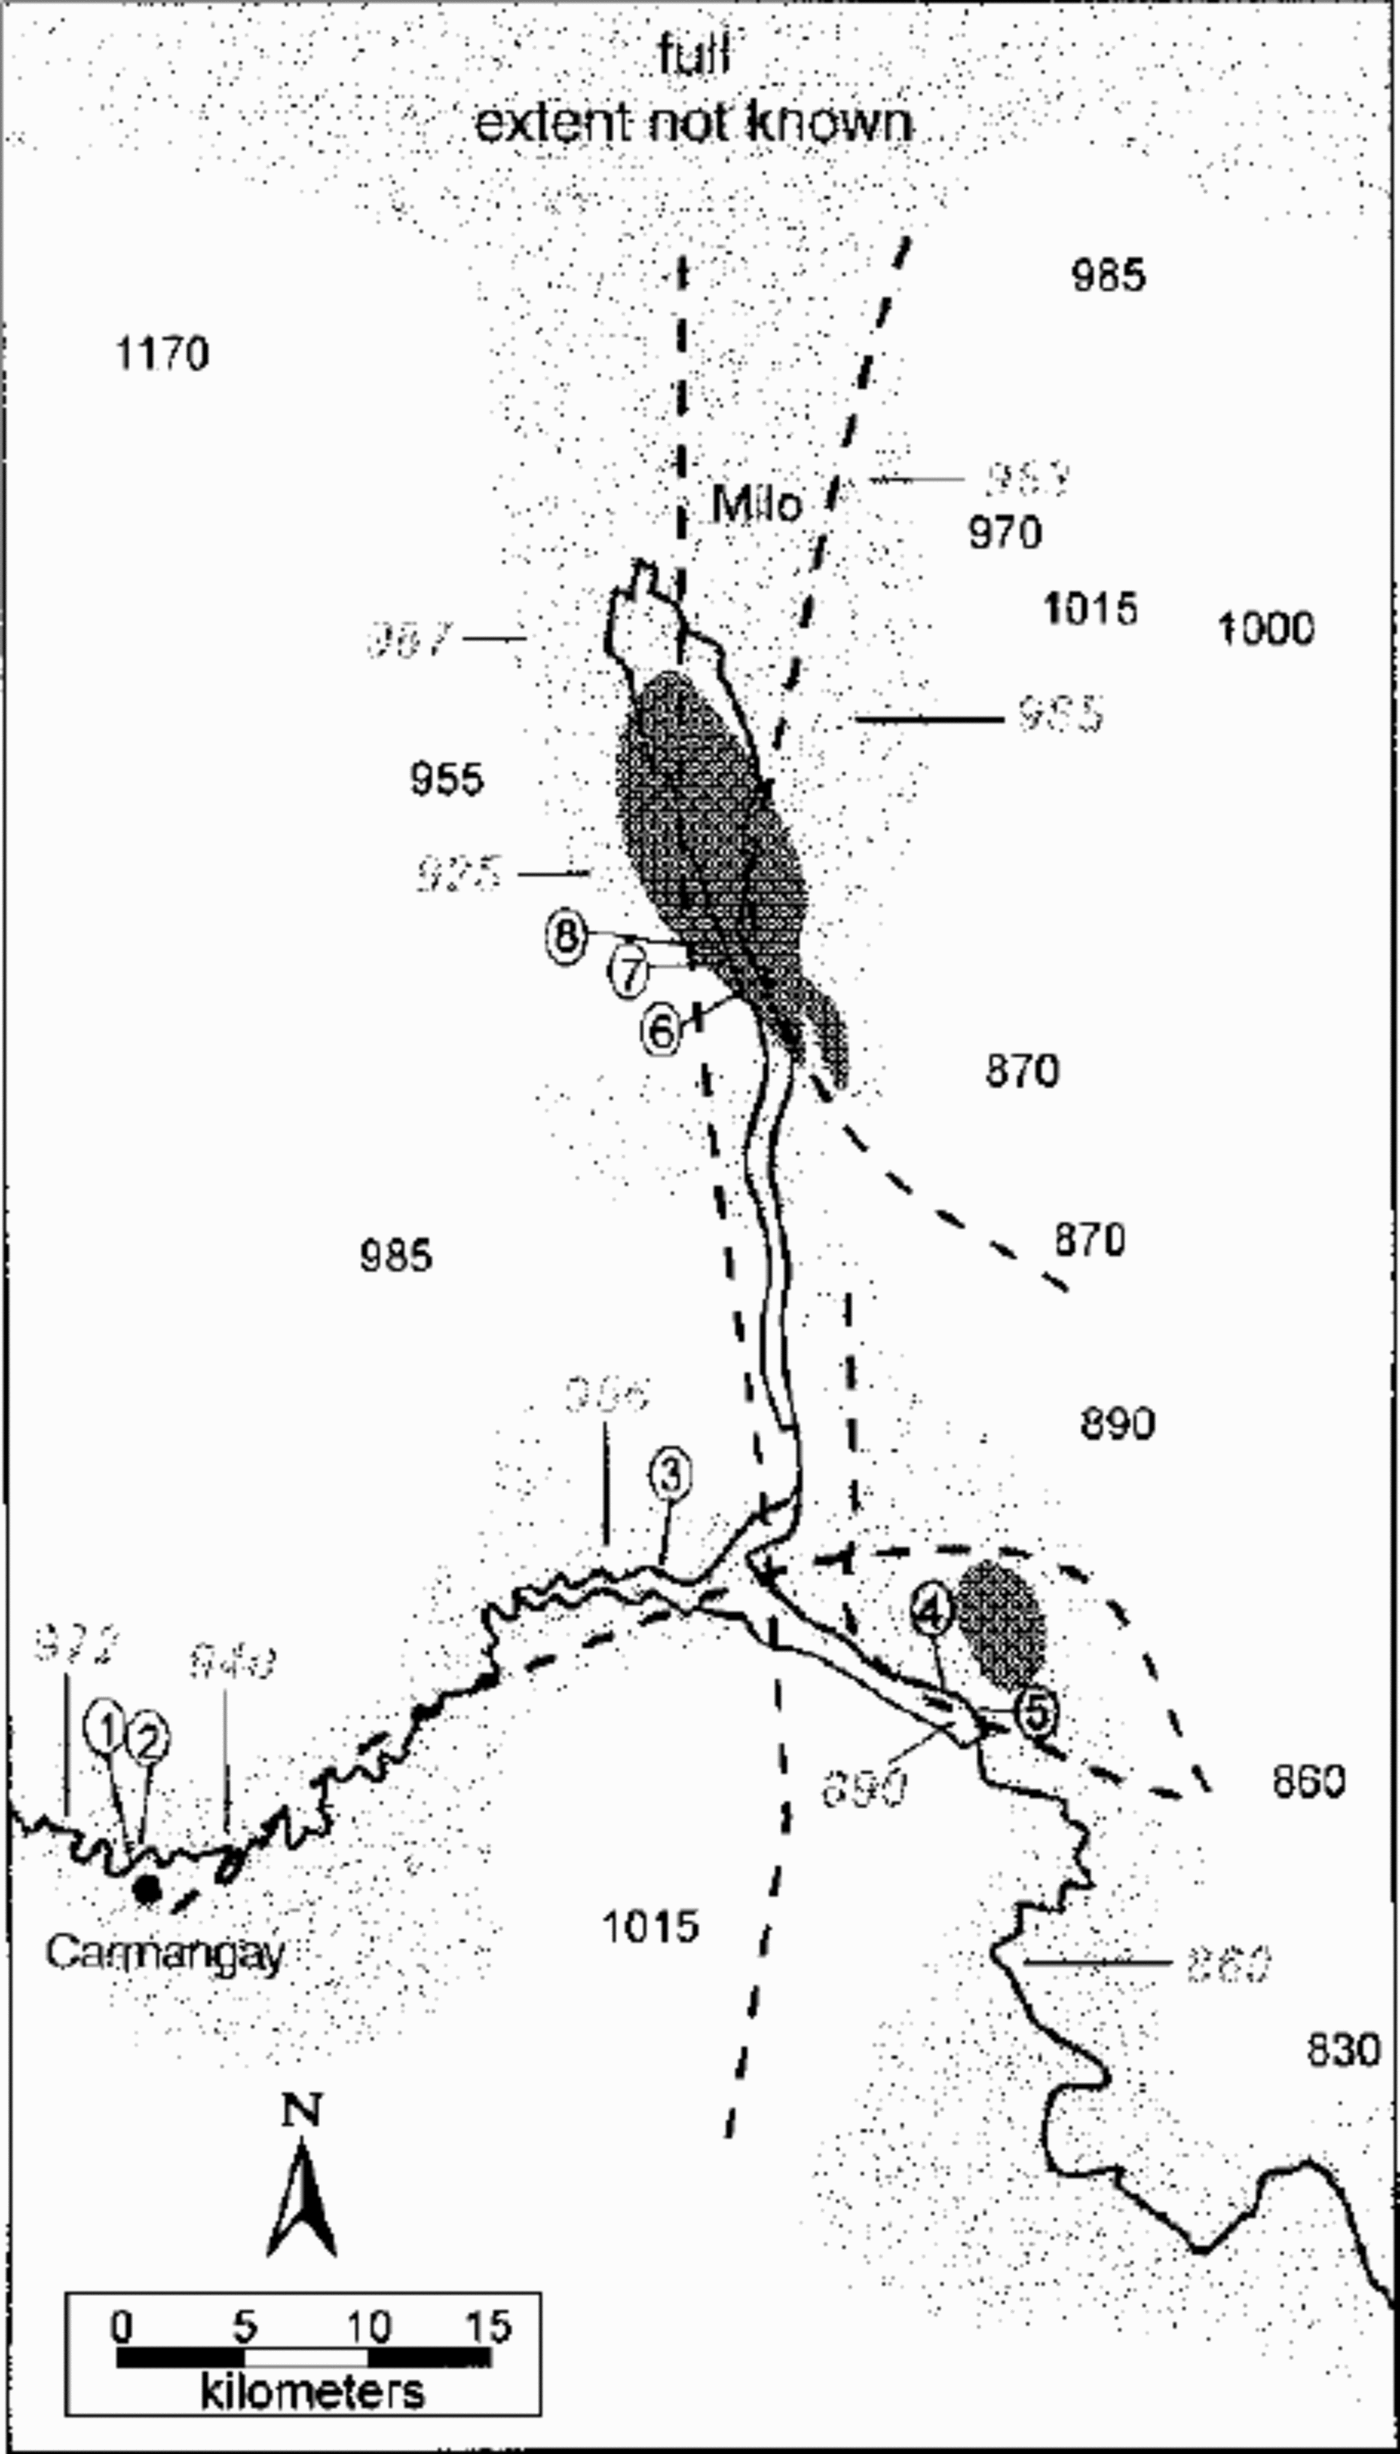
Distribution of Facies 2 (light gray) and Facies 3 (dark gray). Transects in Figure 4 are marked in circles. Elevations (m) of Facies 2 are shown in italics. Topographic elevations are also shown. Dashed lines are the preglacial valley thalwegs (Reference GeigerGeiger, 1967).
(a) Sediments typical of gravity flows in Facies 2. Silty diamictons with rip-up clasts are draped by silt laminae and load underlying silt laminae (arrows). Large rip-up clasts have been rolled along for some distance and rounded. (b) Typical rip-up clasts of rhythmically bedded clays within massive silty diamictons.

Sedimentary logs through exposures at Carmangay, Travers Reservoir and McGregor Reservoir. Fabric plots with principal eigenvalues are shown for each unit where a sample was obtained. Palaeoflowsfrom sorted sediments are indicated as arrows.

Typical exposure from sheared zone at base of Facies 2: (1) is intact bedding of Facies 2; and (2) shows multiple rafts of Facies 1, which have subsequently been incorporated into Facies 2. Double-ended arrow points out a major plane of movement. A sense of direction was not obtained.

Contact between Facies 2 (lower light sediment) and Facies 3 (upper dark sediment). Units from both facies are interbedded for approximately 1.5m.

Abrupt transitions between subfacies are typical of complex depositional subaqueous environments fed by seasonally varying glacial meltwater (Reference Rust, Romanelli, Jopling and McDonaldRust and Romanelli, 1975). Sediment input varied both spatially and temporally, and high-magnitude events are recorded by turbidites with thick sets of ripple cross-lamination and debris-flow deposits. Intervening periods of low-sedimentation rates are documented by silt and clay rhythmites, representing deposition from suspension. Turbidites, debris-flow deposits with rip-up clasts and suspension deposition, are common to glacial-lake environments. Ice was either proximal to, or in direct contact with, sediments during deposition of the entire sequence, as documented by slumping, folding, shearing and the large volume of sediment in the system.
Facies 3 is largely restricted to McGregor Reservoir (Fig. 2). It conformably overlies, and interfingers with, beds of Facies 2 (Figs 4 and 6). Two main sediment types are present: laterally extensive, massive, fine-grained diamicton beds of about the same thickness (5–15 cm); and thin (several grains to a few mm thick) beds of sand that grade continuously southward over a distance of about 1 km to thicker silt beds (2–15 cm). The diamicton and sorted beds are conformable and alternate in rhythmic sequences (Fig. 6b). Boulders are infrequent, and rest on sand-filling scours which cross-cut underlying beds (Reference Munro and ShawMunro and Shaw, 1997). Analysis of 38 clast fabric samples from the diamicton beds shows principal eigenvalues generally > 0.65 (Fig. 4) (Reference Munro and ShawMunro and Shaw, 1997) and significant clustering of long axes towards the east-northeast (Fig. 8).
Plot of mean dip directions of the 38 clast fabrics Obtained from Facies 3. The average dip is ENE.

A subglacial melt-out origin is interpreted for Facies 3 for the following reasons. Strongly oriented clasts indicate a regional ice flow from the east-northeast (Reference Munro and ShawMunro and Shaw, 1997). Although such trends may result from lodgement (e.g. Reference BennBenn, 1995), subglacial or englacial melt-out (e.g. Reference LawsonLawson, 1979; Reference ShawShaw, 1979), or deformation (e.g. Reference Benn and EvansBenn and Evans, 1996), preservation of delicate sand and silt beds suggests deposition by passive melt-out (cf. Reference ShawShaw, 1979). As well, clast dips lie at low angles, often with bimodal directions, as expected for melt-out tills (Reference LawsonLawson, 1979). Furthermore, scours below boulders indicate flowing water beneath the ice sheet and suspension of the boulders by overlying ice (Reference ShawShaw, 1982).
Facies 2: Proglacial or Subglacial?
Facies 2 represents an ice-proximal or ice-contact glaciola-custrine environment. A water body accounting for the sediment distribution and elevation would not have existed proglacially, since several topographically lower areas extending from the McGregor and Travers Valleys in all directions (Fig. 2) are not underlain by lacustrine deposits. Small lakes could have existed proglacially, such as at Carmangay, provided an ice dam blocked eastward drainage through the large meltwater channel, presently occupying the Tee Pee preglacial valley. It is, however, more difficult to block drainage in the McGregor Valley. To maintain a proglacial lake there, an ice dam would have to exist to the north of McGregor Reservoir. \et, lacustrine sediments in the McGregor Valley reach elevations of >980ma.s.l. (Fig. 2). A proglacial lake could not have existed at this elevation, given lower elevations in the Travers Reservoir region, and both to the east and the west immediately south of the main body of McGregor Reservoir (Fig. 2). Only a very large proglacial lake, covering most of southern Alberta, could explain lacustrine sediments at 980ma.s.l. The area of this lake would have been ~104 km2 . This estimate is conservative: lake levels could have been tens of metres higher than the observed sediments. The absence oflacustrine sediments and extensive shorelines questions the existence of such a lake. Furthermore, a proglacial lake at ~985ma.s.l. would have drained by way of tunnel channels that cross the Milk River Ridge drainage divide approximately 150 km to the southeast, at an elevation of ~910 m (personal communication from C. Beaney, 1998).
More importantly, sedimentary evidence points to a subglacial origin of Facies 2. Silt beds in Facies 2 conformably grade into, and interfinger with, Facies 3 for approximately 1.5 m (Fig. 6). Consequently, there must be a genetic and environmental relationship between the two facies and continuity in sedimentation. As Facies 3 represents subglacial till, if the lake was proglacial, ice must have advanced and retreated several times over the lake sediments to produce the interbedded silts and till. Loading by advancing ice should result in some shearing and deformation, but the contact zone is undeformed.
An alternative explanation is provided that can account for both the spatial distribution and the elevation of the deposits in their present topographic location. Laminated silt (Fig. 6) is interpreted as the product of sedimentation into subglacially stored water. Facies 3 (Fig. 7) is interpreted as resulting from direct basal deposition when the water drained and ice recoupled with its bed. The reservoir alternately filled with water resulting in the deposition of laminated silt, and drained bringing the ice near, or onto, its bed, resulting in till deposition. Each time when the reservoir refilled, the water depth was either significantly shallower or the length of storage was shorter, documented by the thinning upwards of each set of silt laminae. This alternation of processes continued until the primary mode of deposition was by direct basal melt-out. The fill-drainage cyclicity continued at a smaller scale during the deposition of the till, as documented by the alternation of diamicton beds and sorted strata.
Over 70 m of sediment is present at Carmangay (approximately 40 m are observed in this photograph). The lower 60 m belongs to Facies 2, although large diapirs of “Labuma Till”are intruded into it. Light sediment at the top of the exposure consists of proglacial rhythmites which unconformably overlie Facies 2 (Fig 4). An aeolian cap covers the rhythmites. Locations of transects in Figure 4 are also noted.

Nature of the Subglacial Reservoirs
After initial ice advance into south-central Alberta, water began to pond below the ice in the McGregor and Tee Pee preglacial valleys. The areal extent of ponding is recorded by the distribution of Facies 2 (Fig. 2). The depths of these reservoirs are unknown, but based on sediment thickness they are estimated to have been up to 40 m deep at McGregor Reservoir, and up to 80 m deep at Carmangay and Travers Reservoir. Phases of minimal water input, recorded by thin silt and clay rhythmites, most likely represent diurnal, seasonal, or annual variations in supraglacial meltwater supply. Yet, at other times, large volumes of water flowed into the system, as indicated by thick debris flows, and thick sequences of turbidites. Multiple palaeoflow directions (Fig. 4) suggest water was delivered from several sources. Drainage events completely emptied the reservoir(s) during the time of Facies 2 deposition. Such events are documented by shearing which indicates bed recoupling. Rafts of Facies 1 incorporated into Facies 2, record periods of grounded ice and complex subglacial tectonics. At this time, density instabilities caused by elevated pore-water pressures in the fine-grained till (facies1), resulted in diapirism into the overlying sediments.
Facies 2 distribution indicates that the McGregor and Travers areas lay beneath a single, large subglacial lake. Following drainage events, when the reservoirs were not at full capacity, ice was pinned on the higher ground separating McGregor Reservoir from Travers Reservoir, splitting the large lake into two smaller ones.
Since there is no shearing or deformation of beds deposited in the last phases of Facies 2, there was little or no ice movement. This was also the case for Facies 3. As Facies 3 is only observed in two locations, it is suggested that most of the McGregor subglacial lake drained, but the larger lake at Travers Reservoir was sustained.
It is proposed that small-scale drainage events continued during the deposition of Facies 3 at McGregor Reservoir, resulting in deposition of thin sorted beds. Diamicton beds document sedimentation by direct melt-out, and rain- out, both through a laterally extensive but shallow water body, never more than 20 cm deep (determined by the thickness of the diamicton strata). The water must have been stored as sudden release of the water was needed to produce the discrete beds of sorted sediment between diamicton beds. The laterally extensive beds cannot represent channelized flow at the base of the ice, which would have produced discrete lenses of sorted material (Reference ShawShaw, 1982). Neither do they represent melting out of debris-rich layers in the ice (Reference ShawShaw, 1979), as the beds are sorted. Water was stored under high pressure, forcing it to spread out laterally at the base of the ice (cf. Reference NyeNye, 1976; Reference WeertmanWeertman, 1986). Drainage occurred when a connection to another cavity or the ice front was made. Thus, small reservoirs drained into the larger subglacial lake that occupied the Teepee preglacial valley. The north to south fining in the sorted beds of Facies support this important conclusion.
Discussion
Based on the known areal extent of Facies 2 (Fig. 2), the minimum area of the proposed subglacial lake at McGregor Reservoir is estimated at 378 km2. The average observed thickness of Facies 2 at McGregor Reservoir is 20 m, and hence a conservative estimate of 20–40 m water depth is adopted. Thus, the calculated minimum volume of the subglacial lake is 8–15 km . This is comparable to the maximum volumes of Grimsvötn, Iceland, at any time over the last 60 years (Reference Gudmundsson, Bjornsson and PalssonGudmundsson and others, 1995). The minimum area of the subglacial lake at Travers Reservoir is 232 km2. Sediment thicknesses are greater there, with an average of 58 m at the western end of the system (estimated 58–78 m water depth), and 30 m at the eastern end of the system (estimated 30–50 m water depth). The minimum volume of the subglacial lake at Travers Reservoir was 10— 16 km3.Since the exact spatial extent of Facies 2 is unknown, estimates of lake volume are probably conservative.
Few authors have inferred the presence of subglacial lakes under ancient ice sheets. Reference GjessingGjessing (1960) interpreted a sequence of incised terraced deposits in Norway as remnants of sedimentation in a subglacial chamber. Lacustrine deposition was in isolated depressions, with subglacial channels leading from them at relatively high elevations. As well, Reference McCabe and CofaighMcCabe and Ó Cofaigh (1994) interpreted a thick prograding sequence of glaciolacustrine sediments in Ireland as subglacial, based on conformable relationships with an overlying subglacial till. They also argued that the elevation of the deposits, relative to the drainage network, required that the lake be subglacial as a proglacial lake would have drained. Also, subglacial lakes are known to be under ice sheets in Iceland (e.g. Reference Gudmundsson, Bjornsson and PalssonGudmundsson and others, 1995) and Antarctica (e.g. Reference Oswald, de and RobinOswald and Robin, 1973), although their presence is generally related to geothermal effects. Theoretically, subglacial lakes are predicted to form at topographic lows and where the relationship 11a < y is not met, where a is the ice-surface gradient, and y is the bed slope (Reference ShoemakerShoemaker, 1991). As evidence in southern Alberta and south of the border points to very low (almost flat) ice-sheet surfaces, this condition is easily met at the present study site.
Large volumes of meltwater stored below the Laurentide ice sheet in the region can also explain other observations. For instance, the ice would have lifted off a significant portion of the bed, substantially reducing basal shear stress and elevating the shear stress where the ice was pinned. This probably resulted in local ice-flow acceleration and thrusting over the grounded areas. The presence of water, either as a film above the clayey tills of the Prairies or within the tills, has been suggested for the rapid ice movement (e.g. Reference Boulton, Smith, Jones and NewsomeBoulton and others, 1985). Here, however, it is suggested that the presence of stored water in the preglacial valley network may have been as important to ice-flow acceleration as the presence of deformable beds. Importantly, ice flow was rapid at the time of the subglacial lakes. This conclusion is supported by multiple-shearing events when the lakes drained.
Conclusions
Sediment distribution, topography and conformable relationships between glaciolacustrine sediments and subglacial till suggest that relatively large subglacial reservoirs were maintained below the Laurentide ice sheet within the preglacial valley network of southern Alberta. Extensive shearing in punctuated events between periods of lake sedimentation indicates that these unstable lakes filled and drained often. Also, while one lake (Travers) continued to fill and drain, another (McGregor) drained significantly and never re-established itself, although small-scale fill— drainage cycles continued throughout till deposition. It is therefore suggested that in the present study area, the preglacial valley network formed a large, interconnected cavity system beneath the Laurentide ice sheet.
Although this study only addresses two main preglacial valleys in south-central Alberta, the preglacial drainage network is regionally extensive (Reference GeigerGeiger, 1967). If many valleys stored water below the Laurentide ice sheet, then these would have had significant influence on the dynamics of the Laurentide ice sheet. Hence, sedimentary studies are recommended to estimate the regional significance of subglacial reservoirs.
Acknowledgements
This research was supported by a Natural Science and Engineering Research Council grant toj. Shaw and by the Geological Society of America. F. Henderson, L. Sankeralli, D. Sjogren, E. Sjogren, D. Stasiuk and S. Gordon are thanked for field assistance. C. Beaney, T. Fisher, D. Lemmen, B. Rains and J. Shaw are thanked for their comments on this manuscript and on earlier versions.



