Implications
In this study, we have demonstrated that supplementation with commercially relevant concentrations of FM is sufficient to alter the innate and acquired immune response of pregnant and lactating ewes. The implications of this immunomodulation warrant further investigation in the context of disease resistance and vaccine efficacy.
Introduction
During the past 150 years, the n-6 : n-3 fatty acid (FA) ratio of Westernized diets has shifted from ∼1 : 1 to 15 : 1, largely due to the increased consumption of vegetable oils (McDaniel et al., Reference McDaniel, Belury, Ahijevych and Belury2010). This shift in FA ratio has been associated with an increase in a number of disorders including inflammatory diseases such as cardiovascular disease, arthritis, psoriasis and colitis (Kearns et al., Reference Kearns, Hayek, Turek, Meydani, Burr, Greene, Marshall, Adams, Borgert and Reinhart1999; McDaniel et al., Reference McDaniel, Belury, Ahijevych and Belury2010), and various neuroendocrine conditions such as childhood developmental disorders (Schuchardt et al., Reference Schuchardt, Huss, Stauss-Grabo and Hahn2010), adult depression (Riemer et al., Reference Riemer, Maes, Christophe and Rief2010), anxiety (Yehuda et al., Reference Yehuda, Rabinovitz and Mostofsky2005) and loss of cognitive function (Muldoon et al., Reference Muldoon, Ryan, Sheu, Yao, Conklin and Manuck2010).
Given the association between n-3 FA : n-6 FA ratio and a growing number of human diseases, health conscious consumers have begun supplementing their diets with fish oil capsules and/or fortified products containing n-3 FA (Shaikh and Edidin, Reference Shaikh and Edidin2008). In order to meet this niche market, numerous livestock producers have been incorporating n-3 FA enriched supplements such as fish meal (FM) into livestock diets to produce ‘value-added products’ like n-3 FA enriched milk (Gómez-Cortés et al., Reference Gómez-Cortés, Bach, Luna, Juárez and de la Fuente2009). As neuroendocrine–immunomodulatory effects have been demonstrated in humans supplemented with n-3 FA (Calder, Reference Calder2006; Michaeli et al., Reference Michaeli, Berger, Revelly, Tappy and Chioléro2007), there is reason to believe that similar effects might also be seen in livestock that are being supplemented with FM.
Since the long-term implications of dietary supplementation with FM during a ruminant production cycle remain to be determined, the objectives of this study were to determine if FM supplementation during pregnancy and lactation, two critical health periods of the ruminant production cycle, alters the innate and acquired immune response as well as neuroendocrine function.
Material and methods
Animal housing and diet formulation
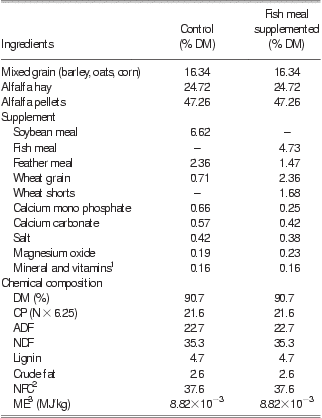
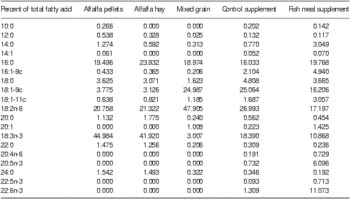
Forty Rideau-Arcott ewes were used in a randomized complete block design study that was conducted over time to facilitate animal housing and sample collection. There were five blocks each containing eight ewes randomly assigned to either the FM supplemented (n = 5 × 4) or soybean meal (SBM) supplemented control diet (n = 5 × 4). Ewe pregnancy was confirmed by ultrasound at 30 day post-breeding and treatments were subsequently balanced for litter size. Twin-bearing ewes were given preference for the study, representing ≅0.600 of population. When triplet-bearing ewes were used, representing ≅0.280 of ewes, a lamb was removed from each litter at birth to help to control nutrient demand on the ewe during lactation. The animals were individually penned, and fed the dietary supplement from gestation day 100 (gd100) through to lactation day (ld50) with ad libitum access to water. Ewes were fed twice daily at 0800 and 1600 h, and received 2.64 kg/day before lambing; the diet comprised of 0.312 kg supplement, 0.441 kg mixed grain, 0.630 kg chopped hay and 1.261 kg alfalfa pellets. After lambing ewes received 3.90 kg/day, and the diet was comprised of 0.455 kg supplement, 0.652 kg mixed grain, 0.931 kg chopped hay and 1.862 kg alfalfa pellets. Feeding was carried out according to the management practice and feed formulation reported by Or-Rashid et al. (Reference Or-Rashid, Fisher, Karrow, AlZahal and McBride2010); Special Select™ Menhaden meal (Omega Proteins, Hammond, LA, USA) was the source of FM for this study (Table 1). Feather meal (Masterfeeds, London, Ontario, Canada) was incorporated into the supplement portion of the diet at levels reported in Table 1 to provide rumen protection. The FA profile of the dietary components is reported in Table 2. The study was conducted at the Ponsonby Sheep Research Facility of the University of Guelph, Ponsonby, Ontario, Canada, and was approved by the University of Guelph Animal Care Committee. The time line of procedures carried out on the ewes within each block is illustrated in Figure 1. The offspring born to the ewes used in this study were weaned at 50 days and their health status was assessed as part of another study (Fisher et al., Reference Fisher, Or'Rashid, Pant, McBride, Boermans and Karrow2009). Their birth and weaning weights were unaffected by either dietary treatments, or the lipopolysaccharide (LPS) challenge (data not shown).
Diet and nutrient composition on a % DM basis for the diet fed to ewes with SBM control and FM supplements detailed
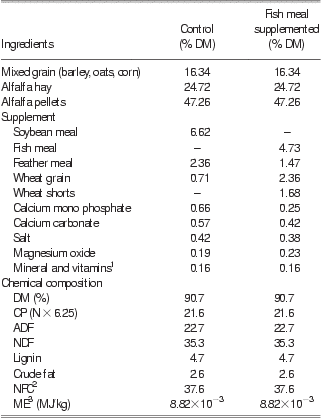
DM = dry matter; SBM = soybean meal; FM = fish meal; NFC = non-fiber carbohydrate.
The following are presented as % DM: CP, ADF, NDF, lignin, crude fat and NFC. Adapted from Or-Rashid et al. (Reference Or-Rashid, Fisher, Karrow, AlZahal and McBride2010).
1Master Feeds Inc., London, Ontario, Canada.
2Non-fibre carbohydrates = 100 − [(NDF − neutral detergent insoluble protein) = CP = crude fat = ash].
3Calculated using the Cornell Net Carbohydrate and Protein System for sheep (CNCPS-Sheep v.1.0.21, Cornell University, Ithica, NY, USA) using chemical analysis.
Fatty acid composition of various diet components: alfalfa pellets, alfalfa hay, mixed grain (barley, oats and corn), the soybean meal Control supplement and fish meal supplements given as content/100 g

Time line of procedures carried out with all pregnant and lactating sheep supplemented with fish meal (FM) or soybean meal (SBM).‘LPS’ represents the day the lipopolysaccharide challenge was carried out (n = 10 FM + LPS, n = 10 FM + saline, n = 10 SBM + LPS, n = 10 SBM + saline); ‘Sensitization’ represents the day ewes were sensitized to the novel antigen hen egg white lysozyme (HEWL; n = 20 FM, n = 20 SBM); and ‘CHR’ represents the day ewes were challenged with HEWL to assess the cutaneous hypersensitivity response (CHR; n = 20 FM, n = 20 SBM).

Assessment of the febrile, respiratory and neuroendocrine response to systemic LPS challenge during pregnancy
On gd135, between 0800 and 2200 h, two 18 h fasted ewes from each FA treatment within each of the five blocks were iv challenged with 1.2 μg/kg of Escherichia coli 0111:B4 LPS (Sigma Chemical Co., St. Louis, MO, USA); the remaining two fasted control ewes within each FA treatment received saline. Rectal temperature was measured hourly using a conventional digital thermometer in order to assess the febrile response to LPS challenge, and a stethoscope was used hourly to monitor the respiratory rate. Blood was collected from the jugular vein immediately before, and 1, 2, 4 and 6 h post LPS challenge to obtain serum and plasma. All animals were fed their respective diets within 8 h post LPS challenge. For serum collection, blood samples were allowed to clot at room temperature for 60 min, and centrifuged at 2500 × g for 15 min to obtain serum for cortisol analysis. For ACTH and FA analysis, blood was collected in heparinized vacutainers and immediately centrifuged as described above to obtain plasma. Both serum and plasma were stored at −80°C for later analysis.
Serum cortisol concentrations were determined immediately before LPS challenge and during the peak response measured 4 h post challenge; the peak response time was previously established by Kabaroff et al. (Reference Kabaroff, Rodriguez, Quinton, Boermans and Karrow2006a). An IMMUNLITE Cortisol-PILKCO-6 competitive chemiluminescent enzyme immunoassay kit, purchased from Diagnostic Products Corporation (Los Angeles, USA) was used to determine serum cortisol concentrations. Optical densities (OD) were detected using an IMMULITE 1000 analyzer (INTER MEDICO, Markham, Ontario, Canada). The detection limit of the assay was 28 nmol/l, and the average coefficient of variation for three control samples was 0.100.
Plasma ACTH concentrations were measured immediately before LPS challenge and 1 and 2 h post challenge using a commercially available chemiluminescence enzyme-linked immunosorbent assay (ELISA) kit (Calbiotech, Spring Valley, California, USA). The OD readings were measured in triplicate using a Wallac 1420 VICTOR 3 MULTILABEL COUNTER (Perkin Elmer, Wellesley, MA, USA). The limit of detection was 1.0 pg/ml. The inter- and intra-plate coefficient of variation was 0.069 and 0.079, respectively.
FA concentrations were measured in plasma samples using an Agilent 6890N GLC (Agilent Technologies, Palo Alto, CA, USA) according to Or-Rashid et al. (Reference Or-Rashid, Fisher, Karrow, AlZahal and McBride2010); these samples were collected on gd135 immediately before the LPS challenge.
Assessment of haptoglobin (Hp) response to hen egg white lysozyme (HEWL) sensitization during lactation
On ld20, all FM and SBM ewes in each block were sensitized im to a novel antigen, 0.5 mg HEWL (Sigma Aldrich, St. Louis, MO, USA) along with 0.5 mg Quil A (Ballerup, Denmark) adjuvant dissolved in 1 ml of physiological saline, split into two im gluteal injections. Jugular blood samples were collected for Hp analysis before sensitization and 1, 2, 3 and 4 days post sensation into heparinized vacutainers and centrifuged at 2500 × g for 15 min. Plasma was removed and stored at −80°C.
Free Hp analysis was performed by the University of Guelph Animal Health Laboratory, Guelph, Ontario, Canada using an ELISA developed by Makimura and Naoyoshi (Reference Makimura and Naoyoshi1982). The average coefficient of variation for this assay is 0.042.
Assessment of acquired immune response to HEWL during lactation
On ld30, all FM and SBM control ewes in each block were challenged on a shaved area of one side of the neck with an id injection of 300 μg HEWL dissolved in 200 μl of saline (HEWL challenge site) and an id injection with 200 μl of saline about 0.10 m away from the HEWL challenge site (control site); thus, each animal acted as its own control to demonstrate that they responded to the HEWL challenge. The change in skin-fold thickness over time was used as an indicator of the cutaneous hypersensitivity response (CHR). Triplicate skin-fold measurements were taken before challenge and 2, 4, 6, 24, 48 and 72 h post challenge with a skin-fold caliper (Model RH15 9LB, Creative Health Products Inc., Ann Arbor, Michigan, USA), and were averaged for the analysis.
Blood samples were also collected on ld20, 30 and 41 in order to obtain serum to measure basal immunoglobulin G (IgG), and the primary and secondary IgG response to HEWL. The antibody response to HEWL was quantified using an indirect ELISA method described previously by Begley et al. (Reference Begley, Bucklet, Burnside, Schaeffer, Pierce and Mallard2008) for cattle and modified and optimized for use in sheep. High-affinity binding 96-well microtiter plates (Corning, Acton, MA, USA) were coated with 100 μl of 1.44 mg/ml HEWL dissolved in carbonate-bicarbonate buffer (pH 7.4). The plates were incubated at 4°C for 48 h, then washed thrice with 300 μl of 10 × 5−4 ml/100 ml Tween 20 in PBS wash buffer (pH 7.4) using a MW 96 well Microplate washer (Beckman Coulter Inc., California, USA). Plates were then blocked with blocking buffer (pH 7.4) containing 0.03 ml/100 ml Tween 20, 10 × 15−3 ml/100 ml fetal bovine serum (FBS) and 0.015 g/ml bovine serum albumin (BSA; Sigma Aldrich, St. Louis, MO, USA) for 60 min at room temperature. Plates were washed thrice, and triplicate serum samples, diluted with wash buffer to two different dilutions (1/1600 and 1/3200), were added and allowed to incubate for 1 h. Following incubation, plates were washed again before conjugate rabbit anti-sheep IgG (Cederlane PN A130-101AP) was added. The rabbit anti-sheep IgG was diluted with 1/4000 in Tris-conjugate buffer (pH 7.4) that contained 0.024 g/ml Tris, 0.08 g/ml sodium chloride, 0.002 g/ml potassium chloride and 10 × 5−4 ml/100 ml Tween 20. This was allowed to incubate for 2 h before being washed. Finally, alkaline phosphatase yellow substrate (80 μl per well, Sigma Aldrich, St. Louis, MO, USA) was incubated for 30 min and the OD was measured at 405 nm using a Wallac 1420 VICTOR 3 MULTILABEL COUNTER (Perkin Elmer, USA). Standard curves were generated using pooled day 21 serum at serial dilutions of 1/200, 1/400, 1/800, 1/1600, 1/3200, 1/6400, 1/12 800, 1/25 600 and 1/51 200. The HEWL-specific IgG response was estimated by the OD values generated by the assay. The OD values were corrected to an OD = 1.0 as described previously (You et al., Reference You, Karrow, Cao, Rodriguez, Mallard and Boermans2008). The OD readings were normalized among plates by using a correction factor (CF) described below:
 $${\rm{CF}}\,{\rm{ = }}\,\frac{{\matrix {\vskip 1pt{\rm{Overall \, mean}}\;{\rm{(1/1600}}\,{\rm{ + }}\,{\rm{1/3200)}}\;{\rm{of \, reference}}\cr\vskip -4pt{\rm{samples}}\,{\rm{from}}\,{\rm{all}}\,{\rm{plates}}}}}{{\matrix{\vskip 5pt{\rm{Actual}}\,{\rm{mean}}\;{\rm{(1/1600}}\,{\rm{ + }}\,{\rm{1/3200)}}\,{\rm{of}}\,{\rm{individual}}\cr{\rm{plate}}\,{\rm{reference}}\,{\rm{sample}}}}$$
The mean of corrected OD (COD) for each serum sample dilution was calculated as seen below, and used in statistical analysis.
 $${\rm{COD}}\,{\rm{ = }}\,{\rm{(1/1600}}\;{\rm{or}}\;{\rm{1/3200}}\;{\rm{sample}}\;{\rm{OD}}\;{\rm{reading)}}\,\times \,{\rm{CF}}$$
The average intra-plate coefficient of variation for the assay was 0.036 and the average inter-plate coefficient of variation was 0.099.
Statistical analysis
The study was analyzed as a randomized complete block design with five blocks, eight ewes per block and four ewes in each dietary treatment. There were two dietary treatment groups, SBM and FM for all experiments, except for the LPS trial in which two ewes from each diet received LPS and two received saline in a 2 × 2 factorial arrangement. Repeated measurements over time were included in the model for all variables, including the LPS-induced febrile, respiratory, cortisol and ACTH responses, Hp response to antigen sensitization, CHR response to HEWL and anti-HEWL-IgG response.
All data analysis was performed using the mixed procedure from SAS (version 9.2) and the approach given by Wang and Goonewardene (Reference Wang and Goonewardene2004) was used for the repeated measurements. Residual plots were examined for evidence of heterogeneity, and a natural log transformation was performed to stabilize the variance where necessary, which was the case for all variables except for the LPS rectal temperature and respiration data. The initial time measurement was not included in the analysis, but measurements at all subsequent times were expressed as a change from the initial or basal time. Significance was indicated by a P-value of <0.05 and trends in the data were indicated by P-values ranging from 0.06 to 0.10.
Linear and quadratic orthogonal polynomial contrasts were used to assess changes over time for all variables except for anti-HEWL-IgG response, and interaction contrasts of these with treatments were used to assess differences in the time trends between the treatments. The Tukey test was used to detect differences between treatment-by-time interaction means for the anti-HEWL-IgG response, because this variable was only measured at three times. A separate analysis was also performed for the time zero Hp levels in order to evaluate differences in basal circulating levels, and for the plasma FA concentrations.
Results
Diet effects on FA composition of plasma
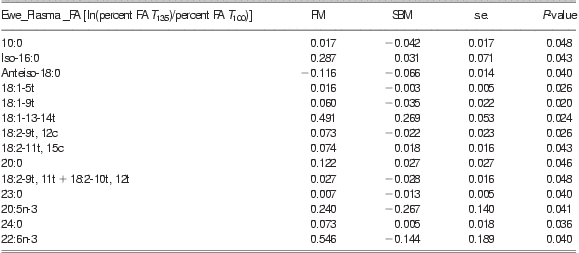
The plasma from ewes supplemented with FM contained higher proportions of the anti-inflammatory FA eicosapentaenoic acid (EPA; 20:5n-3, P = 0.04) and docosahexaenoic acid (DHA; 22:6n-3, P = 0.04) compared with ewes supplemented with SBM, and there was also a trend favouring a greater proportion of α-linolenic acid (ALA; 18:3n-3, P = 0.09; Table 3). There were no treatment related differences in the pro-inflammatory n-6 FA linoleic acid (LA; 18:2n-6, P = 0.85) and arachidonic acid (AA; 20:4n-6, P = 0.62, data not shown), and for 18:2-9c11t and 18:2-10t12c (data not shown).
Least squares means ± s.e. of the plasma FA in pregnant ewes, supplemented with SBM (n = 6) or FM (n = 6) that were significantly enriched between gd100 (T 100) to gd135 (T 135)
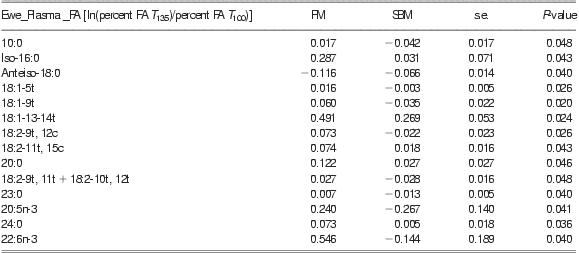
FA = fatty acids; SBM = soybean meal; FM = fish meal; gd = gestation day.
Values are presented as the ln[(measured FA ÷ total of the measured FA on T 135) ÷ (measured FA ÷ total of the measured FA on T 100)].
Febrile, respiratory, cortisol and ACTH response to LPS challenge during pregnancy
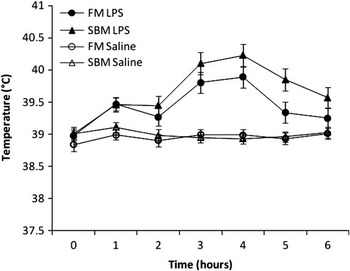
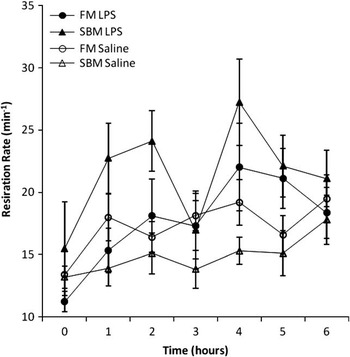
Three ewes were removed from the trial following the LPS challenge (2 SBM supplemented ewes and 1 FM supplemented ewe) owing to various health concerns; the 2 SBM ewes, each from different blocks, developed intramammary infections, and the FM ewe aborted her lambs after the LPS challenge. Of the remaining ewes, all responded to the LPS challenge when compared with the saline control ewes for each diet supplement as indicated by their average febrile (P < 0.01), respiratory (P < 0.01), cortisol (P < 0.01) and ACTH (P < 0.01) responses. The febrile response to LPS challenge peaked around 4 h post challenge (Figure 2) and differed between diet treatments over time (P < 0.01). A biphasic trend in the respiratory response was noted during the LPS challenge, with a dip at the third hour, 1 hour before peak fever response (Figure 3). Both FM (P = 0.04) and SBM (P = 0.04) supplemented ewes that had been challenged with LPS had a quadratic respiratory response over time that differed from their respective saline control ewes, and the average difference in the response to LPS challenge in the FM treatment had an attenuated trend compared with the SBM treatment (P = 0.07). Finally, the cortisol (P = 0.52) and ACTH (P = 1.00) responses did not differ between the two diet treatments (data not shown).
Least squares means ± s.e. of febrile response of ewes on gd135 in response to Lipopolysaccharide (LPS) or saline challenge. Ewes were supplementated with either fish meal (FM) or soybean meal (SBM) (n = 10 FM + LPS, n = 10 FM + saline, n = 10 SBM + LPS, n = 10 SBM + saline). FM ewes showed a significant linear response over time (P = 0.001) and SBM ewes showed a significant quadratic response (P = 0.001). The solid symbols represent LPS challenged animals and open symbols represent control animals. Triangle symbols represent SBM animals and open symbols represent FM supplemented animals.

Least squares means ± s.e of respiration rate of ewes on gd135 in response to Lipopolysaccharide (LPS) or saline challenge. Ewes were supplemented with either fish meal (FM) or soybean meal (SBM) (n = 10 FM + LPS, n = 10 FM + saline, n = 10 SBM + LPS, n = 10 SBM + saline). The within-treatment difference between control and LPS challenged ewes tended to be larger in the SBM group compared with the FM group (P = 0.07). The solid symbols represent LPS challenged animals and open symbols represent control animals. Triangle symbols represent SBM and circular symbols represent FM supplemented animals.

Hp response to HEWL sensitization during lactation
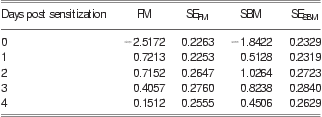
Basal plasma Hp concentrations were lower in FM v. SBM supplemented ewes (P < 0.01; Table 4). The Hp response to HEWL sensitization also differed over time between dietary treatments, with the SBM supplemented ewes exhibiting a quadratic response (P < 0.01) and the FM supplemented ewes displaying a linear response over time (P < 0.01; Table 4).
Least squares means ± s.e. of basal haptoglobin concentration (g/l) and the change in haptoglobin concentration in response to sensitization with HEWL in FM and SBM supplemented ewes during lactation (n = 20 FM, n = 20 SBM)
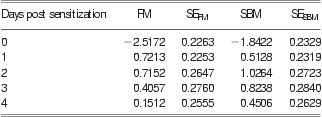
HEWL = hen egg white lysozyme; FM = fish meal; SBM = soybean meal.
Note: Day 0 haptoglobin levels were higher in the SBM group than the FM group (P < 0.01). Untransformed means were 0.0807 g/l in the FM group and 0.1585 in the SBM group. The FM group had a linear response over time (P < 0.01), whereas the SBM group had a quadratic response over time (P < 0.01). Concentrations for day 0 are natural log transformed, ln(T 0). Concentrations for days 1 to 4 are expressed as a proportion of the initial time point and natural log transformed ln(Tx/T 0). Average proportions at days 1, 2, 3, 4 in the FM (SBM) groups were 2.05 (1.67), 2.04 (1.30), 1.58 (1.32), 1.16 (1.29).
Contact hypersensitivity response (CHR) to HEWL during lactation
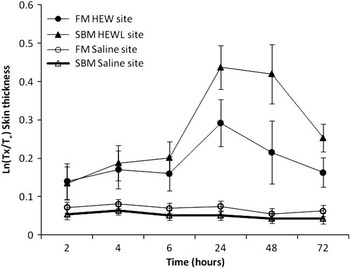
All animals responded to the HEWL challenge with significant increases in the CHR (P = 0.01), and treatment differences in the CHR were observed (Figure 4). The CHR to HEWL was quadratic (P < 0.01) in the FM group, whereas the SBM group responded with a linear increase in skin-fold thickness response over time (P < 0.01).
Least squares means ± s.e. of the change in skin-fold thickness (natural log transformed) during the contact hypersensitivity response to hen egg white lysozyme (HEWL). The lactating ewes were supplemented with either fish meal (FM) or soybean meal (SBM; n = 20 FM, n = 20 SBM). The FM ewes had a significant quadratic response (P = 0.001) and the SBM ewes had a significant linear response (P = 0.001) over time. The solid symbols represent HEWL challenged sites, whereas the open symbols represent saline control sites on the same animal. The solid symbols represent HEWL challenged sites and the open symbols represent control sites. Triangle symbols represent SBM and circular symbols represent FM supplemented animals. The skin thickness data were recorded over time in mm (Tx) and expressed as a proportion of the initial measurement (T 0).

Primary and secondary IgG response to HEWL during lactation
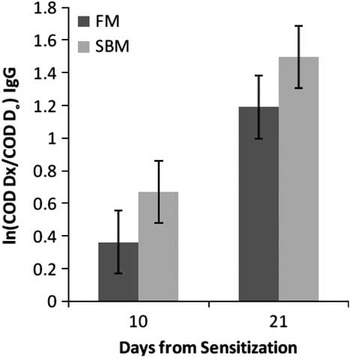
All animals responded to HEWL, with the FM group showing an increasing trend during the primary IgG response (P = 0.07) and the SBM group showing a significant primary response (P = 0.01) in comparison to basal IgG. Both the FM (P < 0.05) and SBM (P < 0.05) treatments exhibited a significant secondary IgG response; however, treatment differences were not observed between the FM and SBM supplemented ewes (Figure 5).
Change in anti-hen egg white lysozyme (HEWL)-IgG response 10 days (primary antibody response) and 21 days (secondary antibody response) post-HEWL sensitization in fish meal (FM) and soybean meal (SBM) supplemented lactating ewes (n = 20 FM, n = 20 SBM). Values are presented as least squares means ± s.e. (natural log transformed) of the change in corrected optical density (COD). Significant differences in the primary and secondary antibody response to HEWL were not observed between treatments.

Discussion
This study was designed to examine aspects of the innate and acquired immune response and neuroendocrine response of pregnant and lactating ewes that were supplemented with FM. The results presented within suggest that both the innate and acquired immune response, but not neuroendocrine response, were affected by dietary supplementation with FM compared with the control diet containing SBM, and this could have important health implications for animals on such diets. The innate febrile response to LPS, for example, was attenuated over time in the FM supplemented ewes during pregnancy in comparison to ewes fed the SBM control diet. The implications of this attenuated response warrant investigation, as the febrile response plays an important role in antimicrobial defense and in regulating an efficient immune response (Roth, Reference Roth2006).
There was also a trend in the average change in the respiration rate between FM and SBM animals after LPS challenge, with a slightly higher respiration rate found in the SBM supplemented animals. This response appeared biphasic with a dip in respiration rate at 3 h post challenge, occurring 1 h before the peak febrile response. It is possible that this represented a physiological attempt to restore thermoregulation and possibly to detoxify LPS (Colditz, Reference Colditz2002; Munford, Reference Munford2005).
It was interesting to note that during lactation, significantly lower basal Hp concentrations were observed in the FM fed ewes compared with the SBM treatment, and a quadratic Hp response was observed over time in the FM fed ewes, whereas a linear response was observed in the SBM control ewes. The implications of altered basal and inducible Hp concentrations observed in the present study in response to FM supplementation also warrants further investigation, as Hp is a major positive hepatic acute phase protein (APP) in ruminants (Eckersall and Bell, Reference Eckersall and Bell2010). Murine studies have demonstrated that Hp is also expressed in other immune-related tissues such as the lung, skin, spleen (Sadrzadeh and Bozorgmehr, Reference Sadrzadeh and Bozorgmehr2004), and it has recently been found to be a major protein in bovine granulocytes (Cooray et al., Reference Cooray, Waller and Venge2007). Hp has diverse physiological functions that include the following: promoting angiogenesis; regulating immune cell function and differentiation; and sequestering hemoglobin, which subsequently prevents iron-stimulated oxygen radical formation, reduces bacterial growth by reducing the bioavailability of iron and inhibits prostaglandin production (reviewed by Sadrzadeh and Bozorgmehr, Reference Sadrzadeh and Bozorgmehr2004).
Finally, in the context of acquired immunity during lactation, the CHR to HEWL also differed between dietary treatments. In this study, HEWL was used as a novel antigen to assess the primary and secondary antibody response, as well as the CHR in sheep. This antigen has been previously used to assess antibody mediated immune response (AbMIR) in cattle (Heriazon et al., Reference Heriazon, Yager, Sears and Mallard2009), which is important for fighting extracellular pathogens. However, HEWL has also been used to assess cell-mediated immunity (CMI) in mice characterized in the form of a delayed-type hypersensitivity (DTH) response (Sakato and Fujio, Reference Sakato and Fujio1986); the CMI provides protection against intracellular pathogens and tumor cells. Although the primary and secondary antibody responses to HEWL were not significantly different between FA treatments, significant attenuation of the CHR to HEWL was demonstrated in ewes fed the FM supplement, and this implies that some aspect of the CMI was attenuated by FM.
Although macronutrients in the two diet formulations were matched in this study, it was not possible to match all nutrients between these diets. This needs to be taken into consideration when establishing causality to the observed immune changes. Marine feed sources, for example, are generally higher in undegradable, highly digestible proteins when compared with plant feed sources like SBM, and some of these proteins may affect immunity (Israf et al., Reference Israf, Coop, Stevenson, Jones, Jackson, Jackson, MacKellar and Huntley1996; Cho and Kim, Reference Cho and Kim2010). In contrast, SBM also contains unique immunomodulatory compounds that are not found in FM such as genistein and Bowman-Birk inhibitor (Dia et al., Reference Dia, Berhow and Gonzalez De Mejia2008). Marine and terrestrial plant food sources may also differ in vitamin D and selenium concentrations (Hoffmann and Berry, Reference Hoffmann and Berry2008; Di Rosa et al., Reference Di Rosa, Malaguarnera, Nicoletti and Malaguarnera2011; Larsen et al., Reference Larsen, Eilertsen and Elvevoll2011), though we do not believe this to be an issue in this study.
We hypothesize that the immunomodulatory effects observed in this study are due to n-3 FA in the FM supplement. The profile of certain plasma FAs, for example, was altered during this study as indicated by the enrichment of n-3 FAs (ALA, EPA and DHA) but not n-6 FAs (LA and AA) from gd0 to gd135 in ewes fed the FM diet. However, to test this n-3 hypothesis, dose–response studies will have to be carried out in a future study using pure FAs. A previous enrichment study conducted by our group also showed n-3 FA enrichment in the milk of ewes that had been fed a FM diet during pregnancy and lactation and this diet was formulated in the same manner (Or-Rashid et al., Reference Or-Rashid, Fisher, Karrow, AlZahal and McBride2010). The amount of FM supplementation that was used in this study is comparable to amounts used by the dairy industry to produce n-3 enriched milk (Wright et al., Reference Wright, Holub, Hill and McBride2003), and FM as opposed to fish oil is typically used to prolong the shelf-life of supplements and to improve feed pelleting.
In support of the proposed n-3 hypothesis, a number of studies have demonstrated that n-3 FAs and supplementation with fish oil can affect the immune system. Human studies, for example, have demonstrated that fish oil attenuated the febrile response to LPS challenge (Michaeli et al., Reference Michaeli, Berger, Revelly, Tappy and Chioléro2007; Pluess et al., Reference Pluess, Hayoz, Berger, Tappy, Revelly, Michaeli, Carpentier and Chioléro2007), and this coincided with significant attenuation of the tumor necrosis factor (TNF)-α response (Pluess et al., Reference Pluess, Hayoz, Berger, Tappy, Revelly, Michaeli, Carpentier and Chioléro2007). The febrile and TNF-α response to LPS challenge was also attenuated in pigs that were supplemented with n-3 FA in their diet (Gabler et al., Reference Gabler, Spencer, Webel and Spurlock2008). Although no reports of n-3 FA-mediated changes in blood Hp concentration can be found in the literature, a human study recently documented that high n-3 FA intake reduced C-reactive protein, another important positive hepatic APP of humans (Tsitouras et al., Reference Tsitouras, Gucciardo, Salbe, Heward and Herman2008).
A number of studies have reported that the acquired immune response is also influenced by n-3 FAs, but the response is complex and appears to be dependent on the antigen, species and strain of species. A study by Hogenkamp et al. (Reference Hogenkamp, van Vlies, Fear, van Esch, Hofman, Garssen and Calder2011), for example, recently demonstrated that fish oil promoted the T-helper cell 1 CHR to influenza vaccination in C57BL6 mice, whereas the T-helper 2 CHR response to chicken egg ovalbumin (OVA) was attenuated in BALB/c mice. In contrast, another BALB/c mouse study demonstrated that the T-helper cell 1-mediated CHR to OVA was attenuated, whereas the OVA-specific T-helper 2-mediated IgE response was exacerbated (Johansson et al., Reference Johansson, Lönnqvist, Ostman, Sandberg and Wold2010). In the context of ruminants, it has been demonstrated that the CHR and IgG antibody response to OVA was greater in cows fed whole flaxseed in comparison to control cows and cows fed microencapsulated fish oil (Caroprese et al., Reference Caroprese, Marzano, Entrican, Wattegedera, Albenzio and Sevi2009).
Finally, the present study found no evidence of neuroendocrine changes (ACTH and cortisol) occurring in pregnant ewes as a result of the dietary supplementation with FM. In contrast, dietary supplementation with DHA or fish oil has been demonstrated to lower blood cortisol concentrations in patients with major depressive disorder (Jazayeri et al., Reference Jazayeri, Keshavarz, Tehrani-Doost, Djalali, Hosseini, Amini, Chamari and Djazayery2010), and to attenuate the ACTH and/or cortisol response of healthy men to LPS challenge (Michaeli et al., Reference Michaeli, Berger, Revelly, Tappy and Chioléro2007; Pittet et al., Reference Pittet, Berger, Pluess, Voirol, Revelly, Tappy and Chiolero2010). There are a number of possible reasons for this data discrepancy. First, it is possible that the LPS challenge dose used in the present study was too high to detect subtle changes in neuroendocrine function in sheep, as we have historically used a challenge dose of 400 ng/kg as opposed to 1.2 g/kg to assess their neuroendocrine function (Kabaroff, Reference Kabaroff, Rodriguez, Quinton, Boermans and Karrow2006a); the rationale for choosing this LPS dose was that it had to induce fetal stress in order to examine the protective effects of FM supplementation on fetal programming, and a previous study performed by our group demonstrated that this dose induced fetal stress and affected programming of the ovine hypothalamic–pituitary–adrenal axis (Fisher et al., Reference Fisher, Karrow, Quinton, Finegan, Miller, Atkinson and Boermans2010). Second, it has been previously demonstrated that sheep are hyperadrenal cortisol responsive to LPS during this stage of pregnancy, possibly due to fetal cortisol secretion (Kabaroff et al., Reference Kabaroff, Boermans and Karrow2006b). Given this, it is also possible that FM supplementation was not sufficient to attenuate the combined effects of maternal and fetal ACTH and cortisol secretion.
Conclusion
The results presented herein demonstrate that supplementation with a commercially relevant concentration of FM is sufficient to alter the innate and acquired immune response of pregnant and lactating ewes. The implications of this immunomodulation warrant further investigation in the context of disease resistance and vaccine efficacy.
Acknowledgments
The authors would like to thank the staff at Ponsonby Sheep Research Station, Ponsonby, Ontario for their help during the feed trial, Dr Margaret Quinton, Animal and Poultry Science, University of Guelph, for her help with the statistical analysis and Dr Ousama AlZahal for formulating the diets. This research was supported by funds provided by the Ontario Ministry of Food and Rural Affairs, the Agriculture Adaptation Council and the Ontario Sheep Marketing Agency.