Introduction
There is an ongoing debate as to whether or not second language (L2) learners process sentences similarly to native speakers and whether this depends on the linguistic structure under investigation (Clahsen & Felser, Reference Clahsen and Felser2006a, Reference Clahsen and Felserb; Dussias & Piñar, Reference Dussias, Piñar, Ritchie and Bathia2009; Kroll & Dussias, Reference Kroll, Dussias, Bhatia and Ritchie2004). For example, Clahsen and Felser (Reference Clahsen and Felser2006a, Reference Clahsen and Felserb) argue that L2 learners can achieve native-like processing in the domain of lexical semantics and in the processing of local dependencies, such as subject–verb agreement and gender concord within the noun phrase, but they differ from native speakers in the way they process non-local dependencies, such as wh-dependencies involving empty categories. This has formed the basis for the Shallow Structure Hypothesis (SSH) according to which “the L2 grammar does not provide the type of syntactic information required to process non-local grammatical phenomena in native-like ways” (Clahsen & Felser, Reference Clahsen and Felser2006b, p. 565).
Native-like L2 processing seems to be influenced also by several participant-based variables, such as proficiency, working memory (WM) capacity, and linguistic immersion through naturalistic exposure (Dussias & Piñar, Reference Dussias, Piñar, Ritchie and Bathia2009). There is strong evidence that L2 proficiency is an important factor for L2 syntactic processing (Frenck-Mestre, Reference Frenck-Mestre, Altarriba and Herridia2002; Hahne, Reference Hahne2001; Hopp, Reference Hopp2006; Jackson, Reference Jackson2008) and there is also some evidence that L2 learners’ WM capacity can influence their real-time L2 syntactic processing (Dussias & Piñar, Reference Dussias and Piñar2010; Havik, Roberts, van Hout, Schreuder & Haverkort, Reference Havik, Roberts, van Hout, Schreuder and Haverkort2009; Williams, Reference Williams2006). However, there is very limited evidence of the effect of naturalistic L2 exposure on syntactic processing. The present study aims to fill this gap by investigating L2 syntactic processing in two groups of L2 English learners – L2 learners with only classroom exposure and L2 learners with an average of nine years of naturalistic exposure to the L2 – which were additionally compared to a group of native speakers of English. We investigated how these two groups of L2 learners process sentences with long-distance dependencies, such as in (1).
(1) The politician whoi / the journalist predicted / e′i that / the government report / would bother ei / is calling a press conference. (from Gibson & Warren, Reference Gibson and Warren2004, p. 75)
In this example, according to generative theories, there is a long-distance dependency between the wh-word (who) and the verb in the embedded clause (bother), which is mediated by an empty category (e′i) or gap at the intervening clause boundary (successive cyclic movement). According to the Trace Reactivation Hypothesis (TRH; Love & Swinney, Reference Love and Swinney1996), in sentences involving long-distance dependencies, the parser postulates empty categories (e) or gaps during online comprehension.Footnote 1 In example (1), the presence of the embedded clause requires an empty category or gap mediating the long-distance dependency (intermediate gap; e′i) at the boundary of the clause (i.e. before the complementiser that). According to the Active Filler Hypothesis, when the parser identifies a filler, it postulates empty categories at each successive grammatically legal position and takes them as gap for this filler (Clifton & Frazier, Reference Clifton, Frazier, Carlson and Tanenhaus1989). In long-distance dependencies, this can create multiple gaps that break the long-distance dependency into smaller ones, which are easier for the parser to process. Gibson and Warren (Reference Gibson and Warren2004) found that intermediate gaps assist native speakers of English in processing sentences with displaced wh-phrases. This was reflected in shorter RTs at the final gap in sentences with an intermediate gap compared to sentences with extraction, but without an intermediate gap, providing evidence for cyclic reactivation of the filler at both gaps. Gibson and Warren claimed that an intermediate gap mediates processing of long-distance wh-dependencies, because it permits the early integration of the fronted wh-phrase, thus, facilitating its ultimate integration at the subcategorising verb. However, similar effects were not found for learners of L2 English with restricted naturalistic exposure (Dallas & Kaan, Reference Dallas and Kaan2008; Marinis, Roberts, Felser & Clahsen, 2005) and have been used as evidence for the SSH. Thus, the aim of this study was to find out whether L2 learners with a great deal of naturalistic exposure to the L2 will show evidence of processing intermediate gaps.
L2 processing of wh-movement
A growing number of studies has investigated sentence processing in L2 learners (Jiang, Reference Jiang2007; Papadopoulou & Clahsen, Reference Papadopoulou and Clahsen2003; see also Papadopoulou, Reference Papadopoulou2005 for a review of studies on ambiguity resolution in L2). However, there is a relatively limited number of studies on how L2 learners process sentences involving wh-dependencies. One of the first studies dealing with this issue was the study by Juffs and Harrington (Reference Juffs and Harrington1995). This study tested highly proficient Chinese learners of L2 English compared to native English controls in two grammaticality judgement tasks involving questions with subject and object wh-extractions, as shown in (2) and (3) below.
(2)


(3)

Participants read the sentences word-by-word, and their task was to indicate whether the sentences were grammatical, while their accuracy and reaction times (RTs) were recorded.
According to the TRH, when reading (2) and (3) online, the parser hypothesises initially in both sentences a gap after the matrix verb think and tries to integrate the wh-word what as the object of this verb. However, in (3) the NP the car makes it immediately clear that what is not the object of think. The parser has to introduce a subordinate clause as the object of the matrix verb and analyse the wh-phrase as the object of the verb of the embedded clause crash. In (2), on the other hand, the gap after the matrix verb must be reanalysed from an object gap of the matrix clause to a subject gap of the embedded clause, and therefore, the whole phrase structure needs to be reconsidered. L2 learners showed longer RTs in the region following the matrix verb in the subject compared to the object extraction condition. Juffs and Harrington suggested that the L2 difficulty in processing subject extraction reflected a difficulty in reanalysing the wh-phrase. They suggested that in sentence (2), L2 readers postulated a gap after think and analysed what as the object of the verb. Upon encountering the embedded clause, they had to reanalyse what, a process that inflicted additional cognitive cost, which was present but less profound also in native speakers. Consequently, Juffs and Harrington suggested that proficient L2 learners have access to L2 syntactic information, and the difficulty they demonstrate lies in the lack of wh-movement in their first language (L1; Chinese), i.e., they are not used to this kind of reanalysis (Juffs & Harrington, Reference Juffs and Harrington1995, Reference Juffs and Harrington1996).
One important limitation of the above study is that it does not provide evidence that the L2 learners’ performance is mediated by gaps from wh-movement or by the verb's lexical information. The processing difficulty observed after the matrix verb could be because the learners postulate a trace or because they attempt to integrate the displaced phrase as the object of the first available verb using subcategorisation information of the verb. Therefore, it is ambiguous as to whether a gap or the subcategorisation of the verb led the learners to integrate the filler at that point. It is also worth noting that the authors compared RTs for a determiner (3) to RTs for a verb (2), and the increased RTs for (2) may be due to the additional information (e.g. lexical) that a verb carries, in comparison to a determiner. Furthermore, the RT data of the object gap in (3) are not directly comparable to those of the subject gap in (2) because the object gap is at the end of the sentence, which could inflict additional wrap-up effects in the last word's RT.
A follow-up study (Juffs, Reference Juffs2005) aimed to correct these issues by adding a few words at the end of the experimental sentences, while controlling for any potential L1 transfer effects and WM limitations. Juffs (Reference Juffs2005) tested highly proficient L2 learners of varied L1 backgrounds (Chinese, Japanese, Spanish) on the same word-by-word reading task as in the Juffs and Harrington (Reference Juffs and Harrington1995) study with sentences like (4) and (5).
(4)

(5)

This study replicated the Juffs and Harrington study in terms of accuracy rates, showing an asymmetry between subject- and object-extraction conditions. With regard to RTs, all three groups showed some difficulty in processing subject extractions, with Japanese learners being the most affected group. This disproved the earlier suggestion (Juffs & Harrington, Reference Juffs and Harrington1995, Reference Juffs and Harrington1996) that Chinese learners have difficulty with wh-movement because it is absent in their own language, because Spanish learners showed a similar pattern of behaviour to Chinese learners although Spanish permits wh-movement.
To investigate how lexical information mediates L2 processing of wh-dependencies, Williams, Mobius and Kim (2001) designed an experiment examining the effects of plausibility information during online processing of wh-dependencies. Williams et al. (Reference Williams, Mobius and Kim2001) used a stop-making-sense task with proficient learners of L2 English whose L1 either permits (German) or does not permit wh-movement (Chinese and Korean). In this task, participants read sentences word-by-word in a self-paced fashion and pressed a button as soon as the sentence stopped making sense. Williams et al. constructed two types of sentences by manipulating the plausibility of the filler as the object of the verb, as shown in examples (6) and (7).
(6)

(7)

Similarly to Juffs and Harrington (Reference Juffs and Harrington1995), Williams et al. expected readers to integrate the filler at the first available gap (after the verb buy), and subsequently to show elevated RTs at the actual object of the verb (the radio), because of the reanalysis that should occur once they realise that the gap was filled. The results showed that both L1 and L2 speakers demonstrated elevated RTs at the object of buy in both conditions, indicating that the gap was filled and that both groups were able to recover from a misanalysis. More interestingly, L1 speakers’ RTs at the determiner of the object were longer in the implausible than in the plausible condition, but this effect was not present in L2 speakers’ RTs. This was taken to indicate that L1 learners start the reanalysis process based on syntactic cues from the determiner which informs the parser that an NP follows, while L2 learners reanalyse only based on lexical information after encountering the noun.
To verify that the pattern attested in Williams et al. (Reference Williams, Mobius and Kim2001) was due to the L2 learners’ failure to process the syntactic cues in the determiner and not to overall slower processing, Williams (Reference Williams2006) conducted a modified version of the above experiment. In this study, he used the sentences from the 2001 study in which he added extra words between the noun and its determiner, shown in (8) and (9).
(8)
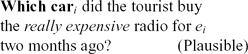
(9)
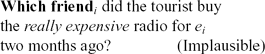
If L2 participants process the syntactic cues similarly to native speakers, albeit later due to slower processing, then increased RTs should be found in the region after the determiner and prior to the noun (really expensive). On the other hand, if they ignore the syntactic cue from the determiner and reanalyse on the basis of the noun (radio), then effects similar to those reported in the previous study should appear at the region of the noun. The results showed that both groups had longer RTs before the noun indicating that the reanalysis started after the determiner and before the noun. This suggests structurally-, rather than lexically-driven parse, and therefore the results are not in accordance with the SSH. Additionally, both groups were equally sensitive to plausibility constraints; both interpreted the words prior to the noun as predictors for the following NP and started the reanalysis process.
A study that attempted to dissociate syntactic from lexically-driven effects in L2 processing was the one by Marinis et al. (Reference Marinis, Roberts, Felser and Clahsen2005). This study followed up on the Gibson and Warren (Reference Gibson and Warren2004) study by comparing native speakers of English to learners of L2 English from L2 backgrounds that either permit (German, Greek) or do not permit wh-movement (Chinese, Japanese). Marinis and colleagues used a self-paced reading experiment similar to the one used by Gibson and Warren but with improved stimuli, in which the sentences were presented segment-by-segment and participants had to answer comprehension questions at the end of each sentence. The native speakers showed the same effect found by Gibson and Warren, namely facilitation at the subcategorising verb when an intermediate gap was present. However, this effect was not demonstrated by any of the four advanced groups of L2 learners irrespective of their L1 background. This led Marinis et al. to suggest that proficient L2 speakers of English are unable to process empty categories in their L2, and although they appear to employ a filler-driven strategy, like the native speakers, their processing is mediated by the lexical properties of the subcategorising verb. Interestingly, all groups were similarly accurate in the comprehension questions. This shows that the processing strategy they employ does not compromise their comprehension ability.
The issue of L2 processing of wh-dependencies was also dealt with by Felser and Roberts (Reference Felser and Roberts2007) using a different methodology. Felser and Roberts used the cross-modal picture priming task from Felser, Roberts, Gross and Marinis (Reference Felser, Roberts, Gross and Marinis2003) to investigate antecedent reactivation of the wh-phrase at the gap, as shown in (10), in Greek learners of L2 English.
(10) John saw the peacocki to which the small penguin gave the nice birthday present ei in the garden last weekend.
Sentences were presented auditorily, and at the site of the indirect object gap a picture of the antecedent (the peacock) or a picture of an unrelated object was presented. At this point, participants were asked to make an aliveness decision by pressing one of two buttons. Felser and Roberts predicted that reactivation of the antecedent at the gap would facilitate RTs for the image of the antecedent compared to the unrelated object, and would cause a priming effect. The priming effect should not be present at a control position prior to the gap. The study showed that native speakers demonstrated the above described priming effect at the site of the indirect object gap but not at the control position. L2 learners, on the other hand, showed sustained activation of the antecedent in both the gap and the control position. Felser and Roberts argued that the results provide evidence for different processing strategies in L1 and L2 speakers: L1 speakers make use of empty categories, whereas L2 learners make use of subcategorisation information when they process wh-dependencies.
On the basis of the findings by Marinis et al. (Reference Marinis, Roberts, Felser and Clahsen2005) and Felser and Roberts (Reference Felser and Roberts2007), Clahsen and Felser (Reference Clahsen and Felser2006a) developed the Shallow Structure Hypothesis (SSH) for L2 processing. According to this hypothesis, L2 learners face certain restrictions when they process sentences in their L2; it is suggested that although L2 learners are ultimately capable of attaining some L2 grammar rules (predominately morphological), they appear to process the syntactic rules of the L2 less successfully, if at all, and rely on lexical rather than syntactic information to comprehend sentences. It is suggested that L2 learners have limited access to the syntactic representations of incoming sentences, which may include hierarchical phrase structure or empty categories, so it is difficult for them to apply structure-based parsing strategies, as the ones required in processing of wh-dependencies. For these reasons, L2 parsing is considered shallow, as it does not take into account ‘deeper’ grammatical structures of the language, but instead relies on more ‘superficial’ lexical information, such as lexical semantics, verb biases, and plausibility.
The SSH has been criticised by several recent studies. Dekydtspotter, Schwartz and Sprouse (Reference Dekydtspotter, Schwartz and Sprouse2006) reanalysed the RT data from the Marinis et al. (Reference Marinis, Roberts, Felser and Clahsen2005) study and found that L2 learners showed a similar effect to the effect observed in native speakers for processing the intermediate gap (Segment 3), albeit at the region following the intermediate gap (Segment 4) (see examples (11)–(14)). This led Dekydtspotter et al. to suggest that L2 learners processed the intermediate gap with some delay. However, the crucial evidence for the intermediate gap in the Marinis et al. study did not come from Segment 3, but from Segment 3 in conjunction with Segment 5 (subcategorising verb). Elevated RTs at Segment 3 were followed by facilitation at Segment 5 when an intermediate gap was present. Although there was an effect at Segment 4, this combination of effects at Segments 3 and 5 was not present in any of the L2 groups. A more plausible explanation for the effect in Segment 4 is that the fronted phrase in both the Extraction-VP and Extraction-NP conditions remained active in WM until it is finally integrated at Segment 5, invoking additional processing cost.
Further criticism was provided by Rodriguez (Reference Rodriguez2008). Rodriguez suggested that the effect at Segment 5 in the Marinis et al. study may have been caused by differences in the length between the two Extraction conditions at Segment 2; the Extraction-NP condition involved a more complex subject NP in Segment 2 than the Extraction-VP condition. To test this hypothesis, Rodriguez added a third Extraction condition (Extraction-GP) that introduced a garden-path effect at Segment 3, in order to create a different type of complexity. Rodriquez tested L2 learners and native speakers in a similar task to the one by Marinis et al. and showed that reading times for Segment 2 in the Extraction-NP condition were longer than in the other two conditions, confirming the difficulty in Segment 2 in the Extraction-NP condition. He also pointed out that Extraction-VP had shorter RTs at Segment 5 than both other conditions, and suggested that it is the degree of sentence complexity that inflates RTs at the subcategorising verb for Extraction-NP and Extraction-GP. However, whereas the difference between Extraction-VP and Extraction-NP at Segment 5 was predictably significant, RTs for Extraction-GP were only numerically longer than Extraction-VP. Therefore, this criticism must be treated with caution because it is hard to determine whether complexity at Segment 2 or 3 would result in increased RTs at the site of the subcategorising verb.Footnote 2
To address the controversy surrounding the processing of intermediate gaps in advanced learners of L2 English, the present study replicated the Marinis et al. study by testing two new groups of advanced Greek learners of English, along with a new group of native speakers of English. To investigate Dekydtspotter et al. claim that L2 learners process intermediate gaps, but their rate of processing is slower than that of native speakers, we analysed and present the analyses of Segments 3, 4, and 5 in each sentence type. Finally, to address whether naturalistic exposure to the L2 affects L2 processing, we manipulated the type of exposure to the L2.
Does the type of exposure affect L2 processing?
Muñoz (Reference Muñoz2008) defines two main types of exposure to the L2: classroom and naturalistic exposure. These types differ from each other in crucial ways. In classroom exposure, L2 learning takes place in a formal and highly structured way in a teaching environment. Any other L2 input is either absent or particularly limited. On the other hand, in naturalistic exposure, L2 input is unrestricted and unstructured, does not artificially focus on specific topics and allows the learner to actively interact with native speakers of the language, without being restricted in a classroom environment. In this sense, the amount and quality of L2 input and practice in a naturalistic environment is significantly different compared to a classroom environment. This could lead to more native-like L2 processing.
A large number of studies have investigated the effect of amount of naturalistic exposure in the acquisition of L2 phonology, but also in other domains – for a recent review, see Flege (Reference Flege, Piske and Young-Scholten2009). For example, Flege and Liu (Reference Flege and Liu2001) showed that university students with 3.9–15.5 years of naturalistic exposure performed better than university students with 0.5–3.8 years of naturalistic exposure in a test assessing the identification of word-final English stops, a test of grammatical sensitivity, and a listening comprehension test. Flege argues that the crucial factor underlying years of naturalistic exposure is the amount of input and argues that the amount of naturalistic exposure can influence L2 acquisition for L2 learners who regularly receive a substantial amount of native-speaker input.
In contrast to the wealth of studies on the effect of the amount of naturalistic exposure on L2 acquisition, very few studies to date have investigated how naturalistic exposure affects L2 processing and whether L2 learners with naturalistic exposure differ from L2 learners with classroom exposure in the way they process sentences in real time. Two important studies are the ones by Frenck-Mestre (Reference Frenck-Mestre, Altarriba and Herridia2002) and Dussias (Reference Dussias2003). Frenck-Mestre (Reference Frenck-Mestre, Altarriba and Herridia2002) used eye-tracking to investigate relative clause (RC) attachment preferences of advanced English–French L2 learners. This study showed that when L1 and L2 preferences are incongruent, L2 learners with little naturalistic L2 exposure (nine months) tend to apply their L1 preferences to the L2. This suggests that lack of naturalistic exposure can lead to transfer of processing strategies from the L1 to the L2. However, with L2 naturalistic exposure of five years, L2 learners’ reading patterns were similar to those of native speakers, indicating similar RC attachment preferences for L1 and L2. These data led Frenck-Mestre to suggest that there is a continuum in processing strategies, from “performance closely tied to the native language of late bilinguals to that closely resembling the performance of native speakers of the language” (Frenck-Mestre, Reference Frenck-Mestre, Altarriba and Herridia2002, p. 228). Crucial factor for this processing “evolution” was the amount of naturalistic L2 exposure.
Similar results were obtained by Dussias (Reference Dussias2003) who investigated RC attachment preferences in Spanish–English and English–Spanish learners in a predominately English environment. Dussias found effects of naturalistic exposure from the L1 to the L2, but also the opposite: L2 RC attachment preferences affected the way learners processed their L1. This led Dussias to suggest that not only L2 naturalistic exposure can result in L1-like RC attachment preferences, but also that in a naturalistic environment L2 RC attachment preferences can affect L1 processing. These suggestions were confirmed by a subsequent study (Dussias & Sagarra, Reference Dussias and Sagarra2007) that compared Spanish–English bilinguals of extended and limited L2 exposure. However, these studies involve processing preferences for adjuncts and not structure-based processing of arguments.
Effects of naturalistic exposure in structure-based processing was investigated more recently by Gillon-Dowens, Vergara, Barber and Carreiras (2010). Gillon-Dowens et al. conducted a study with event-related potentials (ERPs) and showed that L2 learners of Spanish with extensive naturalistic exposure in L2 (average: 22 years) had a similar ERP pattern to native speakers for processing of gender agreement violations. Similarly, Foucart and Frenck-Mestre (Reference Foucart and Frenck-Mestre2011) conducted a series of ERP experiments on the processing of gender agreement violations, and found similar processing patterns among native speakers of French and L2 learners (L1: German), at least for those structures that are common between the L1 and the L2. Interestingly, the L2 learners in these studies had extensive classroom, but not naturalistic exposure to their L2. Foucart and Frenck-Mestre suggested that advanced proficiency and “enough exposure” to an L2 are sufficient to establish native-like syntactic processing. In a subsequent study (Foucart & Frenck-Mestre, Reference Foucart and Frenck-Mestre2012), Foucart and Frenck-Mestre combined ERPs and eye-tracking and showed that participants of a similar profile (high proficiency, extensive formal exposure), but with an L1 (English) that does not share the same features as their L2 (French), can also manifest native-like syntactic processing. On the basis of this evidence, Foucart and Frenck-Mestre suggested that L2 learners can acquire and process new L2 features, irrespective to whether or not these features appear in their L1. However, these studies investigated structure-based processing using a grammaticality violation design and did not address the processing of arguments in grammatical sentences.
The present study
The limited number of studies demonstrating effects of naturalistic exposure in L2 processing largely involved relative clause attachment ambiguity (Dussias, Reference Dussias2003; Dussias & Sagarra, Reference Dussias and Sagarra2007; Frenck-Mestre, Reference Frenck-Mestre, Altarriba and Herridia2002) and investigated the effect of naturalistic exposure to the learners’ preferences. However, evidence of effects of naturalistic exposure in relative clause attachment ambiguity does not warrant that naturalistic exposure will also affect the processing of empty categories and successive cyclic movement. This is because gaps are not evident in the input and sentences containing successive cyclic movement are relatively rare in colloquial naturalistic input.Footnote 3 To date there is a lack of studies investigating whether naturalistic exposure affects the processing of infrequent structures involving empty categories. To address this gap in our knowledge, the present study investigates whether naturalistic exposure to an L2 affects the processing of intermediate gaps. We used the self-paced reading (SPR) technique, in order to follow up on the Marinis et al. (Reference Marinis, Roberts, Felser and Clahsen2005) and Gibson and Warren (Reference Gibson and Warren2004) studies and produce comparable results. If naturalistic exposure affects the processing of structures involving successive cyclic movement similarly to structures involving relative clause ambiguity, highly proficient L2 learners who have spent a considerable amount of time living and working in an L2 environment may process intermediate gaps similarly to native speakers. Moreover, they should perform differently from L2 learners of similar level of proficiency who do not have any L2 naturalistic exposure. This latter group is not predicted to rely on structural information for the processing of long-distance wh-dependencies, but only on lexical information.
Method
Participants
Two groups of Greek learners of English participated in this study: 26 Greek–English speakers with naturalistic exposure (NE) to an English-speaking environment (mean age: 31 years, SD: 3.42, range: 24–38 years) and 30 Greek–English speakers with only classroom exposure (CE) to English (mean age: 27 years, SD: 4.99, range: 16–35 years). Finally, 30 native English speakers (NS) participated as the control group (mean age: 22 years, SD: 5.11, range: 19–38 years). The NE and NS groups were tested in the UK, while the CE group was tested in Greece. Participants in the NE and CE groups were assessed for their proficiency in English with the Quick Placement Tests (QPT) educational software (UCLES, 2001), which provides 20-minute computer-based language tests that assess comprehension skills in English. The participants’ results were presented by the software on a scale from 1 to 5. To ensure that the participants in our study had advanced proficiency in English, we included only learners who scored at 4 or above. Thus, the two groups performed in ranks 4 and 5 (Effective-Mastery proficiency). The score of the NE group was 87.77% (SD: 9.81, range: 83–100%), and that of the CE group was 77.10% (SD: 7.71, range: 68–91%). This is a small but statistically significant difference (F(1,53) = 20.312, p < .001).
A number of factors are crucial to the individual's performance in a second language, such as the age of onset, years of learning the L2 in a classroom setting, amount of naturalistic exposure, amount of daily use of the L2, L1, and other languages and the participant's linguistic environment (Bialystok, Reference Bialystok1997; Grosjean, Reference Grosjean1998). An important inclusion criterion for the NE candidates in our study was to have lived and worked in an English-speaking country for at least five years immediately prior to the experiment. The CE candidates were required not to have lived in an English-speaking country for over a month. A background questionnaire was administered at the beginning of the session to assess these factors.
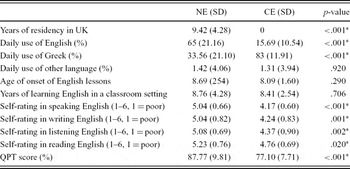
The L2 participants were also asked to rate their speaking, writing, listening, and reading skills in English on a 1–6 scale (1 = poor, 6 = native), because self-ratings have been shown to provide a good indicator of someone's linguistic abilities in an L2 (MacIntyre, Noels & Clément, Reference MacIntyre, Noels and Clément1997). The results of the questionnaire and the participants’ language-related biographical data are summarised in Table 1.
L2 learners’ linguistic background and self-rating (standard deviation).

NE = naturalistic exposure; CE = classroom exposure; QPT = Quick Placement Test; * = significant difference
Table 1 shows that only the NE group had a mean of 9.42 years of naturalistic exposure to English by living in an English speaking country (SD: 4.28, range: 5–24 years) and that the NE group uses English in everyday life significantly more often than the CE group. There is no significant difference between the two groups in the age of L2 onset and the years of learning English in a classroom setting. In terms of their self-ratings, the NE group rated themselves higher than the CE group for all linguistic skills, which is not surprising for a group with an extensive naturalistic exposure in an L2.
Materials
The participants read a total of 150 sentences, 10 of which were practice items, 20 experimental items, and 120 filler sentences. The experimental sentences used were identical to the ones in the study by Marinis et al. (Reference Marinis, Roberts, Felser and Clahsen2005). Each experimental sentence came in four versions, distributed across a 2 × 2 design with the factors Extraction (Extraction/Non-extraction) and Phrase Type (Verb phrase/Noun phrase). This resulted in four experimental conditions, as illustrated in the examples below. A full list of the experimental materials can be found in Marinis et al. (Reference Marinis, Roberts, Felser and Clahsen2005).
(11) [CP The manager [CPwhoi the secretary claimed [CPe′i that the new salesman had pleased ei]] will raise company salaries]. (Extraction across a VP)
(12) [CP The manager [CPwhoi the secretary's claim about the new salesman had pleased ei]] will raise company salaries]. (Extraction across an NP)
(13) [CP The manager thought [CP the secretary claimed [CP that the new salesman had pleased the boss in the meeting]]]. (Non-extraction, with local subject–verb integration – VP)
(14) [CP The manager thought [CP the secretary's claim about the new salesman had pleased the boss in the meeting]]. (Non-extraction, with non-local subject–verb integration – NP)
In the Extraction conditions, the initial NP (the manager) was followed by a relative clause, introduced by a wh-pronoun (who) which was the object of the embedded verb (had pleased). In the Extraction-VP condition, illustrated in (11), the sentences provided an intermediate gap for the wh-pronoun. The verbs in the relative clause were always transitive and were strongly biased towards taking a sentential object, in order to ensure that the filler would not be interpreted as their object.Footnote 4 In addition they were bridge verbs that allow wh-extraction out of their complement clause. In the Extraction-NP condition, illustrated in (12), the sentences were of similar length, but there was no intermediate gap. The distance between the filler and its gap (measured in number of intervening words) was kept constant across all sentences.
In the Non-extraction conditions such as (13) and (14), the sentences had the same number of words with the sentences in the Extraction condition in the critical part of the sentence (up to the embedded verb). The distance between the subject and the verb of the embedded clause in the Non-extraction conditions was similar to the Extraction conditions, but the sentences in the Non-extraction condition did not involve any syntactic displacement.
The experimental, filler, and practice sentences were divided into six segments in the following way:
(15)
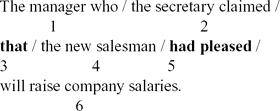
The critical segments of the sentences were Segments 3 and 5. These corresponded to the beginning of the embedded clause and the subcategorising verb. The last segment of each sentence featured a full stop after its last word, to indicate that the sentence was complete. All experimental sentences and 45% of the filler sentences were followed by a comprehension question. This was to ensure that participants pay attention to the sentences and parse them for comprehension. Accuracy in the comprehension question was recorded in order for us to have a measure of how well they comprehended the sentences. Questions were presented along with two potential answers that appeared on the same screen.
The experimental sentences were distributed into four blocks, with each one containing only one version of each experimental sentence. The conditions were distributed evenly across the four blocks, so each of them contained the same number of sentences per condition. The sentences within each block were pseudorandomised and mixed with 60 filler sentences. This resulted in blocks of 80 sentences each. The participants were split into two groups and each group saw two out of four blocks. The two sentence blocks were separated by a short break. Both participant groups saw the same 10 practice items prior to the experiment.
Procedure
The L2 participants were first administered the language background questionnaire and the QPT. Participants with a QPT score of 68 and above continued with the experimental task. The experiment was designed and presented on the E-prime experimental software (Schneider, Eschman & Zuccolotto, Reference Schneider, Eschman and Zuccolotto2002a, Reference Schneider, Eschman and Zuccolottob), which was also tuned to collect accuracy data from the questions and response times from each segment according to the noncumulative moving-window procedure (Just, Carpenter & Woolley, Reference Just, Carpenter and Woolley1982). The sentences were presented in a segment-by-segment fashion in white letters (Courier new, 18 pt) on black background in the centre of a 14-inch CRT monitor (Resolution: 800 × 600, colour depth: 16-bit, refresh rate: 60 Hz), and always appeared in a single line. Participants used the E-prime five-button Serial Response Box with three active buttons: one pacing button, and two response buttons.
The participants were initially presented with oral and written instructions about the task, and could ask questions on the procedure. A 10-item practice session followed, which the participants had the option to interrupt after the fifth item if they were confident with the task. The practice items were followed by the experimental items. Participants were instructed to read each segment as quickly as possible for comprehension and to press the pacing button to move to the next segment. Comprehension questions appeared at the bottom of the screen with two potential answers, one at the right and one at the left. One response button was assigned to the left answers and one to the right answers, and the participants were instructed to press each time the one corresponding to the correct answer. For half of the questions the correct answer was on the right and for the other half it was on the left. The total duration of this experiment was approximately 35 minutes.
Predictions
The critical segments in this experiment are Segments 3 and 5 as well as the intervening Segment 4. Segments 3 and 4 are expected to elicit longer RTs in the Extraction conditions compared to the Non-extraction ones, reflecting storage of the filler in WM. Although Segment 3 is the site of the intermediate gap in the Extraction-VP condition, no difference is expected between the two Extraction conditions (Marinis et al., Reference Marinis, Roberts, Felser and Clahsen2005), because of the WM load that is expected for both conditions.
In Segment 5, all four conditions consist of the same verb, had pleased, as illustrated in (11)–(14). In the two Extraction conditions, this is where the gap is located and where the filler will be integrated. Therefore, RTs in the Extraction conditions are expected to be longer than in the Non-extraction conditions. An additional difference in RTs is predicted to occur between the Extraction-VP and the Extraction-NP conditions. This is because the distance between the filler and the gap in the Extraction-VP condition is shorter than in the Extraction-NP condition if in the Extraction-VP condition the filler has been reactivated at the intermediate gap. Therefore, RTs in this segment in the Extraction-VP condition are expected to be shorter than in the Extraction-NP condition.
Marinis et al. (Reference Marinis, Roberts, Felser and Clahsen2005) found that learners of L2 English with less than two years of naturalistic exposure to English did not show elevated RTs in Segment 3 in the Extraction-VP condition compared to the Non-extraction-VP condition, and also did not show shorter RTs in Segment 5 in the Extraction-VP compared to the Extraction-NP condition. On the basis of these findings, we hypothesise that the CE group will perform similarly to the L2 learners from the Marinis et al. (Reference Marinis, Roberts, Felser and Clahsen2005) study and they will differ from the NS group. If type of L2 exposure plays a significant role in L2 processing of empty categories and successive cyclic movement and increased amount of naturalistic exposure causes native-like processing of long-distance wh-dependencies, we predict that our NE group will show effects similar to those of the NS group. If on the other hand, type of exposure or the amount of naturalistic exposure of our L2 groups do not have a significant impact on L2 learners’ processing of long-distance wh-dependencies, then both L2 groups are predicted to differ from native speakers.
Results
Accuracy
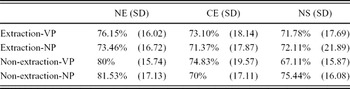
All groups scored quite highly in answering the comprehension questions that followed the sentences. The overall mean accuracy scores were 78% for the NE group, 72.3% for the CE group and 71.6% for the NS group. This shows that our groups were paying attention to the experimental task and that L2 learners were comparable to native speakers.Footnote 5 The mean accuracy scores of the experimental conditions are given in Table 2. To investigate possible effects of fatigue, we conducted a mixed ANOVA with overall accuracy per block as the within-subjects factor (Block 1 and Block 2) and Group as the between-subjects factor (NS, NE, CE). This showed no main effects of Block (F(1,82) = 0.325, p = .570, η 2 = .004) or Group (F(2,82) = 0.623, p = .539, η 2 = .014), and no interactions between them (F(2,82) = 1.280, p = .283, η 2 = .030). To test whether the three groups were equally successful in comprehending the sentences, a mixed three-way repeated measures ANOVA was conducted per subject (F 1) and items (F 2) with Group (NS, NE and CE) as the between-subjects factor and Extraction (Extraction, Non-extraction) and Phrase Type (VP, NP) as the within-subjects factors. The analysis did not reveal any significant effects of Group (F 1(2,82) = 2.007, p = .141, η 2 = .047; F 2(1,19) = 1.410, p = .257, η 2 = .069), Extraction (F 1(1,82) = 1.215, p = .919, η2 < .001; F 2(1,19) = 2.171, p = .157, η 2 = .103), and Phrase Type (F 1(1,82) = 0.010, p = .774, η 2 < .001; F 2(1,19) = 1.178, p = .291, η 2 = .058) or any significant interactions between them. The trials with incorrect answers were excluded from further analyses.
Accuracy scores in percentage per group (standard deviation).

NE = naturalistic exposure; CE = classroom exposure; NS = native speakers
Reaction times
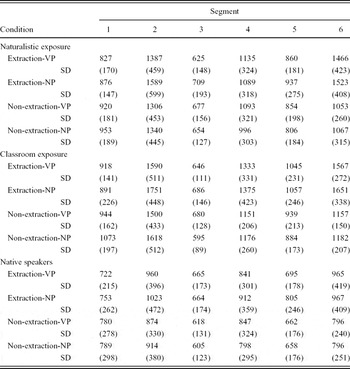
Reaction times were first screened for extreme values and outliers. Extreme values were defined as RTs below 100 ms or above 4000 ms. This affected 1.2% of the NE data, 0.35% of the CE data and 1.98% of the NS data. Outliers were defined as values greater than two standard deviations above or below the mean for each condition per subject and per item. This affected 6.32% of the NE data, 6.63% of the CE data and 6.5% of the NS data. Extreme values and outliers were replaced by the participants’ mean RTs per condition. Finally, the mean RTs of one participant of the CE group were more than 2 SDs above the group mean in all conditions, and therefore, the participants’ data were excluded from further analyses. Table 3 shows the mean RTs for each group per segment and per condition.
Mean RTs in milliseconds (standard deviation) per segment and condition.

There are two critical segments for analysis: Segment 3 that includes the intermediate gap, and Segment 5 that includes the subcategorising verb and the final gap. Because L2 learners process sentences at a slower rate than native speakers, we also analysed Segment 4 for a possible spill-over effect of the intermediate gap.
We first conducted mixed three-way repeated measures ANOVA per subject (F 1) and per item (F 2) for each segment separately with the between-groups factor Group, and the within-groups factors Extraction and Phrase Type. Significant interactions with Group were followed up with separate analyses for each group using two-way ANOVAs with the factors Extraction (Extraction, Non-extraction) and Phrase Type (VP, NP).Footnote 6
Intermediate gap (Segment 3)
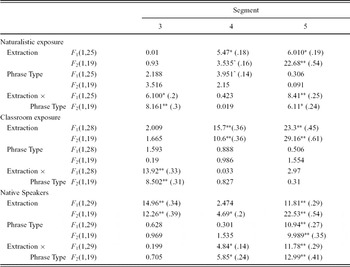
The between-groups ANOVA showed a main effect of Extraction reflecting longer RTs in the Extraction compared to the Non-extraction conditions (F 1(1,82) = 8.216, p = .005, η 2 = .091; F 2(1,19) = 4.841, p = .040, η 2 = .203), and main effect of Group that was significant in the items analysis and was approaching significance in the analysis per subjects, reflecting differences in speed between the groups (F 1(2,82) = 0.377, p = .0687, η 2 = .009; F 2(2,38) = 14.473, p < .001, η 2 = .432). These main effects were qualified by a marginally significant Group × Phrase Type interaction (F 1(2,82) = 2.768, p = .069, η 2 = .063; F 2(2,38) = 2.784, p = .074, η 2 = .128), an Extraction × Phrase Type interaction (F 1(1,82) = 16.174, p < .001, η 2 = .165; F 2(1,19) = 18.564, p < .001, η 2 = .494) and a marginally signi-ficant Extraction × Phrase Type × Group interaction F 1(2,82) = 3.042, p = .053, η 2 = .069; F 2(2,38) = 3.115, p = .056, η 2 = .141). To explore these interactions, we conducted separate analyses for each group using two-way ANOVAs with the factors Extraction (Extraction, Non-extraction) and Phrase Type (VP, NP). Table 4 summarises the results for each segment by group.
Results of ANOVAs on the critical segments per group.

** p < .01, * p < .05, ^ p < .08
Note: Included parentheses in the last three columns are the partial η 2 values for the significant effects.
Native speakers showed a main effect of Extraction indicating that they took more time reading the conditions involving extraction compared to the Non-extraction conditions. There was no main effect of Phrase Type or an Extraction × Phrase Type interaction.
The NE group did not show a main effect of Extraction or Phrase Type, but revealed a significant Extraction × Phrase Type interaction. This interaction was caused because the Extraction-NP condition had longer RTs than the Extraction-VP condition (t 1(25) = 2.587, p = .016; t 2(19) = 3.076, p = .006), and marginally longer RTs than the Non-extraction-NP condition (t 1(25) = 2.013, p = .055; t 2(19) = 1.891, p = .074). Additionally, the Non-extraction-VP condition had marginally longer RTs than the Extraction-VP condition t 1(25) = 1.975, p = .059; t 2(19) = 1.845, p = .081). These effects were not related to the processing of intermediate gaps.
The CE group also did not show a main effect of Extraction or Phrase Type. Similarly to the NE group, they showed a significant Extraction × Phrase Type interaction. This was caused by longer RTs in the Extraction-NP compared to the Non-extraction-NP condition (t 1(28) = 3.724, p = .001; t 2(19) = 3.316, p = .004), and longer RTs in the Non-extraction-VP compared to the Non-extraction-NP condition (t 1(28) = 4.168, p < .001; t 2(19) = 2.576, p = .019). These effects were also not related to the processing of intermediate gaps.
To summarise the results from Segment 3, similarly to the Marinis et al. (Reference Marinis, Roberts, Felser and Clahsen2005) study, the two groups of L2 learners did not show any evidence of processing the intermediate gap. Crucially, participants with naturalistic exposure did not pattern similarly to native speakers.Footnote 7
Possible spill-over effect of intermediate gap (Segment 4)
The between-groups analysis of Segment 4 revealed a main effect of Group reflecting differences in speed between the groups (F 1(2,82) = 16.948, p < .001, η 2 = .292; F 2(1.414,26.858) = 75.580, p < .001, η 2 = .799). No main effect of Phrase Type was revealed (F 1(1,82) = 0.247, p = .620, η 2 = .003; F 2(1,19) = 0.117, p = .736, η 2 = .006), but a main effect of Extraction reflecting longer RTs in the conditions involving extraction (F 1(1,82) = 21.802, p < .001, η 2 = .210; F 2(1,19) = 21.918, p < .001, η 2 = .536). These effects were qualified by an Extraction × Group interaction that was significant in the subjects analysis and was approaching significance in the items analysis (F 1(2,82) = 3.892, p = .024, η 2 = .087; F 2(2,38) = 3.119, p = .056, η 2 = .141). To unpack this interaction, we conducted a separate analysis per group.
The NS data revealed a main effect of Extraction that was significant in the items analysis, but no main effect of Phrase Type. Additionally, a significant Extraction × Phrase Type interaction was revealed. Subsequent pair-wise comparisons showed that this interaction was due to the Extraction-NP condition having longer RTs than the Non-extraction-NP condition (t 1(29) = 2.864, p = .008; t 2(19) = 3.757, p = .001), and also than the Extraction-VP condition, which was significant only in the items analysis (t 1(29) = 1.758, p = .089; t 2(19) = 2.735, p = .013).Footnote 8
The NE group showed a main effect of Extraction that was significant in the subjects analysis and was approaching significance in the items analysis, indicating that the Extraction conditions had longer RTs than the Non-extraction conditions. Additionally, the subject analysis revealed a marginally significant main effect of Phrase Type, indicating that the VP conditions had longer RTs than the NP conditions. No significant Extraction × Phrase Type interaction was found.
The CE group revealed a main effect of Extraction, indicating that the Extraction conditions had longer RTs than the Non-extraction conditions. No main effect of Phrase Type, or a significant Extraction × Phrase Type interaction were observed.
To summarise findings at Segment 4, all groups demonstrated longer RTs for the Extraction conditions, suggesting increased cognitive load due to the presence of the filler. For the L2 groups, this could indicate a spill-over effect from Segment 3 due to delayed processing of the intermediate gap. The results from Segment 5 are relevant for this interpretation.
Subcategorising verb and filler integration (Segment 5)
The between-groups analysis of Segment 5 revealed a main effect of Group reflecting differences in speed (F 1(2,82) = 18.117, p < .001, η 2 = .306; F 2(2,38) = 206.043, p < .001, η 2 = .916) and a main effect of Extraction (F 1(1,82) = 38.455, p < .001, η 2 = .319; F 2(1,19) = 51.035, p < .001, η 2 = .729). These were qualified by an Extraction × Phrase Type interaction (F 1(1,82) = 21.242, p < .001, η 2 = .206; F 2(1,19) = 5.730, p = .027, η 2 = .232), and a Group × Extraction interaction in the items analysis (F 1(2,82) = 1.715, p = .186, η 2 = .040; F 2(2,38) = 4.886, p = .013, η 2 = .205). As with Segments 3 and 4, separate analyses for each group were conducted to explore this interaction.
Native speakers showed a main effect of Extraction and a main effect of Phrase Type, which were qualified by an Extraction × Phrase Type interaction. Subsequent pair-wise comparisons revealed longer RTs in the Extraction-NP vs. Non-extraction-NP conditions (t 1(29) = 4.061, p < .001; t 2(19) = 5.308, p < .001). Crucially, RTs in the Extraction-VP condition were shorter than in the Extraction-NP condition indicating facilitation in the condition involving the intermediate gap (t 1(29) = –4.082, p < .001; t 2(19) = –3.738, p = .001).
The NE group showed a main effect of Extraction, which was qualified by a significant Extraction × Phrase Type interaction. No main effect of Phrase Type was revealed. To unpack the interaction, pair-wise comparisons were conducted, which revealed that the Extraction-NP condition had longer RTs than the Extraction-VP condition (t 1(25) = 2.144, p = .042; t 2(19) = 1.636, p = .118), and the Non-extraction-NP condition (t 1(25) = 3.322, p = .003; t 2(19) = 4.920, p < .001). The first of these two effects indicates facilitation for the condition with the intermediate gap, mirroring the pattern of the NS group.
The CE group showed a different pattern of results to the NE group. There was a main effect of Extraction indicating longer RTs in the Extraction compared to the Non-extraction conditions, but no main effect of Phrase Type or a significant Extraction × Phrase Type interaction.
Summarising the results from this segment, both the NS and the NE groups showed facilitation for the condition with the intermediate gap, whereas the CE group did not provide any evidence of processing the intermediate gap.
Discussion
The aim of this study was to investigate effects of naturalistic L2 exposure in the processing of intermediate wh-traces by proficient learners of L2 English whose L1 (Greek) has successive cyclic movement compared to a control group of native speakers. Two groups of Greek learners of English took part in this study: a group without any naturalistic exposure to English in an English-speaking environment, and a second group with an average of nine years of exposure to English in the UK. The two groups were compared to a control group of native English speakers. The main results of this study can be summarised as follows: First, the data from the native speakers and the classroom exposure L2 group replicated the findings by Marinis et al. (Reference Marinis, Roberts, Felser and Clahsen2005) and by Gibson and Warren (Reference Gibson and Warren2004) for matching groups. Second, RTs of the L2 learners at the site of the intermediate gap did not hint towards processing of the wh-trace, but they showed an effect of Extraction in the following segment that could be interpreted as an effect of memory cost or a spill-over effect. Third, the naturalistic exposure L2 group converged with the NS group in revealing facilitation in processing the final gap when an intermediate gap was present.Footnote 9 Finally, although the CE learners did not seem to process the intermediate gap, their comprehension of the sentences was not compromised, as suggested by their accuracy data.
L2 processing of intermediate traces of wh-movement
Previous studies on L2 processing of wh-dependencies have shown that L2 learners employ the Active Filler strategy (Clifton & Frazier, Reference Clifton, Frazier, Carlson and Tanenhaus1989) similarly to native speakers of English (Williams, Reference Williams2006; Williams et al., Reference Williams, Mobius and Kim2001). Accordingly, readers keep a displaced fronted phrase in their WM and attempt to integrate it as early as possible to a potential gap. However, due to the design of these L2 studies, it was not possible to disentangle whether the integration is driven by syntactic cues (gaps) or by lexical cues provided by the subcategorising verb. The task administered in the present study and also in Gibson and Warren (Reference Gibson and Warren2004) and in Marinis et al. (Reference Marinis, Roberts, Felser and Clahsen2005) focuses directly on this issue; by providing an additional intermediate gap for the integration of the filler, it attempts to distinguish between processing driven by syntactic vs. lexical cues.
Gibson and Warren (Reference Gibson and Warren2004) and Marinis et al. (Reference Marinis, Roberts, Felser and Clahsen2005) provided evidence that native speakers of English process intermediate gaps in real time. At the region with the subcategorising verb, RTs in the condition with an intermediate gap were shorter compared to the condition involving extraction without an intermediate gap. This suggests that the presence of the intermediate gap broke the long wh-dependency into two shorter ones, and thus, reduced the processing cost at the site of the subcategorising verb where the wh-phrase was ultimately integrated. Our data from the group of native speakers replicated these findings.
Marinis et al. (Reference Marinis, Roberts, Felser and Clahsen2005) showed that advanced learners of L2 English did not show the effect of the intermediate gap attested in native speakers of English irrespective of whether their L1 had intermediate gaps. Our results from the CE group replicate these findings. However, the group with NE provides a novel pattern. They showed a delayed effect of extraction in the segment following the intermediate trace and facilitation in the final gap. This suggests that the fronted wh-phrase was processed slightly after the site of the intermediate gap (Segment 4), breaking the long wh-dependency into two shorter ones. In contrast, the CE group only showed elevated RTs in the two Extraction conditions, reflecting the reactivation of the filler and integration at the subcategorising verb. Since there was a significant difference between the two Extraction conditions for the NE group only, this provides evidence that L2 learners with extended naturalistic L2 exposure are able to process the intermediate gap before integrating the wh-filler directly at its subcategorising verb.
An alternative interpretation for the effect at Segment 5 was suggested by Rodriguez (Reference Rodriguez2008), namely that the difference between Extraction-VP vs. Extraction-NP may not reflect reduced RTs in the VP condition due to the presence of an intermediate gap at Segment 3, but may reflect elevated RTs in the NP condition caused by longer and more complex NPs in Segment 2. Results from our study do not seem to support this interpretation for either NS or L2 learners. If the difference between Extraction-VP vs. Extraction-NP was caused by the difference in the NP complexity in Segment 2, the same difference should have been attested for Non-extraction-VP vs. Non-extraction-NP. This is because the Extraction and Non-extraction conditions are matched in terms of the complexity of the NP, and the NP in the Non-extraction-NP condition is more complex than the NP in the Non-extraction-VP condition. None of the groups showed longer RTs in Non-extraction-NP compared to the Non-extraction-VP condition. Therefore, in line with Marinis et al., we suggest that the effect at Segment 5 reflects facilitation due to the intermediate gap at Segment 3, which was present in the NS and NE groups, but not in the CE group, who resolved long-distance wh-dependencies on the basis of lexical cues.
Naturalistic L2 exposure and wh-movement
According to Ullman (Reference Ullman2001, Reference Ullman2004), practice can lead to more native-like L2 processing. However, research on how naturalistic exposure affects L2 syntactic processing is to date very limited. The few studies that have investigated the impact of naturalistic exposure on L2 processing have shown that L2 learners with limited naturalistic exposure (nine months) tend to transfer processing strategies from their L1 to their L2, but after five years of exposure, L2 learners use similar processing strategies with native speakers (Frenck-Mestre, Reference Frenck-Mestre, Altarriba and Herridia2002). In addition, Dussias (Reference Dussias2003) and Dussias and Sagarra (Reference Dussias and Sagarra2007) showed that extensive naturalistic exposure can also have the reverse effect, i.e. L2 learners using processing strategies of their L2 when they process their L1. However, to date effects of naturalistic exposure have only been tested in studies investigating RC attachment preferences. This is the first study to investigate effects of naturalistic exposure in structure-based processing involving filler–gap dependencies and empty categories of successive cyclic movement.
The results from our study show significant differences between L2 learners with classroom vs. naturalistic exposure, in the way they process sentences with intermediate gaps, but not in terms of their accuracy in comprehending sentences. Both groups comprehended the sentences equally well and their accuracy was similar to that of native speakers. However, although Greek has successive cyclic movement, only learners with substantial naturalistic L2 exposure showed evidence of processing intermediate gaps. Thus, naturalistic exposure can impact L2 processing across the board, but learners may require a different amount of exposure to achieve native-like processing depending of the structure: some phenomena, such as RC attachment preferences, can be affected by a relatively small amount of naturalistic exposure to the L2, while others, such as the processing of successive cyclic movement, show an effect of immersion only after longer naturalistic exposure.
The present findings suggest a shift in L2 processing strategies, from lexically-driven to structurally-driven, as a function of naturalistic L2 exposure. In accordance with the suggestions by Frenck-Mestre (Reference Frenck-Mestre, Altarriba and Herridia2002), more than five years of exposure can lead to the use of native-like processing strategies by L2 learners. This applies to processing strategies related to preferences, such as RC attachment preferences, but also to structure-based processing, such as successive cyclic movement.
The studies investigating relative clause processing strategies have revealed that naturalistic exposure can lead to native-like processing strategies irrespective of whether the L1 and the L2 have the same or different processing strategies. In our study, both the L1 and the L2 have successive cyclic movement. However, only the group with extended naturalistic exposure showed native-like processing strategies. This suggests that extended naturalistic exposure can lead to native-like structure-based processing in structures involving successive cyclic movement when there is typological similarity between the two languages. Future research is necessary to address whether naturalistic exposure can lead to native-like processing of successive cyclic movement when there are typological differences between the L1 and the L2 and the L1 does not have successive cyclic movement.
Our findings are compatible with recent behavioural and neurophysiological evidence suggesting that, contrary to the SSH predictions, native-like L2 processing is achievable by highly proficient L2 learners (Foucart & Frenck-Mestre, Reference Foucart and Frenck-Mestre2011; Gillon-Dowens et al., Reference Gillon-Dowens, Vergara, Barber and Carreiras2010; Pliatsikas & Marinis, Reference Pliatsikas and Marinis2012), even for L2 features that do not have equivalents in the L1 (Foucart & Frenck-Mestre, Reference Foucart and Frenck-Mestre2012). However, naturalistic exposure seems to be crucial for the acquisition of certain grammatical features, like empty syntactic categories, whereas others, such as regular past tense inflection, can be established with a significant amount of formal classroom exposure. It is important to note that all these studies included highly proficient participants. Therefore, future research should aim to investigate how proficiency interacts with type of exposure affecting the acquisition and processing of grammatical features in the L2.
Our study is the first to show that automatic syntactic processing in long-distance dependencies is affected by an extended period of naturalistic exposure and can become native-like, even for constructions that are relatively infrequent in colloquial naturalistic input, such as sentences involving successive cyclic movement. These findings challenge the SSH, according to which L2 learners underuse syntactic information during online processing of non-local dependencies. In our study, only learners without naturalistic L2 exposure were not able to process intermediate traces of wh-movement, and instead seemed to process wh-dependencies on the basis of lexical information (subcategorisation of the verb). The results of our study together with the results from Marinis et al. (Reference Marinis, Roberts, Felser and Clahsen2005) suggest that the SSH applies only to L2 learners with limited or no naturalistic exposure. Our findings converge with the growing body of evidence that suggests that native-like syntactic processing is achievable as a function of linguistic immersion.