1 Introduction
In 2013, prior to the implementation of major provisions introduced by the Patient Protection and Affordable Care Act (ACA), the March supplement of the Current Population Survey estimated that 53.9% of the population had private health insurance coverage through their employer, while 34.3% were enrolled in government health programs, such as Medicare, Medicaid, the Children’s Health Insurance Program or programs for military personnel or veterans (Tricare and Champva). Accounting for individuals with both employer-sponsored and public insurance, 13.4% of the population remained uninsured for the entire year and 11% obtained insurance directly in the individual, non-group insurance market.Footnote 1
The individual, non-group insurance market has traditionally lacked competition among insurers due to adverse selection problems: the average state Herfindahl-Hirschman Index for the individual insurance market was 4100 in 2011, which the Department of Justice considers ‘highly concentrated’.Footnote 2 Prior to the ACA, carriers affiliated with Blue Cross and Blue Shield held the largest share of this market in all but two states – Ohio and Utah. Partly due to this lack of competition, average premiums increased 113% from 2000 to 2010, reaching a high of $15,073 for commercial family coverage in 2013 (Kaiser, 2011).Footnote 3 One goal of the ACA, passed in March 2010 and upheld by the US Supreme Court in June 2012, is to increase competition and reduce premiums in this market. With this goal in mind, the ACA created online Health Insurance Marketplaces, where uninsured individuals or those insured in the non-group market can compare plans and purchase insurance. In all, 34 states chose not to create their own state-run marketplaces, forcing the federal government to facilitate these marketplaces for them. Along with mandating insurance and providing federal subsidies to individuals who earn between the 133% and 400% of the Federal Poverty Level (FPL), the ACA aims to reduce the share of uninsured in the United States. Indeed, the share of individuals who were uninsured at some point in the year fell from 17.1 to 11% in only 2.5 years, according to a Gallup survey.Footnote 4
The effect of competition on premiums is not easily predictable. Increased competition can reduce premiums, as insurers reduce their markups and reimbursements in an effort to retain or acquire service. On the other hand, competition can also weaken insurers’ bargaining positions with health care providers, leading to higher negotiated reimbursements and premiums. In addition, competition can reduce the benefits provided by economies of scale, thereby increasing premiums. Therefore, an empirical analysis of the data from the first 2 years of marketplaces, 2014 and 2015, would improve our understanding of the relationship between competition and premiums.
To date, few multivariate regression studies exist that analyze the effect of competition on premiums. These studies suffer from simultaneity and omitted variable biases. The expectations about premiums in a geographic area can also affect how many insurers offer plans in that area. This reverse causality leads to premiums and competition to be simultaneously determined. In addition, the risk pool for individuals who purchase insurance in the marketplaces is difficult to measure. Insurance companies rely heavily upon the previous year’s insurance claims data when they set their premiums for marketplaces, a process conducted on an annual basis in fall. However, due to imperfect predictability of next year’s risk pool and because claims data are not publicly available, omitting a measure of the risk pool would cause simple ordinary least squares (OLS) models to produce biased results.
To mitigate these endogeneity concerns, we exploit United Healthcare’s decision to offer insurance plans in 16 states with federally facilitated marketplaces (FFM) in 2015, after avoiding all 34 FFMs in 2014. United Healthcare is the largest health insurer in the nation. As a result, their 2015 decision to participate in 16 marketplaces is likely to differentially affect the level of competition among insurers across geographic areas. This decision can affect premiums, number of plans and product characteristics of its rivals in the same geographic area. If this decision is exogenously determined, then using United Healthcare’s participation in a geographic area as an instrument for competition can address both simultaneity and omitted variable biases.
The main question of this study is the following: How did competition affect the premiums in the marketplaces during the first 2 years of ACA’s implementation: 2014 and 2015? Contribution of this paper is threefold. First, this is the first study that uses United Healthcare’s 2015 decision to participate in the FFMs as a source of quasi-experimental variation to mitigate the endogeneity concerns in multivariate regressions of premiums on competition. Second, we use a panel data set of premiums and competition over the first 2 years of marketplaces along with an extensive set of control variables from five sources. Third, prior studies point to reduced premiums due to an increase in competition. However, we found only three studies that attempt to quantify this effect for the ACA’s marketplaces. As taxpayer-funded federal subsidies to purchase insurance depend on the premiums, policymakers will find it useful to have a quantifiable estimate of this effect prior to making adjustments for improved competition and premium outcomes.
Each insurer has separate decisions whether to enter into the 395 ratings areas that are geographically defined by each state government. We use a recent data set of observations from 395 rating areas in 34 states over 2 years: 2014 and 2015. For this data set, we combine data from five main sources: the ACA database, HealthCare Cost Report Information System, US Census, University of Wisconsin Population Health Institute and Small Area Health Insurance Estimates (SAHIE). One advantage of this data set is that all rating areas with FFMs are included and results are not dependent on individual circumstances of a particular rating area. Another advantage is that such an analysis is easily replicable for future research, as the federal government updates these data sources yearly, as implementation of the ACA continues.
Our empirical analysis uses the second-lowest-priced silver plan (2LPS) premium for a 30-year-old single, non-smoking individual within a rating area as our dependent variable for two reasons. First, 2LPS premium is the basis for determining the federal government’s premium subsidy for all the plans offered in a rating area. Second, earlier studies conclude that consumers purchase silver plans much more often than other plans (Ericson and Starc, Reference Ericson and Starc2012). Our main variable of interest is the number of insurers competing in a rating area each year, and we use this variable as the measure of competition in that rating area. We control for per capita income, average hospital price, share of non-profit insurers, share of co-operatives (CO-OPs), rating area population, share of population under the age of 18 years or over the age of 64 years, share of uninsured individuals, rural share of the population, poverty rate, and black and Hispanic shares of the population per rating area.
Our methodology has five steps. We begin our analysis by estimating an OLS regression of 2LPS on competition and other control variables, separately for both 2014 and 2015. Due to simultaneity and omitted variable biases, this endogenous regression is likely to produce biased results. Therefore, we exploit the panel nature of our data set to take the first difference of variables between 2014 and 2015 in the second step. Estimating the effects of a change in competition from 2014 to 2015 on changes in 2LPS, we eliminate time-invariant omitted variables that may produce biased OLS regression results. However, time-variant omitted variables and simultaneity can still bias the results. Accordingly, in our third step, we use United Healthcare’s decision to participate in some rating areas in 16 states as an instrumental variable for change in competition in a rating area from 2014 to 2015. This two-stage least squares (2SLS) method for the first-differenced (FD) regression is likely to eliminate biases due to both simultaneity and omitted variables. Fourth, we run a threshold analysis to see the effects of competition on premiums as the number of insurers in a rating area varies. In our fifth step, we test the robustness of our results to alternative measures of premiums, inclusion of a non-linear term in the regression models and a county-level analysis.
Our results from the endogenous OLS regression are in line with previous results. One more insurer in a rating area is associated with a 2.9% decrease in 2LPS premium in 2015. In the FD regression, we find this effect to be 4.47%. Instrumenting for change in competition by United Healthcare’s participation, we find that the 2LPS premium would have decreased 6.97%, on average, if one more insurer competed in a rating area. Moving our attention to threshold analysis, we find that one more insurer’s effect on premiums become statistically insignificant if four or more insurers already exist in a rating area. Finally, we find that the results are robust to alternative measures of premiums, inclusion of a non-linear term in the regression models, and a county-level analysis.
The remainder of the paper proceeds as follows. Section 2 provides more information on United Healthcare’s participation in the marketplaces. Section 3 describes related literature. In Section 4, we explain the construction of our data set and summary statistics. Section 5 presents our methodology and results. In Section 6, we discuss the limitations of this study. Section 7 concludes.
2 United Healthcare’s Participation Decisions in 2014 and 2015
United Healthcare is the largest health insurance company in the United States by number of covered individuals. Prior to the first year of marketplaces in 2014, United Healthcare had a large number of enrollees in Medicare Advantage program. As the ACA substantially cut federal reimbursements to this program, the company conceded to reporters in 2013 that this change is likely to have an adverse effect on profits. As a result, the company took a conservative approach to the marketplaces in 2014; United Healthcare did not offer any insurance plans in the 34 states with FFMs, while offering plans in only four state-run marketplaces.
In July 2014, while discussing the company’s second-quarter earnings report, chief executive officer Stephen J. Hemsley stated that the company would offer health insurance plans in the marketplaces under the ACA ‘to as many as two dozen’ states in 2015. Accordingly, United Healthcare offered plans in 16 of the 34 FFMs, as well as additional state-run marketplaces. There was a wide range in the scale of United Healthcare’s participation in these 16 FFMs. In Alabama, Georgia and Indiana, United Healthcare offered plans in every rating area. However, it offered plans in only 1 out of 13 rating areas of Illinois. Among the most populated of 16 FFMs, United Healthcare participated in 65 out of 67 rating areas in Florida, 7 out of 26 rating areas in Texas, 5 out of 17 rating areas in Ohio and three out of nine rating areas in Pennsylvania.
United Healthcare’s entry can have two effects on 2LPS premiums. First, the company could itself have offered one of the two lowest-priced silver premiums in a rating area. Second, its participation can lead rival insurance companies to strategically lower premiums in hopes of competing more successfully with United Healthcare. We expect both effects to be more pronounced in areas where United Healthcare offered a plan and where limited competition existed before United Healthcare’s entry. The consequences that result from United Healthcare’s entry into FFMs is due to the competition levels existing prior to entry and how the competitors react afterward. Such changes in the industry’s competitive landscape would create variation in competition across rating areas. One concern is that United Healthcare’s entry may have discouraged other companies from entering. If this is the case, our estimates would be downward-biased. However, due to the long application process to enter the FFMs, we expect this to be a marginal bias.
3 Literature review
Some earlier studies focused on how premiums are set in the health insurance markets. Zweifel and Breuer (Reference Zweifel and Breuer2006) find that risk-independent insurance premiums are not optimal; they advocate risk-based premiums combined with means-tested, tax-financed transfers. Their research supports the need to control for an estimate of the risk pool in determining the marketplace premiums and the omitted variable bias that arises due to the lack of data on this estimate. McGuire (Reference McGuire2006) argues that risk-based premiums would enable the gains from insurer competition to be realized, granted that the information was perfect or at least adequate. In the absence of adequate information, he concludes that risk-based premiums would not be feasible. Herring and Pauly (Reference Herring and Pauly2001) study the relationship between expected medical expense and actual paid premiums. They conclude that premiums vary less than proportionally with expected expense and they are related to only certain risk characteristics.
Before the ACA, the individual insurance market was a small market with limited competition. Therefore, earlier literature on the effects of competition on premiums was constrained by a lack of data. Wholey et al. (Reference Wholey, Feldman and Christianson1995) examine the effects of Health Maintenance Organization (HMO) market structure on premiums from 1988 to 1991. Managed care organizations are designed to increase competition among health care plans, thereby reducing costs and premiums. They find that an increased number of HMOs in the market area is associated with reduced HMO premiums. Robinson (Reference Robinson2004) highlights the dominance of few insurance firms in each state and the associated increase in premiums and profits. He argues that the industry must undergo rejuvenation through the addition of new firms and products, or the market will face increased regulatory oversight from the public sector. Dafny (Reference Dafny2010) analyzes the effects of imperfect competition on premiums and market power of health care insurers. He finds that health care insurers are exercising market power in an increasing number of geographic markets. Due to lack of data availability, none of these studies quantify the effects of competition on premiums. By using data from the first 2 years of ACA’s implementation, we are able to quantify this effect, which is important as increased competition and reduced premiums can help millions of uninsured individuals obtain health insurance.
Two recent papers analyze the premiums in ACA’s marketplaces during 2014 and 2015. Gabel et al. (Reference Gabel, Whitmore, Green, Stromberg, Weinstein and Oran2015) initially use descriptive statistics to demonstrate the changes in premiums from 2014 to 2015 in both FFMs and state-run marketplaces. They find a 1.6% decrease in premiums from 2014 to 2015. In an OLS regression analysis of pooled 2014 and 2015 data, they find that one more insurer is associated with a 2.2% decline in the 2LPS premium. In this analysis, they control for the plan year, whether the state had an FFM or ran its own marketplace, plan type, carrier category, whether the area was urban, suburban or rural, market concentration in the individual insurance market prior to the ACA, number of insurers competing in the rating area, median family income, percentage of the uninsured population, and a state identifier. Jacobs et al. (Reference Jacobs, Banthin and Trachtman2015) expands upon this analysis by removing omitted time-invariant factors with a FD multivariate regression analysis of 2014 and 2015 data from the FFMs. They find that one more insurer is associated with a 1.2% reduction in the 2LPS premium, after controlling for the 2012 US census population estimate, the percentage of population under the age of 18 years and over the age of 64 years, the percentage of rural population, median household income, the percentage of uninsured adults, and the percentage of population with incomes below poverty. Both studies use an OLS method, which would yield biased results in the presence of omitted time-variant factors and reverse causality. We identified three other studies that use instrumental variables to address these concerns.
Dafny et al. (Reference Dafny, Gruber and Ody2012) uses an instrumental variables approach for the 1998 merger between Aetna and Prudential, two large insurers. This merger had differential effects on the level of competition across markets, which helps them identify the most affected markets. They find an average increase in premiums of 7% between 1998 and 2006, following the merger. We focus on more recent data from the ACA. In addition, we do a threshold analysis to investigate how many insurers create enough competition to affect the premiums.
Guardado et al. (Reference Guardado, Emmons and Kane2013) uses another large merger between United Health Group and Sierra Health Services. This merger changed the market concentration in Nevada’s health insurance markets. Using a difference-in-difference approach, they find premiums in most affected Nevada markets increased by 13.7% following the merger. Various factors in Nevada may have affected this increase, aside from a change in market concentration. Therefore, results from a single state may not be generalizable to other states. We include competition and ACA premiums data from 34 states, which represent diverse regions of the United States and the results may provide a more holistic outlook on the effects of competition on premiums.
Dafny et al. (Reference Dafny, Duggan and Ramanarayanan2015) exploits United Healthcare’s decision not to participate in any of the marketplaces of 2014. They find that the 2LPS premium would have decreased by 5.4%, on average, had United Healthcare participated. If all insurers active in 2011 also participated in all rating areas of 2014, they estimate that this premium would be 11.1% lower and 2014 federal subsidies would be reduced by $1.7 billion. A powerful aspect of Dafny et al. (Reference Dafny, Duggan and Ramanarayanan2015) is their use of the exogenous variation introduced by United Healthcare’s decision not to participate. We find a larger effect on premiums when an additional insurer competes in a rating area, due to using a different instrument and our inclusion of 2015 data. In construction of their instrument, Dafny et al. (Reference Dafny, Duggan and Ramanarayanan2015) use market concentration in the individual insurance market of the same area prior to the ACA and the change in this concentration due to United Healthcare’s non-participation in 2014. Therefore, they include data from both 2014 and the time period before 2014. Instead of using the variation in competition due to United Healthcare’s non-participation in 2014, we use the variation caused by United Healthcare’s participation in 2015 as an instrument for competition. As the ACA came with substantial insurance policy reforms and led to the creation of online marketplaces, premiums and levels of competition may not be comparable to pre-ACA premiums and competition levels. Accordingly, this study analyzes only post-ACA data created by the marketplaces in 2014, and expands the analysis to include 2015 data.
4 Data
Our unit of observation is a rating area. Under the ACA, states chose their rating areas as consisting of one or more counties, ZIP codes, or Metropolitan Statistical Areas. Insurers make a separate entry decision into each rating area and offer insurance plans on the marketplaces. A state can establish its own marketplace, although 34 states chose not to do so. Therefore, the federal government set up FFMs in these states. There are 395 rating areasFootnote 5 in the 34 FFMs in our data set.
4.1 Outcome variable: premiums
Our outcome variable is the plan premium. We downloaded plan premiums along with an insurer identifier, the rating area in which a plan is offered, and the plan’s metal tier from the healthcare.gov website. The premiums offered in the marketplaces differ by the plan’s metal tier: bronze plans cover 60% of costs, silver plans cover 70%, gold plans cover 80% and platinum plans are the most generous, covering 90% of costs, after the insured individual pays a deductible. We focus on the 2LPS premium for the following two reasons. First, the majority of consumers purchase silver plans, as Ericson and Starc (Reference Ericson and Starc2012) report. In 2014, 65% of enrollees in the FFMs chose silver plans. Second, the 2LPS premium is the benchmark plan that the federal government uses to determine the subsidy for all plans on the marketplace in a rating area. These subsidies cover the difference between a specified percentage of individual income and the 2LPS premium for individuals earning incomes from 133 to 400% of the FPL. Premiums may also differ based on an enrollee’s age, family size and smoking status. We use a 30-year-old, non-smoking, single individual’s premium. Plan premiums for other ages and family structures are a constant multiple of the 30-year-old single premium.
4.2 Key independent variable: competition
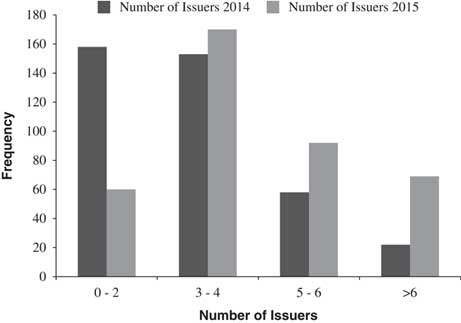
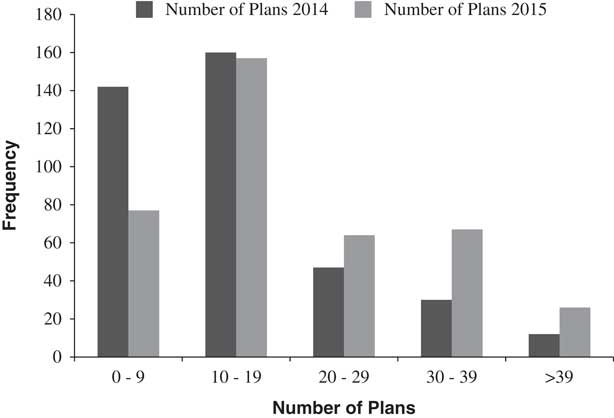
We measure the level of competition in a rating area by the number of issuers offering plans in that rating area. We obtain this data set through the ACA’s official website. Figure 1 displays a histogram of the total number of issuers per rating area in 2014 and 2015. From 2014 to 2015, the total number of rating areas with three or more issuers increased, while the total number of rating areas with one or two issuers has decreased. We observe a similar increase in number of plans offered by issuers from 2014 to 2015. Figure 2 illustrates a higher number of plans being offered in 2015 per rating area than were offered in 2014. On average, the number of issuers competing in a geographic rating area increased by 25%, from 2014 to 2015.
Histogram (number of issuers)

Histogram (number of plans)

We use United Healthcare’s 2015 decision to participate in some rating areas in 16 states as an instrumental variable for the change in competition from 2014 to 2015. United Healthcare offered plans in 169 of the 395 rating areas in 2015, after not offering plans in any rating area in 2014. We analyze the basic assumptions for this instrumental variable to yield unbiased results in Section 5.
4.3 Additional controls
We use a large set of control variables that are likely to affect the premiums offered in a rating area. Specifically, we use three sets of variables that control for competition characteristics, rating area market structure, and rating area demographics. For all variables measured in dollars, we use 2014 constant dollars by multiplying the 2015 values with CPI ratio between 2 years. For competition characteristics, we include the share of non-profits and a binary variable indicating that at least one non-profit CO-OP competed in the rating area, as in Dafny et al. (Reference Dafny, Duggan and Ramanarayanan2015). Non-profit insurance companies charge lower premiums, ceteris paribus, than for-profit insurance companies. As the share of non-profits increases, a significant negative effect on the 2LPS premium in a rating area is possible. We also include a binary variable indicating the presence of a non-profit CO-OP in a rating area due to CO-OPs possibly reducing premiums even further.
Another set of controls includes variables that define the rating area market structure. One-third of spending by private insurance plans cover hospital costs, which in turn affect the premiums that insurance companies charge. We include an estimate of hospital prices in a rating area using the Case Mix Index (CMI) of the Health Cost Report Information System. The Centers for Medicare & Medicaid Services assign each Medicare patient with inpatient hospital stays into one of the over 700 Medicare Severity-Diagnosis Related Groups (MS-DRGs). Each MS-DRG has a numeric weight reflecting the average hospital resource consumption by patients for that MS-DRG relative to the national average hospital resource consumption of all patients. For example, a diagnosis that requires more expensive and complex resources would have a weight >1. CMI is the average weight across all patients who stayed at a hospital during a period of time. For our econometric model, we used CMI data from 2014 and 2015. In order to find the adjusted cost per patient, we divide average cost per patient by the CMI at that hospital. This adjustment allows us to control for the complexity of a procedure, while finding a specific hospital’s cost per patient compared with other hospitals. Then, we take the average of adjusted costs per patient across all hospitals in a rating area to find the average hospital price. As an imperfect measure of the risk pool in a rating area, we include the percentage of rating area population reporting themselves to be in fair or poor health and the average number of days in a month that individuals reported being sick. We obtain these data from the County Health Rankings and Roadmaps of the University of Wisconsin Population Health Institute. As these data are available at the county-level, we use a population-weighted average across all counties in a rating area to find the relevant rating area measure of the risk pool.
Demographic factors may also play a role in determining premiums insurers charge in a rating area. Expectations about market size, purchasing power of potential enrollees, number of individuals who are eligible for federal subsidies and other demographic factors can influence both the level of competition and the premiums offered in a rating area. Therefore, we control for each rating area’s population estimate, median household income, percentages of black and Hispanic individuals, percentage of uninsured adults, percentage of the population with incomes below poverty and percentages of the population younger than the age of 18 years and older than the age of 64 years. We use US Census to obtain these demographic variables except for a percentage of uninsured adults in a rating area, where we use the SAHIE.
4.4 Summary statistics
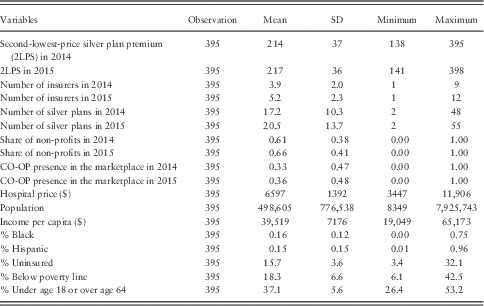
Table 1 displays population-weighted summary statistics for the 395 rating areas in 34 states. The average premium for the 2LPS plan increased by 1.4% from 2014 to 2015. During the same time, the average number of insurers per rating area increased from 3.9 to 5.2. Every rating area had at least one insurer in both years and some rating areas had as many as 12 insurers in 2015. Besides the number of insurers, the number of silver plans offered in a rating area has also increased from 2014 to 2015. A rating area had 17.2 silver plans on average in 2014, while this number increased to 20.5 in 2015. This corresponds to a 19.2% increase in the number of silver plans offered in a rating area in only 1 year.
Summary statistics

Note: The unit of observation is the rating area. There are 395 rating areas in the 34 states with federally facilitated marketplaces. Price for the second-lowest-price silver plan is the individual premium for a 30-year-old. Premiums change proportionally with age.
Means, standard deviations, minimums and maximums of all other explanatory variables are also available in Table 1. Shares of non-profits and CO-OPs among insurers have increased from 2014 to 2015, which may partly explain why premiums increased only 1.4% from 2014 to 2015. Average rating area had a population of almost half a million people, while average income per capita was around $39,500. Black and Hispanic shares of the population are similar at 16 and 15%, respectively, although significant variation exists across rating areas. On average, 15.7% of the population is uninsured per rating area and 18.3% of the population has incomes below the poverty line. Individuals under the age of 18 years or over the age of 64 years account for 37.1% of the population on average.
5 Methodology and Results
This section presents our methodology and main empirical results. We begin our analysis by employing a simple OLS regression of 2LPS on competition and other control variables in Section 5.1. We examine the correlation between premiums and competition separately for 2014 and 2015. In Section 5.2, we use a FD regression model, with which we aim to eliminate sources of bias that arise in the OLS regressions. Next, we use United Healthcare’s decision to enter the marketplaces in 2015 as an instrument for competition in Section 5.3. This section begins with an analysis of the necessary assumptions required for a good instrumental variable. A 2SLS method is then used to estimate the casual effects of competition on premiums. In Section 5.4, we run a threshold analysis to allow for differential casual effects depending on the initial level of competition in a rating area in 2014. This threshold analysis enables us to observe whether one more insurer entering a rating area has different effects on premiums at varying levels of competition. We examine the robustness of our results in Section 5.5.
5.1 Are premiums correlated with competition?
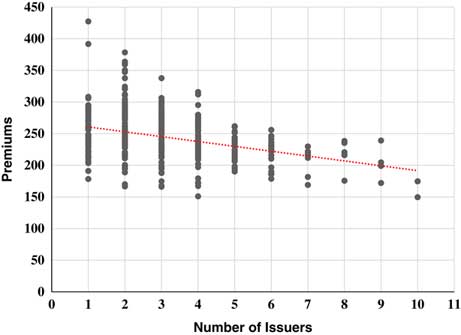
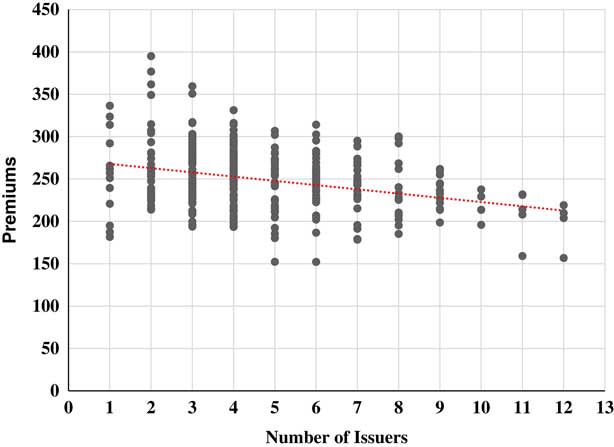
We begin our analysis by first examining the correlation between 2LPS and competition. In Figure 3, we use a scatter plot to observe the relationship between 2LPS and the number of insurers in a rating area for 2014. Figure 4 does the same for 2015. In both 2014 and 2015, a majority of rating areas had five or fewer insurers in competition. We also observe an inverse relationship between the number of insurers, that is, the level of competition and premiums; premiums decline as competition increases. These scatter plots are useful because they preview industry dynamics. However, a bivariate analysis does not control for the competition characteristics, market structure or rating area demographics. Each of these factors may also influence the premiums charged by insurers in a rating area. Therefore, a multivariate analysis with these control variables would provide more meaningful insight into the effects of competition on premiums.
Scatter plot 2014 (number of issuers and premiums)

Scatter plot 2015 (number of issuers and premiums)

We use a simple OLS model to estimate the following multivariate regression model:
 $$\eqalignno{ ln(2LPS)_{{rt}} {\equals}&\,\beta _{0} {\plus}\,\beta _{1} Insurers_{{rt}} \,{\plus}\,\beta _{2} Non{\hbox-}profits_{{rt}} {\plus}\beta _{3} COOPs_{{rt}} \cr & {\plus}\beta _{4} {\rm ln}(HospitalPrice)_{{r(t{\minus}1)}} {\plus} \beta _{5} PoorHealth_{{r(t{\minus}1)}} {\plus}\beta _{6} SickDays_{{(t{\minus}1)}} \cr & {\plus}\beta _{7} {\rm ln}(Population)_{{r(t{\minus}1)}} {\plus}\beta _{8} {\rm ln}(PcIncome)_{{r(t{\minus}1)}} {\plus} \beta _{9} Black_{{r(t{\minus}1)}} \cr & {\plus}\beta _{{10}} Hispanic_{{r(t{\minus}1)}} {\plus}\beta _{{11}} Uninsured_{{r(t{\minus}1)}} {\plus}\beta _{{12}} Poverty_{{r(t{\minus}1)}}\cr & {\plus} \beta _{{13}} PopUnder18Over65_{{r(t{\minus}1)}} {\plus}{\varepsilon}_{{rt}} , $$
where the variable 2LPS
rt
represents the 2LPS premium for rating area r in year t; Insurers
rt
is the number of insurance companies offering plans; Non-profits
rt
the percentage of non-profit insurers; COOPs
rt
a binary variable indicating the existence of at least 1 CO-OP insurer in a rating area; Hospital Price
r
the average hospital price in the rating area; PoorHealth
r
and
 $$ SickDays_{{r } $$
represent the percentage of population reporting poor or fair health status and the average number of sick days reported in that rating area, respectively; Population
r
the rating area population; PcIncome
r
the per capita income of the rating area; Black
r
and Hispanic
r
represent the percentage of black and Hispanic population; Uninsured
r
the percentage of the uninsured; Poverty
r
the poverty rate of the rating area; PopUnder180Over65 the percentage of population under the age of 18 years or over the age of 65 years. We run this model separately for 2014 and 2015. As insurance companies can only observe previous year’s rating area demographic characteristics, we include a lagged value of all control variables except for Non-profits and CO-OPs. These two variables were only available after the implementation of ACA in 2014 and they have the potential to directly reduce premiums without a lag. The model includes an error term (ε
rt
) we assume to be uncorrelated with other unobserved determinants of premiums. As the premiums may be more volatile in markets with more insurers, we use robust standard errors to correct for potential heteroskedasticity. Furthermore, rating areas in the same state may have correlated standard errors due to state-specific factors. Therefore, we cluster standard errors by state in all our regressions.
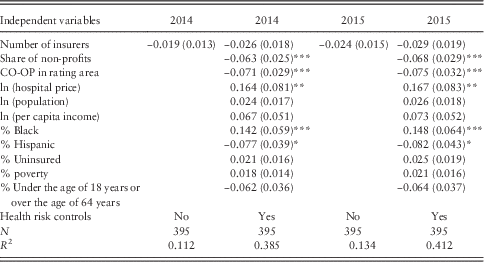
Table 2 displays the results from the OLS model utilizing equation (1), with the first two columns reporting 2014 results and the last two columns reporting 2015 results. Columns 1 and 3 display results that do not control for other variables that may affect the premiums, whereas columns 2 and 4 display results that account for control variables. Although not statistically significant across both specifications and in both years, we find that an additional insurer in a rating area is associated with lower 2LPS. The magnitude of this effect ranges from 1.9% in 2014 to 2.9% in 2015, across all four specifications. This effect is similar to the range of 1.2–3.5% decline in premiums found in Jacobs et al. (Reference Jacobs, Banthin and Trachtman2015) and Gabel et al. (Reference Gabel, Whitmore, Green, Stromberg, Weinstein and Oran2015). As the OLS model is likely to suffer from both simultaneity and omitted variable biases, as we describe in Section 1, we do not impose a causal interpretation to the results in Table 2.
Ordinary least squares estimates of the effects of competition on premiums in the federally facilitated marketplaces

Note: Standard errors are clustered by state and given in parentheses.
*p<0.10, **p<0.005, ***p<0.01.
5.2 FD estimates
One way to mitigate the endogeneity concerns is to use a FD regression analysis. With this approach, variables now represent changes between 2 years. For 2LPS, the number of insurers, share of non-profits, and existence of CO-OPs, we use the change from 2014 to 2015. All other controls use changes between 2013 and 2014. The rationale behind this decision intuitively makes sense as only the previous year’s data will be available and relevant to insurance companies as they set their premiums for the following year. First-differencing all variables eliminates the time-invariant omitted factors that were previously captured within the error term. If these factors were correlated with the level of competition in a rating area, then the endogeneity bias caused by this correlation will no longer be a concern. Therefore, we run the following regression of changes-on-changes:
 $$\eqalignno{ ln(\Delta 2LPS_{r} )\,{\equals}\,&\,\beta _{0} {\plus}\,\beta _{1} \Delta Insurers_{r} \,{\plus}\,\beta _{2} \Delta Nonprofits_{r} {\plus}\beta _{3} \Delta COOPs_{r} \cr &{\plus}\beta _{4} {\rm ln}(\Delta HospitalPrice)_{r} {\plus} \beta _{5} \Delta PoorHealth_{r} {\plus}\beta _{6} \Delta SickDays_{r} \cr &{\plus}\beta _{7} {\rm ln}(\Delta Population)_{r} {\plus}\beta _{8} {\rm ln}(\Delta PcIncome)_{r} {\plus}\beta _{9} \Delta Black_{r} \cr &{\plus} \beta _{{10}} \Delta Hispanic_{r} {\plus}\beta _{{11}} \Delta Uninsured_{r} {\plus}\beta _{{12}} \Delta Poverty_{r} \cr &{\plus}\beta _{{13}} \Delta PopUnder18Over65_{r} {\plus}{\varepsilon}_{r} . $$
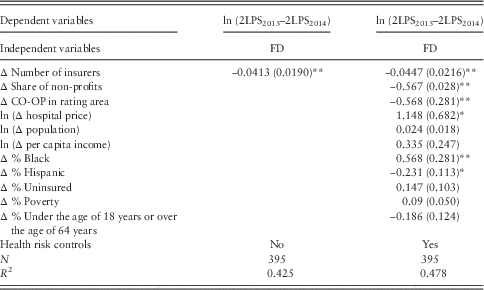
In Table 3, we report the results. In the first column, we do not control for any variables, whereas the second column includes all additional controls. The first column suggests that if a rating area were to gain one more insurer from 2014 to 2015, the 2LPS premium will be 4.13% lower. In the second column, one additional insurer results in 4.47% lower premium increases from 2014 to 2015 per rating area. Both effects are statistically significant at 5% level, unlike the endogenous regression in (1). Magnitudes of both effects are also greater. However, even though this analysis eliminates the bias caused by omitted time-invariant factors, simultaneity bias due to reverse causality between premiums and competition remains unaccounted for. An instrumental variables method can drastically improve our understanding of the effects of competition on premiums.
First-differenced (FD) estimates of the effects of competition on premiums in the federally facilitated marketplaces

Note: 2LPS=second-lowest-priced silver plan.
Standard errors are clustered by rating area and given in parentheses.
*p<0.10, **p<0.005, ***p<0.01.
5.3 Instrumental variable: United Healthcare’s 2015 entry
In order to examine whether there is a casual relationship between premiums and competition, we use United Healthcare’s participation in 2015 as an instrument for the change in number of insurers from 2014 to 2015 in a rating area. United Healthcare began offering insurance plans in 169 rating areas throughout 16 states. If this participation is correlated with the change in competition and if the United Healthcare’s choice of rating areas was exogenous, then it can serve as an effective instrumental variable to eliminate both simultaneity and omitted variable biases. In the following subsections, we first ask whether United Healthcare’s participation is correlated with the change in competition. Next, we justify our reason to believe that United Healthcare’s choice of rating areas was exogenously determined. In the last two subsections, we estimate the reduced form regression and 2SLS to find unbiased estimates of competition’s effect on premiums.
First-stage regression
We estimate the following model to see if United Healthcare’s participation in 2015 is correlated with the change in the number of insurers in a rating area from 2014 to 2015:
 $$\Delta Insurers_{r} \,{\equals}\,\beta _{o} {\plus}\beta _{1} UnitedHealthcare_{r} {\plus}\Delta X_{r} \delta {\plus}{\varepsilon}_{r} ,$$
where UnitedHealthcare rt serves as a dummy variable and takes a value of 1 if United Healthcare participated in rating area r in year t. In 2014, the first year of the marketplace, this variable takes the value of 0 for all rating areas, while taking the value of 1 throughout the 169 rating areas of 16 states in 2015. X rt is a vector of all other control variables given in equation (2).
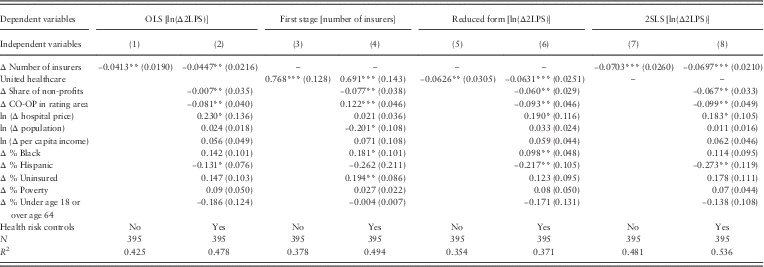
We present our results in the third and fourth columns of Table 4, with and without other control variables, respectively. In both specifications, coefficient estimates for United Healthcare’s participation are statistically significant and as high as 0.691 with full set of controls. The change in the share of non-profits, the change in the existence of a CO-OP, the change in the black percentage of the population and the change in the uninsured are also statistically significant.
Instrumental variables estimates of the effect of change in competition on change in premiums

Note: OLS=ordinary least squares; 2SLS=two-stage least squares; 2LPS=second-lowest-priced silver plan.
Standard errors are clustered by rating area and given in parentheses.
* p<0.10, ** p<0.005, *** p<0.01.
Exclusion restriction
If United Healthcare based its entry decision on an omitted factor that affects premiums, the resulting correlation with the error term would negate its ability to serve as an effective instrumental variable in our analysis. Although this is not testable due to data on omitted factors not being available, we can still compare rating areas where United Healthcare entered in 2015 to rating areas that it did not in terms of both the premiums and the included control variables. If United Healthcare did not target certain areas, then we can make a stronger argument that United Healthcare’s entry decision was exogenous in 2015, thereby rendering its entry as a viable instrumental variable.
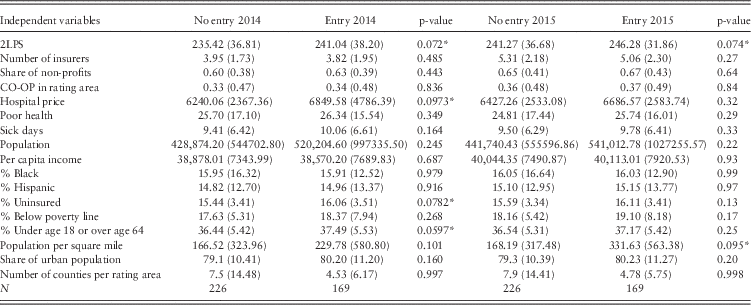
If the United Healthcare based its entry decisions on expected premiums, then this reverse causality of premiums affecting the entry decision would make our instrumental variable endogeneous. Therefore, in the first row of Table 5, we report the 2LPS across rating areas that United Healthcare entered in 2015 and across those that it did not. In 2014, the areas that United Healthcare subsequently entered the following year had an average 2LPS of $241.04 and the areas that it did not had an average of $235.42. However, this difference is not statistically significant at 5% significance level. Similarly, the average 2LPS in entry-areas was $246.28 in 2015, while the non-entry areas had a 2LPS of $241.27. We failed to reject the null hypothesis that the two areas had significantly different premiums. We do not have enough evidence to conclude that the United Healthcare might have based its entry decisions on expected premiums.
Comparison of rating areas by United Healthcare’s entry

Note: 2LPS=second-lowest-priced silver plan.
* p<0.10.
We report the means and standard deviations of all our included variables by United Healthcare’s entry decision in Table 5. The first three columns compare the rating areas in 2014, before United Healthcare’s entry. The last three columns compare rating areas post United Healthcare entry. In the third and sixth columns, we report the p-value for the null hypothesis that two means are equal in 2014 and 2015, respectively. All p-values are above 5%, indicating a failure to reject the null hypothesis. In other words, we do not have sufficient evidence to claim that United Healthcare selectively entered certain rating areas. For three select variables, their respective p-values are only marginally significant in 2014 at a 10% significance level: hospital price, percent uninsured, and percent under the age of 18 years or over the age of 64 years. This does not constitute a strong pattern in United Healthcare’s entry. Therefore, we feel confident that United Healthcare’s entry is exogenous in 2015 and unlikely to be correlated with omitted factors that affect the premiums.
Another factor that may have affected the entry decisions of United Healthcare into each rating area is the share of the urban population in that rating area. US Census Bureau considers areas with populations greater than 50,000 as ‘urbanized’ areas. We report the share of urban population in Table 5. The average rating area where United Healthcare entered had a somewhat larger share of urban population both in 2014 and 2015 than the areas where it did not. However, the wide variation in urban share of the population across ratings areas makes this difference statistically insignificant. Alternatively, we divide rating area populations by the rating area’s geographic size, provided by the US Census Bureau, to find population per square mile of each rating area. This variable does not demonstrate a noticeable difference between the two types of rating areas in 2014 or 2015.
Finally, United Healthcare may have based its entry decisions on counties per rating area, which may affect both the population and population density of rating areas. We report the average number of rating areas by year and the type of rating area in Table 5 along with its standard deviation. The rating areas that the United Healthcare entered had a lower number of counties per rating area in both years. However, standard deviations are quite high, making the differences statistically significant. Therefore, we fail to reject the null hypothesis that the number of counties is the same between two types of rating areas.
Another way to explore the factors that may determine how United Healthcare made the decision to enter certain rating areas is to run a simple multivariate OLS regression with a binary dependent variable that takes value 1 if United Healthcare entered a certain rating area in 2015. In this regression, we use 2015 values of all our independent variables. As United Healthcare did not know the 2015 data when they made a decision to enter certain rating areas, this regression would be using future values to predict United Healthcare’s decision. In this regression, we found three independent variables with marginally significant coefficients at 10% significance level: population, per capita income and poverty rate. United Healthcare was slightly more likely to enter rating areas with greater number of people and slightly less likely to enter poorer rating areas. None of these coefficients were significant at 5% significance level after controlling for all independent variables.
Reduced form
We regress the natural logarithm of the change in premiums from 2014 to 2015 on our instrument and other exogenous control variables in the reduced-form model:
 $$ln(\Delta 2LPS_{r} )\,{\equals}\,\beta _{o} {\plus}\beta _{1} UnitedHealthcare_{r} {\plus}X_{r} \delta {\plus}{\varepsilon}_{r} .$$
We display our results in the fifth and sixth columns of Table 4. All the coefficients have the expected signs. Without other controls, United Healthcare’s entry reduces the change in 2LPS by 6.26%. This effect is 6.31% when we include all other control variables. As the premiums increased from 2014 to 2015, average premium increase would be 6.31% lower in rating areas where United Healthcare entered as opposed to the rating areas that it did not.
2SLS estimates
As our final step, we estimate the 2SLS regression with United Healthcare’s entry in 2015 serving as the instrumental variable:
 $$ln(\Delta 2LPS_{r} )\,{\equals}\,\beta _{o} {\plus}\beta _{1} \Delta Insurers_{r} {\plus}\Delta X_{r} \delta {\plus}{\varepsilon}_{r} .$$
The binary variable above indicates United Healthcare’s 2015 entry for rating area r in 2015 as the instrument for ΔInsurers r. We present the results in the final two columns of Table 4. The coefficients indicate that competition has a significant effect on premiums. In magnitude, the coefficients are slightly higher than those from reduced-form estimates, confirming the positive correlation in the first-stage estimates. Compared with the OLS results, we find significantly higher effects of competition on premiums, thereby validating the initial endogeneity concerns.
To interpret the magnitude of the results, we consider the positive increase in 2LPS premium from 2014 to 2015 in a rating area. Based on our preferred specification in column 8, we find this premium increase would be 6.97% lower due to United Healthcare’s entry in a rating area. This effect is significant even at 1% significance level and higher than the 5.4% lower premiums with United Healthcare’s entry that Dafny et al. (Reference Dafny, Gruber and Ody2015) finds with fewer control variables.
We also find three other control variables to have statistically significant effects on the change in premiums. If there is at least one CO-OP in a rating area or if the share of non-profits increase, we observe a negative effect on premiums. CO-OPs and non-profit insurers have lower administrative costs; therefore, these plans are likely to offer lower premiums. We also find a negative effect on premiums as the percentage of Hispanics increase in a rating area. Hispanics are more likely to be uninsured and insurance companies may be offering lower premiums to incentivize and increase enrollment.
5.4 Threshold analysis
Insurance companies may lack adequate incentive to change their premiums if significant competition already exists in a rating area. We postulate whether the effect of competition on premiums varies by the initial level of competition. To validate this postulate, we run equation (5) for only those rating areas with a certain number of insurers in 2014. We identify this effect by the separate subsample analyses.
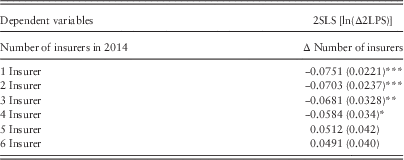
Table 6 displays the results of this threshold analysis, where each row corresponds to a separate regression. We only report the main coefficient of interest, β 1. Each individual regression includes only the rating areas with a specific number of insurers in 2014 and a full set of control variables. Coefficients are negative and significant for rating areas with 1, 2 or 3 insurers in 2014. This indicates that a rating area with four or more insurers in 2014 does not display a significant change in premiums as the number of insurers increase in 2015. For rating areas with only one insurer in 2014, one additional insurer in 2015 reduces the increase in 2LPS premium by 7.51%. The same effects are 7.03 and 6.81% for rating areas with two and three insurers in 2014, respectively. When a rating area has four or more insurers, we do not find any statistically significant effects on premiums as more insurers enter the rating area.
Threshold analysis of the effects of competition on premiums in the federally facilitated marketplaces

Note: 2SLS=two-stage least squares; 2LPS=second-lowest-priced silver plan.
Standard errors are clustered by rating area and given in parentheses.
*p<0.10, **p<0.005, ***p<0.01.
5.5 Robustness
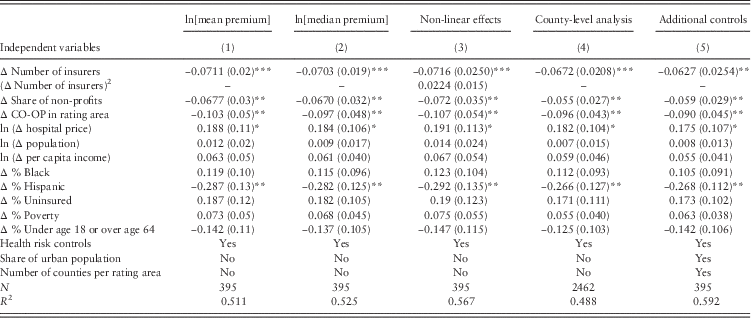
We examine the robustness of our results to alternative measures of premiums, non-linear specification of the regression model and using county-level data instead of rating areas. We present our results in the first two columns of Table 7 for alternative measures of premiums. The first column displays the results that we obtain by using the mean premium across all silver plans offered in a ratings area, instead of the 2LPS premium. In the second column, we do the same for the median premium across the silver plans. For both alternative measures of premiums, the coefficients have the expected signs and the significance levels do not change. The magnitudes are slightly greater than the coefficients for the same IV regression with 2LPS in the column 8 of Table 4. Therefore, we conclude that our results are robust to whether we use the 2LPS premium, mean premiums or median premiums as our dependent variable.
Robustness to alternative measures of premiums, non-linear specification, county-level analysis and additional controls

Note: Standard errors are clustered by state and given in parentheses.
*p<0.10, **p<0.005, ***p<0.01.
In column 3 of Table 7, we use a non-linear regression specification that includes the squared number of insurers. With this squared term, we allow for a non-linear relationship between competition and premiums. The coefficient of the squared term is small and not statistically significant. Therefore, we do not have evidence to claim that the results are driven by the omission of non-linearity in our regression models. In column 4 of Table 7, we use a non-aggregated version of our data set so that each observation represents a county, instead of a ratings area. With this version, we have 2462 counties in 34 states. The same IV method yields similar results to our ratings area-level analysis. Coefficients are similar in magnitude and significance levels. Therefore, our results are robust to a county-level analysis of competition’s effects on premiums in 2014 and 2015.
In the last column of Table 7, we include two additional control variables: share of urban population and number of counties per rating area. With these two additional control variables, magnitudes of the coefficients slightly change. However, the signs and significance levels are the same as all other 2SLS regressions. Our results are robust to the inclusion of these two variables in our econometric model.
6 Limitations
In this study, we use United Healthcare’s entry into certain markets as an instrument for the change in competition from 2014 to 2015. An effective instrumental variable must be correlated with the endogenous explanatory variable and uncorrelated with the error term. In the first-stage regression, we show that there is a high correlation between United Healthcare’s entry and the change in competition from 2014 to 2015. However, there is no way to test for the exclusion restriction due to the unavailability of data on omitted factors in the error term. If United Healthcare made entry decisions into certain areas based on omitted factors that also affect premiums, then our IV estimates would not be consistent. One such factor may be the varying risk pools in marketplaces across the country. Since other insurance companies that participated in the ACA in 2014 did not disclose claims data to United Healthcare, we do not believe that United Healthcare could have based its entry decisions on accurate estimates of risk. Additionally, executives at United Healthcare later admitted that they underestimated the risk pool in 2015. To minimize such concerns of endogenous entry, we include some factors that can imperfectly estimate the riskiness of each marketplace in our regression models. In addition, we find no correlation between our included factors and United Healthcare’s entry decisions in 2015 (Table 5). Therefore, we believe that these entry decisions were random and United Healthcare’s entry serves as a good IV for the change of competition from 2014 to 2015.
Another limitation of this paper is the scope of our data set. We analyze data from 2014 and 2015. However, there are strong indications that the level of competition in ACA’s marketplaces will decrease in 2017 and beyond.Footnote 6 Humana and United Healthcare announced that they will be pulling out of most marketplaces in 2017, due to large predicted losses. Aetna said it would rethink its expansion plans in 2017. Therefore, an expansion of this study into 2017 can shed more light into both the level of competition and its effects on premiums. ACA’s marketplaces are in transition and are not likely to settle for a few more years. This paper can only make conclusions about the first 2 years of these marketplaces, 2014 and 2015.
7 Conclusions
This research shows that increased competition reduced premiums in the ACA’s marketplaces during the first 2 years of implementation, 2014 and 2015. After controlling for 12 other control variables in a rating area and using United Healthcare’s 2015 entry as an instrument for competition, an additional insurer in the rating area results in a 6.97% reduction in second-lowest-cost silver plan’s premium. We find this effect to be statistically significant if there are fewer than four insurers in a rating area. In addition, we empirically show this effect to be robust to alternative measures of premiums, inclusion of a non-linear term in the regression models and a county-level analysis.
One limitation of this research is that United Healthcare may have based its entry decisions into certain areas on a factor that affects premiums. If this factor were omitted in our regressions, then our results would be biased. Although there are no data on omitted factors, we test whether United Healthcare’s entry decisions correlate with included factors. We find no evidence that there is any significant correlation. Another limitation is the timeframe of our data set, which does not include data from 2017 and beyond. Competition may have declined in later years, as some major insurers left the marketplaces after unexpectedly high losses. Some of the strengths of this paper are its usage of United Healthcare’s entry as an instrument for competition to deal with endogeneity in OLS regressions, its inclusion of recent panel data from ACA, its combination of multiple data sources and its ability to quantify the effects of competition on premiums.
Our findings provide support for positive effects of competition on premiums as individuals benefit from lower premiums offered by the competitive individual health insurance marketplaces. From a health policy perspective, we recommend states to define rating areas in such a way to expand competition among insurers. Since urban areas with more minority populations and fewer insurers have higher effects of competition on premiums, entry into these areas can be encouraged by states. Since the major provisions of the ACA have been implemented in 2014, it would take a few more years to observe how these factors play out in the marketplaces.
Acknowledgments
The authors are grateful to Jordan G. Holding and Sri Mitra Mulukutla for their contributions to this paper. This paper also benefitted from valuable comments made by the participants at the Southern Economic Association’s Annual Meetings on 21–22 November 2015 in New Orleans, LA. The authors are responsible for any errors. Comments are welcome.