INTRODUCTION
Equine piroplasmoses are caused by two intra-erythrocytic protozoa, Theileria equi and Babesia caballi. Both are transmitted by ixodid ticks (Friedhoff, Reference Friedhoff and Ristic1988). Clinical signs of infection may vary from asymptomatic to acute fever, anaemia and dyspnoea, and even death (reviewed in Schein, Reference Schein and Ristic1988). Chronically infected horses represent a reservoir infecting ticks, which subsequently transmit the parasites to other equids. Piroplasms can be detected directly by microscopical examination of Giemsa-stained thin blood smears or by polymerase chain reaction (PCR) (Bruning, Reference Bruning1996), and for indirect diagnosis, the immunofluorescence antibody test (IFAT) is the most widely used technique (Gummow et al. Reference Gummow, de Wet and de Waal1996; Avarzed et al. Reference Avarzed, de Waal, Igarashi, Saito, Oyamada, Toyoda and Suzuki1997; Heuchert et al. Reference Heuchert, de Giulli, de Athaide, Böse and Friedhoff1999).
The epidemiology of equine piroplasmoses has been investigated in various studies (Mahoney, Reference Mahoney1969; Mahoney and Ross, Reference Mahoney and Ross1972; Ross and Mahoney, Reference Ross and Mahoney1974; Smith, Reference Smith1983; Dallwitz et al. Reference Dallwitz, Young, Mahoney and Sutherst1987; Medley et al. Reference Medley, Perry and Young1993). In 2004, a study was conducted in a domestic horse population in south-western Mongolia (Rüegg et al. Reference Rüegg, Torgerson, Deplazes and Mathis2007). PCR results indicated a T. equi prevalence of 66·5% (95% CI: 62·2–70·7) and the IFA test demonstrated that 78·8% (95% CI: 74·9–82·3) of animals had seroconverted to T. equi. The corresponding values for B. caballi were 19·1% (95% CI: 15·7–22·8) and 65·7% (95% CI: 61·4–69. 9) respectively. To investigate the impact of age, herd affiliation, sex, date of sample collection and tick abundance on the PCR and IFAT prevalences, a generalized linear model (GLM) and a generalized additive model (GAM) were used. In both models, sex and age were the only two significant explanatory variables (Rüegg et al. Reference Rüegg, Torgerson, Deplazes and Mathis2007). Despite being useful for detection of risk factors and testing hypotheses about relationships of explanatory variables, GLMs and GAMs are in general not adequate to gain insight into the transmission process. Hence, in this work, a mathematical model describing the transmission dynamics is applied which yields a biological interpretation of the prevalence in horses in terms of transmission parameters. For Theileria such a mathematical transmission model has been presented based on the epidemiology of east coast fever (ECF, T. parva) in cattle (Medley et al. Reference Medley, Perry and Young1993). A model for Babesia in cattle has existed since the 1960s (Mahoney, Reference Mahoney1969) and has been extended in various versions (Mahoney and Ross, Reference Mahoney and Ross1972; Ross and Mahoney, Reference Ross and Mahoney1974; Smith, Reference Smith1983). These models have been used to simulate the prevalence of piroplasms in cattle and to evaluate strategic interventions in the epidemiological cycle. Dallwitz et al. (Reference Dallwitz, Young, Mahoney and Sutherst1987) suggested that because Theileria and Babesia have primarily quantitative rather than qualitative differences in their transmission dynamics, a single model should be able to summarize the biological particularities of both. Therefore, in the present work a series of nested models for different transmission scenarios is presented. Their application to the field data from Mongolia provides insight into the transmission process as opposed to the purely descriptive tools of GLMs and GAMs (Rüegg et al. Reference Rüegg, Torgerson, Deplazes and Mathis2007). An exhaustive Monte Carlo simulation study is conducted to select the best fitting model for both parasites.
MATERIALS AND METHODS
All procedures were performed using the statistical software R 2.4.0 (R Development Core Team, 2006). The Monte Carlo simulation study was conducted on the high performance computing cluster system ‘Matterhorn’ of the University of Zürich, providing a floating point performance of approximately 2·9 TFlops with 10 TByte memory. The data file and the code for the models are available online as supplementary data.
Two compartment model
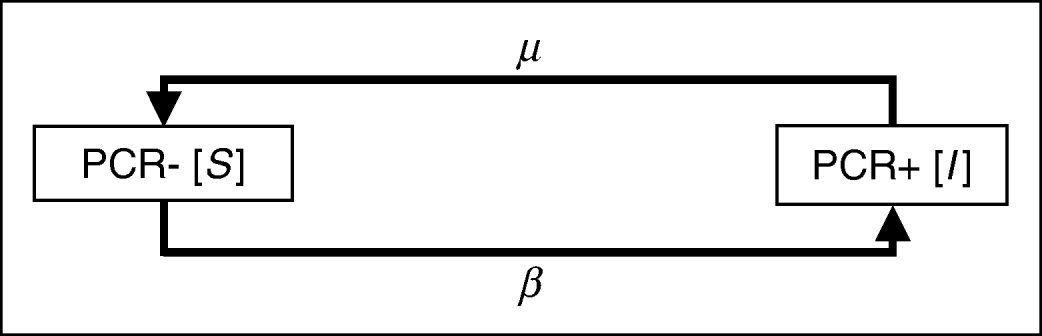
In a first approach, the dynamics of parasite acquisition and elimination are described with a simple two-compartment model. The population consists of a group of non-infected animals (S) and a group of infected animals (I). The model describes the age-dependent dynamics between the two groups. A proportion of the horses (I(0)) is infected at birth. Susceptible (non-infected) animals transfer to the infected group with an age-independent acquisition rate β. Hence β can be considered as the prevailing infection pressure per time unit and population. With an age-independent rate μ, infected animals lose all parasites and return into the susceptible group. The model is graphically represented in Fig. 1 and the corresponding ordinary differential equation (ODE) is given in equation (1). A constant population size is assumed, i.e. there is no immigration or emigration. Integrating ODE (1) over the time-interval [0, t] yields the age-dependent prevalence equation (2). Note that I(0) is the initial proportion of infected animals.


- where I(t)
=proportion of horses in the infected group at age t;
- β
=rate of acquisition of infection;
- μ
=rate of loss of infection.
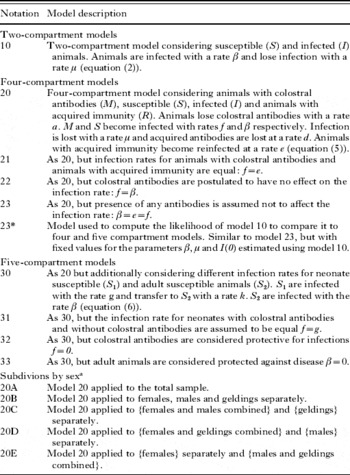
Equation (2) will be denoted as model 10. A complete list of all models used in this paper is given in Table 3. Model 10 is a logical extension of the model presented by Mahoney (Reference Mahoney1969), which was adapted from malaria to the case of bovine babesiosis under the assumption of endemic stability. It explained the proportion of infected animals (I(t)) in terms of the recovery rate (r), the inoculation (h) and the age (t) of the individual animal:

Graphical representation of model 10. The model considers an age-independent acquisition rate β and an elimination rate μ. Two compartments represent the susceptible (PCR−) and infected (PCR+) animals in the population. Individuals move between the two compartments at the end of each age interval.

Mahoney's model (3) needs to be restricted such that r⩾h to obtain an asymptotic antigen-prevalence not exceeding 1. In contrast, the present model is self-restricting due to the term  . Since Mahoney and coworkers assumed that there are no infections present at birth, i.e. I(t=0)=0, β corresponds to their inoculation rate h and β+μ to their recovery rate r.
Four compartment model
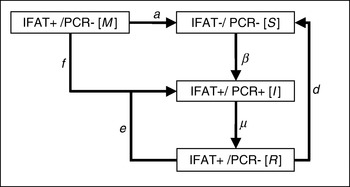
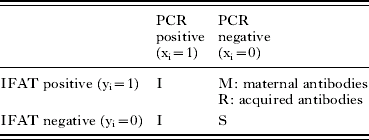
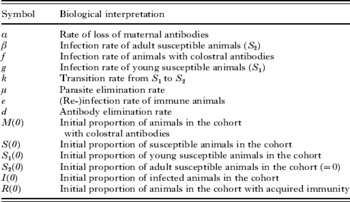
Model 10 oversimplifies the disease transmission because one would expect that immunity of an individual animal influences successful establishment of an infection. Therefore, the two-compartment model is expanded by including the immune status information of each animal (model 20, see equation (5)). This additional information is obtained using an immunofluorescence antibody test (IFAT) and leads to a new subdivision of the population into 4 compartments as shown in Table 1. The dynamics between these compartments correspond to the events during an infection under endemic conditions and are graphically represented in Fig. 2. They can be explained as follows. A proportion of animals is born with maternal antibodies and is thus IFAT positive and PCR negative (IFAT+/PCR−). They lose their maternal antibodies, i.e. become IFAT−/PCR−, or they are infected and thus become IFAT+/PCR+. IFAT−/PCR− individuals acquire the parasite (IFAT−/PCR+) before generating antibodies against the pathogen (IFAT+/PCR+). Because this seroconversion requires a relatively short time lag of a few weeks, the differentiation of these two states is considered to be negligible in the model. Once infected, the immune reaction is either successful and eliminates the parasite (IFAT+/PCR−), or the animal remains positive (IFAT+/PCR+) due to an unsuccessful elimination. If the parasites are eliminated, the antibodies are eventually lost (IFAT−/PCR−) or the animal is re-infected (IFAT+/PCR+). For each time-interval, each animal in the population is in exactly one of the defined states. At the end of an interval, each animal either moves to a new state or remains in the same state for another interval. The animals move from one state to the next according to transition rates which depend only on the current state (they do not take any previous history into account). These rates are represented in Fig. 2 and their biological interpretation is explained in Table 2. Note that the transition rates in the model do not change over time and that all parameters have a corresponding epidemiological meaning: β is the infection rate for seronegative individuals, whereas e and f represent the infection rates for animals with acquired immunity and passive (maternal) immunity, respectively. The elimination rate of the parasite corresponds to μ, and d is the rate at which acquired antibodies are lost after infection, whereas a represents the constitutive loss of maternal antibodies. The whole dynamical process can be written as a system of ODEs in matrix form as

where A is shorthand for the matrix of transition rates. Here, M(t) is the juvenile part of the proportion of animals with IFAT+/PCR− at age t, S(t) the proportion of animals with IFAT−/PCR− at age t, I(t) the proportion of animals with IFAT±/PCR+ at age t and R(t) the remaining adult proportion of animals with IFAT+/PCR− at age t. The system of ODEs can be solved by integrating the left and the right term in equation (4) over the time range [0, t] and the following explicit solution is obtained:

Graphical representation of model 20. Four compartments represent the maternally protected subpopulation (M), the populations of susceptible (S), infected (I) and immune (R) animals. At the end of each age-interval animals move between the compartments with age-independent rates. The rates β, e and f correspond respectively to the acquisition rates without humoral protection of the host, with acquired immunity and with passive maternal protection. The parasites are eliminated with rate μ, and a and d are the respective rates at which maternal and acquired antibodies are lost.

PCR and IFAT status of animals in the four-compartment models

Symbols and biological interpretation of the parameters

For the initial states, we assume that M(0)+I(0)+S(0)+R(0)=1 and that there are no animals with acquired immunity, i.e. R(0)=0. The exponential of a matrix as given in equation (5) is computed using the function expm of the statistical software R. The model may be simplified in order to test different hypotheses and to reduce the number of parameters. Model 21 postulates that the infection rates for animals with maternal antibodies and for animals with acquired immunity are equal. Thus the parameter f is set equal to e in the ODE's. Model 22 postulates that passive maternal immunity has no effect on the infection rate and f is set equal to β. In model 23 it is assumed that the presence of antibodies does not affect the infection pressure at all, so that all 3 parameters e, f and β are equal. The symbols and parameters as well as the model descriptions are summarized in Tables 2 and 3.
Notation and description of models used

a Notation analogous for models 21–33.
The transmission matrix (4) and matrix exponentiation (5) allow an intuitive extension of model 10 to incorporate immunological information. Medley et al. (Reference Medley, Perry and Young1993) have developed similar models for theileriosis using ODEs, but the number of parameters to be estimated in their models was very high. Because no adequate samples were available to estimate all parameters simultaneously, they estimated some parameters based on single ODEs and the corresponding parts of the data. This procedure introduces bias into the estimates (Randolph and Nuttall, Reference Randolph and Nuttall1994). Even if the present model oversimplifies the complexity of the actual disease processes, it allows one to simultaneously estimate all parameters based on the same data set, and thus to incorporate interaction effects between PCR and IFAT information. This finally provides a more accurate description of the transmission dynamics.
Five-compartment model
The assumption for the four-compartment model that the infection rates are age-independent may not be adequate. Thus the model is further expanded by subdividing the compartment of susceptibles into young susceptible animals (S 1) and old susceptible animals (S 2) as depicted in Fig. 3. The principal dynamics of the model are the same as in the four-compartment model, however S 1 become infected at a rate g different to the rate β at which adult susceptible animals (S 2) are infected. S 1 transfer to S 2 with a rate k. The corresponding system of ODEs in matrix form is
Graphical representation of model 30. Five compartments represent the maternally protected subpopulation (M), the populations of susceptible foals (S1), susceptible adults (S 2), infected (I) and immune (R) animals. At the end of each age-interval animals move between the compartments with age-independent rates: The rates f, g, β and e correspond respectively to the acquisition rates for foals with passive maternal protection, for foals without humoral protection, for adult animals without humoral protection and animals with acquired immunity. The parasites are eliminated with rate μ, and a and d are the respective rates at which maternal and acquired antibodies are lost. Susceptible foals transfer to the compartment of susceptible adults at a rate k.


The symbols and parameters are summarized in Table 2. In analogy to the four-compartment model, the system of ODEs is solved by integrating the left and the right terms in equation (6) over the time range [0, t] to obtain the explicit solution. For the initial states, we assume that M(0)+I(0)+S 1(0)+ S 2(0)+R(0)=1 and that R(0)=S 2(0)=0. The procedures in the statistical software R are identical to those utilized for the four-compartment model. Again, variants of the model allow the testing of particular hypotheses. Model 31 assumes that animals with colostral antibodies and young susceptible animals have the same rate of infection (f=g). Model 32 assumes that foals with colostral antibodies are protected from infection (f=0) and model 33 assumes that adult susceptible animals are immune to infection (β=0). A summary of the model variants is presented in Table 3.
Maximum likelihood estimation
Model 10 returns a proportion of infected animals I(t) as a function of age t. This corresponds to the probability of an animal being infected at age t. The proportion of susceptible horses at age t corresponds to 1−I(t). Assuming that the infection statuses of the horses in the sample are independent of each other, the estimation of the parameters is based on the maximization of the following binomial likelihood function (L):

- where N
=number of individuals in the population;
- x i
=infection status (1 or 0) of individual i (PCR);
- t i
=age of individual;
or equivalently, the maximization of the following log-likelihood function (LL):

Models 20, 21, 22 and 23 (Table 3) consider 4 compartments based on the combinations of 2 conditions (PCR and IFAT, compare Table 1) and return the proportion of animals in each compartment at any given age t. The probability of finding an animal in a given compartment thus corresponds to this proportion at the corresponding time t. Assuming independence of the infection and immunological statuses, the likelihood for this case is a multinomial likelihood function:

The corresponding log-likelihood function is:

- where N
=number of animals in the population;
- x i
=PCR status (1 or 0) of individual i;
- y i
=IFAT status (1 or 0) of individual i.
Models 30, 31, 32 and 33 (Table 3) consider 5 compartments based on the combinations of 2 conditions (PCR and IFAT, compare Table 1) and return the proportion of animals in each compartment at any given age t. Again, assuming independence of the infection and immunological statuses, the likelihood for this case is the following function:

The corresponding log-likelihood function is:

The data used to calculate the log-likelihoods (8), (10) and (12) are from the cross-sectional study in southwest Mongolia (Rüegg et al. Reference Rüegg, Torgerson, Deplazes and Mathis2007), where the data sets for T. equi and B. caballi were obtained from the same horse population. To find the maximum likelihood (ML) estimates of the parameters, the LL-functions (8), (10) and (12) given the data are maximized using the optim function of the statistical package R. The function is specified to use the ‘L-BFGS-B’ algorithm (Byrd et al. Reference Byrd, Lu, Nocedal and Zhu1995), a Newton procedure that allows for box constraints. Newton procedures generally provide good local convergence criteria, but since we search for global maxima, the starting points need to be selected carefully. The value of 0·1 for all parameters was assessed to be an appropriate starting point. For nested models, the ML estimates of the embedded model were used as starting point. For biological reasons, the parameter values are constrained to be larger than 0 and M(0) and I(0) are additionally constrained to be smaller than 1.
To evaluate the effect of gender on disease transmission, the horse population is subdivided into 4 combinations of females, males and geldings and the models are fitted to each of the subpopulation (represented as {}) separately. A model fitted to the whole sample, i.e. {females, males, geldings}, is denoted by A (e.g. model 20A). A model fitted to {females}, {males} and {geldings} separately is referred to as B (e.g. model 20B), a model with a separate fit for the 2 subpopulations {females+males} and {geldings} is referred as C, for {females+geldings} and {males} as D and finally for E {females} and {males+geldings} (see Table 3). The LL value for a particular combination is defined as the sum of the LLs of the individual fits to each of the corresponding subpopulations. Because geldings are castrated at age 1, the starting values of the model for geldings are chosen as the corresponding proportions of M, S (resp. S 1, and S 2 for the 5 compartment models), I and R of 1-year-old {males} in the combination B or analogously of 1-year-old {females+males} in the combination C. For simplicity, the general model is referred to without an alphabetical extension (e.g. model 10, model 20, model 21 etc.). The alphabetical suffix is only used for models fitted to a particular subdivision into gender groups.
Model comparison
Model 10 assumes that antibodies do not influence the infection rate. Because its likelihood function does not take into account the IFAT results, the LL can not be directly compared to those of the 4- and 5-compartment models (Table 4). Model 23 is based on the same assumption as model 10, but includes the IFAT data in calculating the likelihood function. To compare the results from model 10 with the ones of the more complex models, a modified version of model 23 is used. The parameters β, μ and I(0) in model 23 are fixed by using the corresponding ML estimates from model 10, and the remaining parameters a, d and M(0) are estimated. We will refer to this derived model as model 23*. To verify that the remaining parameters a, d and M(0) in model 23* do not have any influence on the PCR prevalence, and hence that model 23* would correctly reflect the PCR prevalence estimated for model 10, the parameters a and d are varied between 0 and 100 and M(0) is varied between 0 and 1−I(0) (since M(0)+S(0)+I(0)=1) and the results are compared (Fig. 4). Thus model 23* provides an interface model to compare model 10 to the four- and five-compartment models.
Effect of varying the model parameters a (panel A), d (panel B) and M(0) (panel C) in model 23 for fixed values of the remaining parameters. The values of the parameters β, μ and I(0) are set identical in model 10 and model 23. To evaluate the effect of varying a, d and M(0), the age-dependent prevalence of PCR+ animals is plotted for both models (thick lines) and the proportion of IFAT+ animals is plotted for model 23 (thin lines). The parameters a, d and M(0) appear not to have any effect on the PCR prevalence, as the age-dependent prevalences in models 10 and 23 are identical in the graph (thick lines).

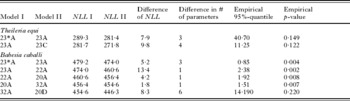
Results of the pair-wise model comparisons using Monte Carlo simulations

Model selection
To decide which model performs best with the T. equi and the B. caballi data sets, we first compute the log-likelihood of each of the competing models, and plot them against the number of parameters (Fig. 5). For clarity, the negative log-likelihood scores (NLL) are plotted. Starting with the simplest model 23*, the models with the steepest decrease in NLL score per number of parameters are further investigated (Fig. 5, grey line). Neighbouring models on this line are compared pair-wise as follows. The difference in NLL of 2 competing models is tested by comparing it with an empirical 95%-quantile. The null hypothesis is that the more complex model does not improve the fit. To accept the more complex model, the reduction of the NLL compared to the simpler model needs to be larger than the empirical 95%-quantile (α=0·05), i.e. a reduction of the magnitude observed would occur due to chance alone in less than 5% of the cases. To compute the empirical 95%-quantile, 500 populations are simulated under the null hypothesis that the simpler model is true. The simulated populations have the same size (N=510) and the same gender distribution (f:m:g:NA=259:118:128:5) as the original data set. A PCR and IFAT status is attributed to the individuals, based on simulation using the simpler model with the ML estimates from the field data. The simulated data sets are then fitted using the same optimization routine as described above, and the difference of the NLL values is calculated for each simulated population. If the optimization does not converge with the default tolerance, the NLL-function is scaled by a factor of 10 thereby reducing the tolerance by this factor. Finally, if convergence is still not obtained, the corresponding population is replaced. The 95%-quantile of the resulting empirical sampling distribution of the NLL-differences is then compared to the NLL-difference derived from the field data. The pairwise comparisons are continued following the model series represented in Fig. 5 (grey line) until the null hypothesis of no difference between 2 successive models cannot be rejected. The last significant model is considered to best fit the data. For the final selected model, the 95% bootstrap confidence intervals (CI) of its parameters are computed.
Comparison of the fitting characteristics of competing models (Table 3) for (A) Theileria equi and (B) Babesia caballi. The negative log-likelihood is plotted against the number of parameters used in the model. The best fitting models are compared pair-wise along the border of the convex hull from the plotted points since these models are better than all competing models with the same number of parameters. Starting with the model with the least number of parameters (grey circles), models on the border are pair-wise compared (grey lines) until a non-significant difference is reached (grey broken line).

RESULTS
Models 10 and 23
If the maximum likelihood estimates for β, μ and I(0) of model 10 are introduced into model 23, the course of the PCR prevalences are identical for both models (Fig. 4). Modification of the parameters a, d, and M(0) in model 23 does not alter the course of the PCR prevalence but has significant impact on the IFAT prevalence.
Best-fitting models
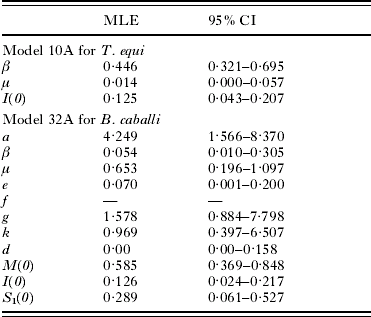
The minimal values of the negative log-likelihood for all models are plotted versus the number of parameters in Fig. 5. Based on this plot, for T. equi, model 23* applied to the undivided population (referred to as 23*A) is compared to model 23A and the null hypothesis cannot be rejected at a 5% test level (empirical p-value=0·15). Also the succeeding comparison between model 23A for the undivided population and model 23C applied to the population subdivided into {females+males} and {geldings} revealed no significant difference (empirical p-value=0·122, Fig. 5A, Table 4). These findings indicate that the IFAT does not provide additional significant information to the transmission dynamics process and thus antibodies do not appear to influence the transmission of T. equi. The ML estimates for β, μ and I(0) and their 95% bootstrap confidence intervals are given in Table 5 and the age-dependent PCR-prevalence of the best fitting model is plotted in Fig. 6A. In summary, as μ is 0·014, T. equi remains as a life-long infection (95% CI of 1/μ=17·9 years–Infinity). From the ML estimate of β (0·446) it can be deduced that half the animals are expected to be infected with T. equi at about 2 years of age (95% CI of 1/β=1·4–3·1years) and I(0) suggests that 12·5% (95% CI: 4·3–20·7%) of the population are already infected at birth.
Plot of the observed PCR (black bullets) and IFAT prevalence (grey bullets) with 95% binomial confidence intervals (whiskers) for (A) Theileria equi and (B) Babesia caballi. The best fitting models using the maximum likelihood estimates for the corresponding parameters, 10A and 32A respectively, return the age-dependent PCR prevalence (black line) and IFAT prevalence (grey line).

Maximum likelihood estimates (MLE) and 95% bootstrap confidence intervals (using 500 bootstrapped populations) of the best performing models for Theileria equi and Babesia caballi
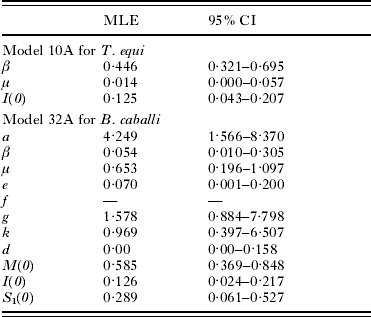
For B. caballi, the models 23*A, 23A, 22A, 20A, 32A applied to the undivided population and model 20D applied to the population subdivided into {females+geldings} and {males} are compared pairwise (grey line, Fig. 5B, Table 4). The first 4 comparisons all reject the null hypothesis that the simpler model performs better (Table 4). The succeeding comparison of model 32A to model 20D, however, detects no statistically significant difference (empirical p-value=0·220). Thus, a single fit of model 32A for the whole sample represents the epidemiology of B. caballi in the sampled population best. A summary of the ML estimates for the parameters and their 95% bootstrap confidence intervals are given in Table 5. The age-dependent PCR- and IFAT-prevalences of the best fitting model are plotted in Fig. 6B. Thus, colostral antibodies protect foals from infection (f=0) and have a half-life of approximately 3 months (95% CI of 1/a=1·4–7·6 months). Further, the infection rates of susceptible foals (g=1·578) differs significantly from that of older susceptible animals (β=0·054) with susceptible foals being expected to become infected within 8 months (95% CI of 1/g=1·5 months – 1·2 years) whereas for adult susceptible animals this is expected after roughly 18 years (95% CI of 1/β=3·3–100 years). The rate k=0·969 indicates that the susceptible foals are expected to transfer to the category S 2 at the age of approximately 1 year (95% CI of 1/k=1·8 months–2·6 years). As μ=0·653, B. caballi is expected to persist in its host for roughly 1·5 years (95% CI of 1/μ=10·9 months–5·1 years). If an animal has eliminated the parasite, the typical time to acquire a new infection is of the order of 14 years (95% CI of 1/e=5–1000 years). Thus, with a life expectancy of 20 years re-infection is rather unlikely to occur. The ML estimates for I(0) and M(0) indicate that Î(0)=12·6% (95% CI=2·4–21·7%) of foals are infected at birth or very shortly afterwards and  (0)=58·5% (95% CI=36·9–84·8%) receive colostral antibodies from their mothers. Therefore for 100%−Î(0)−(0)=28·9% (95% CI=6·0–52·7%) of the births, the mare was not exposed to B. caballi prior to birth. Because the estimate for d=0·00, antibodies against B. caballi appear not to be eliminated.
DISCUSSION
The results of the model selection show that T. equi and B. caballi have very different transmission dynamics, and provide a further piece of evidence for the current debate on the systematic classification of T. equi. The PCR-prevalence of T. equi observed in Fig. 6A shows a cumulative age-dependent course, whereas the prevalence peak at 11 months in Fig. 6B (B. caballi) is very similar to the patterns observed with B. bovis and B. bigemina in cattle (Mahoney, Reference Mahoney1962). The results of the present study also support the anecdotal reports of various authors (Hourrigan and Knowles, Reference Hourrigan and Knowles1979; Schein, Reference Schein and Ristic1988; de Waal and van Heerden, Reference de Waal, van Heerden, Coetzer, Thomson and Tustin1994) that T. equi remains as a life-long infection, whereas the expected persistence of B. caballi in its host is 1·5 years which is similar to the postulated persistence of 1 to 4 years. The estimated half-life of colostral antibodies against B. caballi of 3 months agrees with previous findings that maternal antibody titres against B. caballi are already below the detectable cut-off at approximately 4 months of age (Donnelly et al. Reference Donnelly, Phipps and Watkins1982; Rüegg et al. Reference Rüegg, Torgerson, Doherr, Deplazes, Böse, Robert and Walzer2006). The result that acquired antibodies are not eliminated is in agreement with experiments conducted by Tenter (Reference Tenter1984), in which IFAT antibodies against T. equi and B. caballi remained throughout the observations (476 and 190 days post-infection, respectively). Our analysis thus indicates that the approach of estimating host infection rates based on serological data applied by Mahoney and coworkers (Mahoney, Reference Mahoney1969; Mahoney and Ross, Reference Mahoney and Ross1972) is adequate, and may also be applied to equine piroplasmoses. It also implies that for the diagnosis of T. equi-positive IFAT results generally correspond to an actual infected status, whereas, for B. caballi, a horse may be seropositive without harbouring the parasite.
In this work, the infection rates β, f, g and e are considered to be age independent. The better performance of model 32A compared to model 20A, however, indicates that a differentiation of susceptible foals and susceptible adult animals provides a better fit to the data. Also, the binomial likelihood function assuming independence of the PCR and the IFAT result within the same individual may not be the best choice. More complex models could account for these shortcomings. However, it should be noted that the interpretability of a model suffers with increasing complexity. The exponential dynamics and binomial likelihood of the models presented here can be understood intuitively. It is also the case that the infection rates vary within a year due to varying tick activity. In our model the seasonal variation is averaged to yield simple infection rates per annum. Similarly, the time for interstadial development of the transmitting tick and the resulting latencies in the transmission process are also neglected. The model fit illustrated in Fig. 6 suggests that these simplifications are nonetheless reasonable. It is also not known if the infection rate in ticks remains constant from year to year, and the age dependency that we have found could have been due to increased tick infectivity in the sampling year. However, from anecdotal reports from the owners of the horses investigated, there has not been an increase in piroplasmosis cases in the sampled population, which, considering the difference between β=0·054 and g=1·578, would have been expected to be dramatic. It should also be noted that despite confirmed presence of T. equi and B. caballi in the tick Dermacentor nuttalli (Battsetseg et al. Reference Battsetseg, Lucero, Xuan, Claveria, Byambaa, Battur, Boldbaatar, Batsukh, Khaliunaa, Battsetseg, Igarashi, Nagasawa and Fujisaki2002), the observed prevalences in ticks from the study area were 0‰ (95% CI=0–4‰) for T. equi and 6‰ (1–17‰) for B. caballi (Rüegg et al. Reference Rüegg, Torgerson, Deplazes and Mathis2007). In the absence of reliable data for the parasite distribution in ticks it is difficult to test additional hypotheses, including the population dynamics of the vector.
The fundamental aim of the approach presented here is to address the shortcomings of the statistical methods often used in epidemiology, such as (a) fitting models with no (meaningful) relationship to the underlying transmission process and (b) making asymptotical assumptions about the test statistics which may not be justified. The approach in the present article provides alternatives to (a) and (b). As an example for (a), methods like generalized linear models (GLM) allow a flexible fit to data, but the resulting parameter estimates are often difficult or even impossible to interpret in biological terms. To address this point, the models presented in this article describe the transmission dynamics of T. equi and B. caballi with biologically interpretable parameters. Consequently, the parameter estimates can be compared to results from experimental studies to evaluate their reliability and validity. These comparisons have shown that our models provide relevant insights into the epidemiological processes involved in the transmission of equine piroplasmoses. To address point (b), likelihood ratio tests are applied using empirical probability distributions of the test statistic generated with Monte Carlo simulations. Conventionally, a χ2-distribution is used for the likelihood test statistic to select the best fitting model. However, this asymptotical distribution is only valid under conditions which are not satisfied for many of our model comparisons. Indeed, a likelihood ratio test based on a χ2-distribution with 3 degrees of freedom would yield a p-value of 0·001 for the comparison of model 23*A and 23A for T. equi as opposed to the non-significant empirical p-value of 0·122 based on our Monte Carlo approach. Similarly, for the comparison of model 32A versus 20D for B. caballi, the p-value based on a χ2-distribution with 6 degrees of freedom would be 0·011 compared to the empirical p-value of 0·221 which is non-significant. Thus, in each case, the putative significant p-values of the test with a χ2-distribution would lead to a wrong model selection.
The authors wish particularly to thank Jean-Pierre Gabriel and Christian Mazza from the Institute of Mathematics at the University of Fribourg and Richard Baltensperger from the College of Engineering and Architecture of Fribourg for the discussion on the solution of the ODEs and the ‘Informatikdienste’ of the University of Zürich for installing R on the ‘Matterhorn-cluster’ so rapidly. We would also like to thank the referees for their extremely valuable comments on the manuscript. This project was partially financed by the Forschungskredit der Universität Zürich 2003.