Introduction
In quality assurance (QA) of radiotherapy treatment planning, different parameters regarding dose–volume point, dose distribution and radiobiology are used in evaluating a plan to decide if it is acceptable in dose delivery.Reference Fraass, Doppke and Hunt1–Reference Smilowitz, Das and Feygelman3 These plan evaluation parameters include dose–volume parameters such as D99% and D95% of the target, and D5% and D35% of the organ at risk (OAR); dose distribution parameters such as the conformity index, homogeneity index, and gradient index of the planning target volume (PTV)Reference Feuvret, Noël, Mazeron and Bey4–Reference Chow, Jiang, Kiciak and Markel8; as well as radiobiological parameters such as the tumour control probability for the target, normal tissue complication probability for the OAR and equivalent uniform dose for the target and OAR.Reference Webb and Nahum9–Reference Niemierko11 Calculations of the above parameters require specific mathematical formulas and understanding of the related theory in dose distribution or radiobiological effect.Reference Warkentin, Stavrev, Stavreva, Field and Fallone12 Selecting which parameters in the plan evaluation are complex and depends on the experience in treatment planning QA.Reference Paudel, Narayanasamy and Han13, Reference Isa, Jiang, Kiciak, Rehman and Afzal14 Moreover, each plan evaluation parameter can only focus on one dose–volume or radiobiological characteristic for the target or OAR. It is therefore desired to simplify such a plan evaluation process, for example, using an evaluation parameter capable of covering all the dose–volume characteristics of the target and all OARs, so that two different treatment plans can be compared comprehensively and unambiguously. This avoids many evaluation parameter calculations and justifications among different calculated parameters.
Based on dose–volume histograms (DVHs) from a radiotherapy treatment plan, Alfonso et al.Reference Alfonso, Herrero and Nunez15 suggested a plan evaluation parameter called dose distribution index (DDI). Instead of only considering the dose–volume characteristic of the target or a particular OAR in the plan, DDI provides estimates on target coverage, sparing of all OARs and remaining healthy tissue in the treated organ. DDI has been proved to be effective as a straightforward tool in dosimetric comparison of treatment plans.Reference Alfonso, Herrero and Nunez15 In this study, DDI was used to evaluate prostate volumetric modulated arc therapy (VMAT) plans using different inverse planning optimisers. VMAT is currently one of the most popular dose delivery techniques in prostate radiotherapy, and will eventually substitute the relatively older intensity-modulated radiotherapy (IMRT) and 3D conformal radiotherapy.Reference Chow, Jiang and Kiciak16–Reference Davidson, Blake, Batchelar, Cheung and Mah18
Recently, a plan optimisation method called photon optimisation (PO) was introduced in the newer version of the Eclipse treatment planning system (Varian Medical System, Palo Alto, CA) to replace the older one, progressive resolution optimisation (PRO).19 The PO combined the dose–volume algorithm used in the step-and-shoot IMRT plan and the PRO algorithm used in the VMAT plan. In the newer PO method, dosimetrist can define the voxel resolution of the calculation grid and aperture shape before optimisation. Moreover, the PO supports jaw tacking through the motion mode and speed limits defined for each collimator in a Varian linear accelerator (Varian Medical System, Palo Alto, CA). The main difference between the PO and PRO is that the point cloud model used by the PRO is replaced by a new structure model, in which the structures, DVH calculation and dose sampling are all defined using a single matrix over the patient image.
There are only a few dosimetric comparisons of treatment plans created by the PO and PRO. For the lung stereotactic body radiotherapy treatment plan, Liu et al.Reference Liu, Sintay and Pearman20 found that the complexity in the beam segments in the delivery beams, and their monitor unit could be minimised using the PO compared to the PRO. However, the dosimetry of plans between the two optimisation methods was very similar. Binny et al.,Reference Binny, Kairn, Lancaster, Trapp and Crowe21 in contrast, found that the PRO in fact produced less complex plans and fewer monitor units than the PO based on prostate, brain and head-and-neck intensity-modulated arc therapy plans. Jiang et al.Reference Jiang, Wu, Yue, Jia and Zhang22 compared dosimetric results of rectal plans created by the PO and PRO. They found that the PO could reduce OAR exposure by 23·49–32·72% in the plan, but it required more monitor unit. The aim of this study was to compare the dose distribution of prostate VMAT plans created by the PO and PRO using the DDI, which considers both the target dosimetric overage and sparing of all OARs.
Methods and Materials
Patients and treatment planning
Twenty prostate VMAT plans from the Grand River Hospital were used in this retrospective study. For each treatment plan, the CT image set of the patient was acquired with an empty rectum and full bladder. The gross tumour volume and clinical target volume (CTV) were equal to the prostate volume. The PTV was created with expansion of the CTV with 1 cm margin except 0·7 cm posteriorly. The targets (PTV and CTV), OARs of rectum, bladder and femurs were contoured by the same person using the Eclipse treatment planning system, version 13.5.
The dual-arc technique using 6 MV photon beams produced by a Varian TrueBEAM linear accelerator (Varian Medical System) was used in the VMAT plan with dose prescription equal to 78 Gy/39 fractions.Reference Chow and Jiang23 Dose–volume criteria for inverse planning optimisation are shown in Table 1 based on the Quantitative Analyses of Normal Tissue Effects in the Clinic protocol.Reference Bentzen, Constine and Deasy24 For each patient, two treatment plans were created using the PO and PRO, with all parameters of photon beam, patient setup and dose–volume criteria in plan optimisation kept constant. DVHs of the targets and OARs in each plan were determined for calculations of DDI. All treatment plans were proved to be deliverable using the patient-specific QA system of ArcCHECK.Reference Li, Zhang and Jiang25, Reference Neilson, Klein, Barnett and Yartsev26
Dose–volume criteria used in the inverse treatment planning for both the PO and PRO plans

Calculation of DDI
DDI considers the dose coverage, conformity and homogeneity of the PTV, as well as the need to spare OARs and remaining volume at risk (RVR) in the target organ.Reference Alfonso, Herrero and Nunez15 To calculate DDI, only DVHs of the PTV, OARs, RVR and prescription dose at the PTV are required. DDI is expressed as:
 $${\rm{DDI}} = {1 \over 3}(W_{T}I_{T} + W_{O}I_{O} + W_{R}I_{R}),$$
(1)
where WT, WO and WR are weighting factors ranging from 0 to 1, and IT, IO and IR are indexes of the target (PTV), OAR and RVR, respectively. In this study, since IR = 0 as there is no remaining treated prostate volume, Equation (1) can be modified according to the weighting factors of WT and WO as:
 $${\rm{DDI}} = {1 \over 2}({W_T}{I_T} + {W_O}{I_O}),$$
(2)
In Equation (2), IT is defined as:
 $${I_T} = \left( {1 - \left| {1 - \left( {{{\mathop \int \nolimits_0^{{D_M}} {V_T}\left( D \right)dD} \over {{D_p}{\rm{PTV}}}}} \right)\left( {{{{D_m}} \over {{D_M}}}} \right)} \right|} \right),$$
(3)
where Dp is the prescription dose, Dm is the maximum dose received at least 100% of the PTV, DM is the maximum dose in the PTV. VT(D) is the DVH curve of the PTV. It can be seen that IT represents the ratio of the area of DVH of PTV in the plan to the area of DVH of PTV in an ideal plan, with Dp uniformly delivered on the PTV. Dm/DM in Equation (3) accounts for dose homogeneity in the PTV. For an ideal plan of perfect dose coverage of PTV, IT is equal to 1 according to Equation (3).
IO in Equation (2) can be written asReference Alfonso, Herrero and Nunez15:
 $${I_O} = {1 \over N}\sum\nolimits_{i - 1}^N {{W_{{O_i}}}} \left(1 - \left({{\int_0^{{D_{{M_i}}}} {{V_{{O_i}}}} (D)dD} \over {{D_p}OAR{V_i}}}\right)\left({{{D_M}} \over {{D_p}}}\right)\right),$$
(4)
where DM is the maximum dose of the OAR, N is the number of OARs, OARV is the volume of OAR, VO(D) is the DVH curve of the OAR, and DM/Dp is to weight the deviation of the maximum dose of the OAR when the PTV has a prescription dose of Dp. In this study, N was equal to 4, representing the rectum, bladder, left and right femur. Similarly, IR in Equation (1) is expressed as:
 $${I_R} = \left(1 - \left({{\int_0^{{D_M}} {{V_R}(D)dD} } \over {{D_p}{\rm{RVR}}}}\right)\left({{{D_M}} \over {{D_p}}}\right)\right),$$
(5)
where VR(D) is the DVH curve of the RVR. It is seen that for an ideal plan, IO = IR = 1. The weighting factors (WT and WO) in Equation (2) are set to 1, showing that PTV coverage and sparing of OARs are equally important. Using Equations (2–4), DDIs of prostate treatment plans created by the PO and PRO were calculated, based on their corresponding DVHs, using the MATLAB platform (MathWorks Inc. Natick, MA). Although formulas of the DDI and RVR seem overly complex, calculation is easy by inputting a group of DVH curves (targets and OARs) in the form of EXCEL to the MATLAB platform, with an output file turned out almost immediately. For the DDI values, paired Student’s t-tests were carried out for all patients using the OriginPro 9.1 (Academic) software (OriginLab Corp. Northampton, MA) to evaluate the statistically significant differences of IO, IT and DDI values between the PO and PRO treatment plans.
Result and Discussion
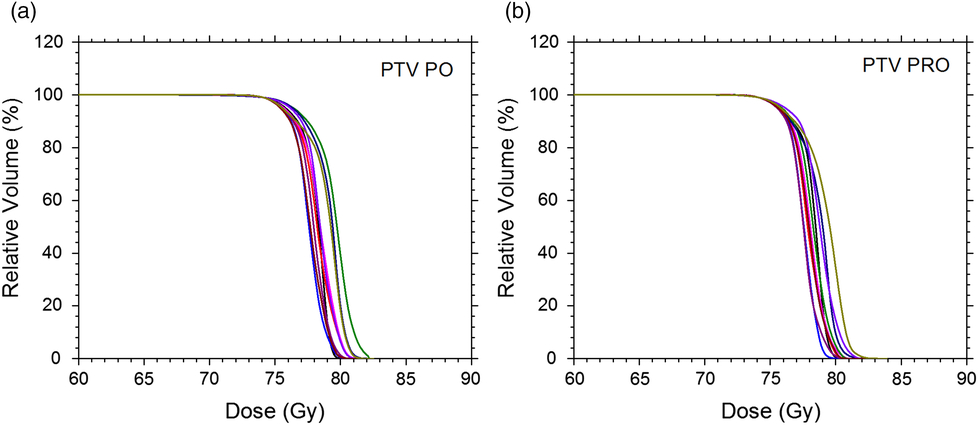
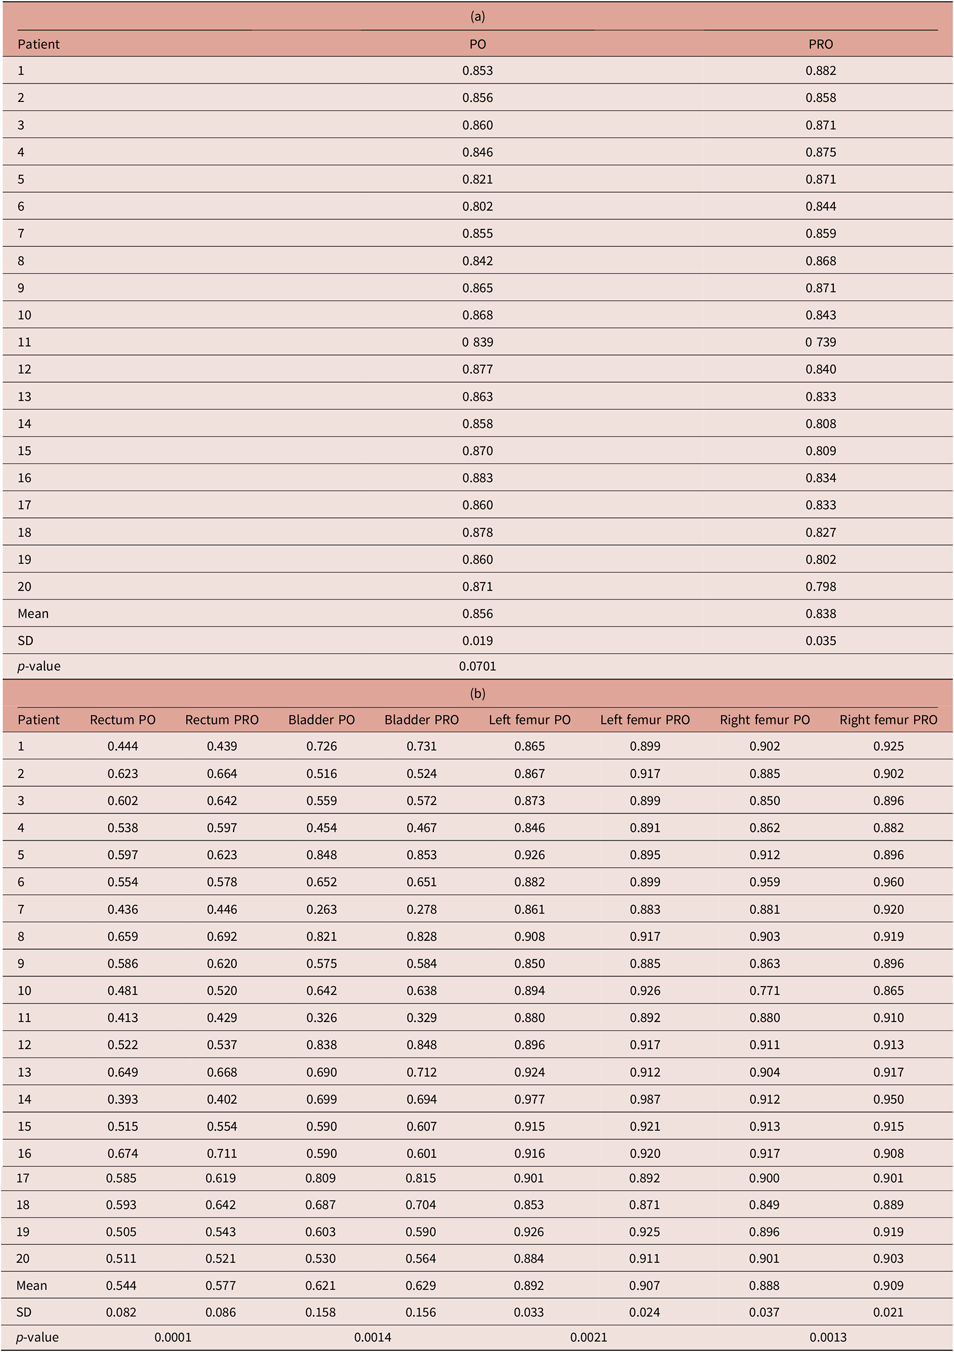
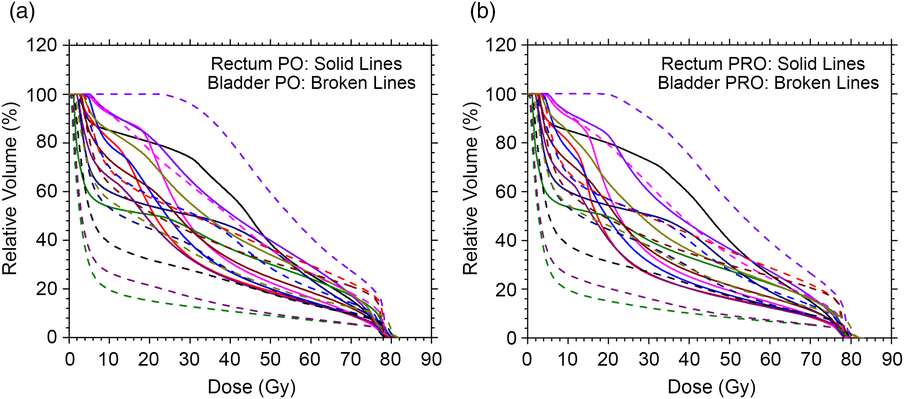
Figures 1(a) and 1(b) show DVHs of the PTV in the prostate VMAT plans created by the PO and PRO, respectively. Parameters of Dm and DM were obtained from Figure 1, and Equation (3) was used to calculate IT as per Dp given as 78 Gy. IT values of the PO and PRO plans were in the ranges of 0·802–0·883 and 0·739–0·882 as shown in Table 2(a), respectively. It is seen that the mean IT value in the PRO plans (0·838) was slightly smaller than that of the PO plans (0·856). In contrast, DVHs of the rectum and bladder in the plans created by the PO and PRO are shown in Figures 2(a) and 2(b). The parameter of DM was determined from each DVH in Figure 2 and used in the calculation of IO according to Equation (4). WOi for all OARs (i.e., i = 1–4) in Equation (4) were set to 0·25. IO values for the rectum in the PO and PRO plans were in the ranges of 0·393–0·674 and 0·402–0·711, respectively (Table 2(b)). Similarly, IO values for the bladder were in the ranges of 0·263–0·848 (PO) and 0·278–0·848 (PRO) calculated by Equation (4). For DVHs of the left and right femur as shown in Figures 3(a) and 3(b), IO values of the left femur were determined in the ranges of 0·846–0·977 (PO) and 0·871–0·987 (PRO), while IO values of the right femur were in the ranges of 0·771–0·959 (PO) and 0·865–0·960 (PRO). It can be seen in Table 2(b) that the mean IO values for all OARs are slightly larger in the PRO plans than the PO.
DVHs of the PTV for 10 prostate VMAT plans created by the (a) PO and (b) PRO.

DVHs of the rectum and bladder for 10 prostate VMAT plans created by the (a) PO and (b) PRO. DVH curves of the rectum and bladder are shown as solid and broken lines, respectively.
DVHs of the left and right femur for 10 prostate VMAT plans created by the (a) PO and (b) PRO. DVH curves of the left femur and right femur are shown as solid and broken lines, respectively.

IT (a) and IO (b) for the target and OARs in the prostate VMAT plans optimised by the PO and PRO methods

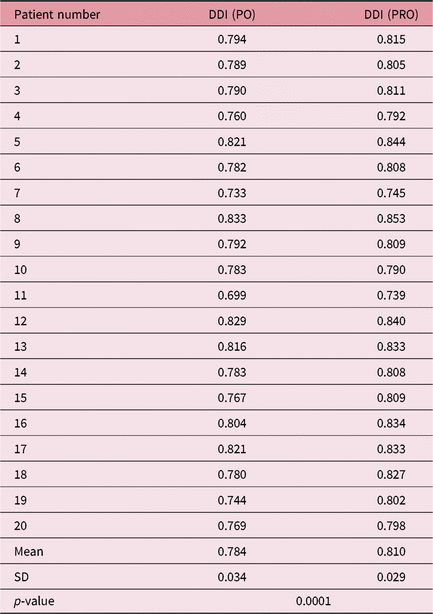
The DDI values considering the target coverage and sparing of OAR in the treatment plan were calculated using Equation (2) based on Table 2. It should be noted that since the whole prostate volume was treated, there is no need to consider IR in Equation (5). However, such a case does not work for, for example, brain, lung or liver radiotherapy, where the tumour may not occupy the whole volume in the treated organ. In Table 3 showing the DDI values of all PO and PRO plans, it can be seen that the DDI values of the PRO plans were larger than the PO plans and were closer to 1. This is because both IT and IO values of the plans created by the PRO were larger than for the PO plans as shown in Tables 2(a) and 2(b). This shows that the quality of treatment plan regarding dose distribution (target coverage and sparing of OAR) was higher when using the PRO compared to the PO. In Table 3, it is seen that the mean DDI value of the PRO plan was only 3·3% larger than the PO plans. This agreed with the results of prostate plans from Binny et al.Reference Binny, Kairn, Lancaster, Trapp and Crowe21 using a different dose prescription of 66 Gy/32 fractions. Results of the paired Student’s t-tests with p < 0·05 in this study showed that there is significant statistical difference between the prostate VMAT plans created by the PO and PRO.
DDIs of 20 prostate VMAT plans optimised by the PO and PRO methods

In Equation (4), it is seen that IO might change with different values of WOi for different OARs, where i is the number of OARs in the plan. In this study, all WO of the rectum, bladder, left and right femur were set to be equal because we considered them as equally important in inverse planning optimisation. However, it is found that if WO of the femur was decreased, the DDI value of the plan decreased correspondingly. If WO of the femur decreased from 0·25 to 0·2, the mean DDI values were found to be decreased from the ranges of 0·770–0·772 (PO) and 0·790–0·792 (PRO) to 0·758–0·762 (PO) and 0·779–0·781 (PRO), when WO of the rectum and bladder were varying in the ranges of 0·1–0·85. When WO of the femur decreased from 0·25 to 0·05, the DDI values in the plans decreased to the ranges of 0·717–0·734 (PO) and 0·740–0·755 (PRO). It is seen that variations of WO of the femur between 0·25 and 0·05 resulted in a variation of DDI values of ∼7%. Although the DDI value depends on WO of OARs, it does not affect our plan evaluation because the same set of WOi (i.e., W rectum = W bladder = W leftfemur = W rightfemur = 0·25) was used to calculate DDI in the PO and PRO plans.
The calculation of DDI is complicated because it involves the determination of IT, IO and IR from DVHs of corresponding volumes of interest. The advantage of DDI is that it reflects the dose distribution of target coverage and sparing of OARs and RVR altogether as one parameter. Compared to other dose–volume parameters such as conformity index, gradient index and homogeneity index,Reference Feuvret, Noël, Mazeron and Bey4–Reference Wagner, Bova, Friedman, Buatti, Bouchet and Meeks6 DDI is more direct and comprehensive in treatment plan evaluation. It is particularly useful in comparing plans with only a single variation such as the dose delivery technique, beam energy and, in this study, the plan optimisation method. With the recent advancement in computer programing and processor speeds,Reference Chow27 DDI can be determined as fast as other plan evaluation parameters using programming platforms such as MATLAB.
Conclusions
DDI was used to evaluate and compare the prostate VMAT plans created by the PO and PRO. The DDI values of both the PO and PRO plans were found to be very similar, with the DDI value of the PRO plan being slightly larger than the PO plan by 3·3%. Considering the advantages of less complicated beam segments and monitor unit per beam using the newer PO plans,Reference Liu, Sintay and Pearman20–Reference Jiang, Wu, Yue, Jia and Zhang22 it may be concluded that the PO is a good successor of the PRO. Moreover, it was proved that DDI is a simple and comprehensive parameter to compare two treatment plans using different techniques such as plan optimisation algorithm. This is because DDI considers not only the dose distribution of the target coverage but also the sparing of all OARs and RVR.
Author ORCIDs
James C. L. Chow 0000-0003-4202-4855
Acknowledgements
All patients and treatment planning data were from the Grand River Regional Cancer Centre of the Grand River Hospital, Kitchener, Canada. Authors would like to thank Fredrick Ng from Ryerson University, Toronto, Canada, for assistance in computer programming using MATLAB.