

1. Introduction
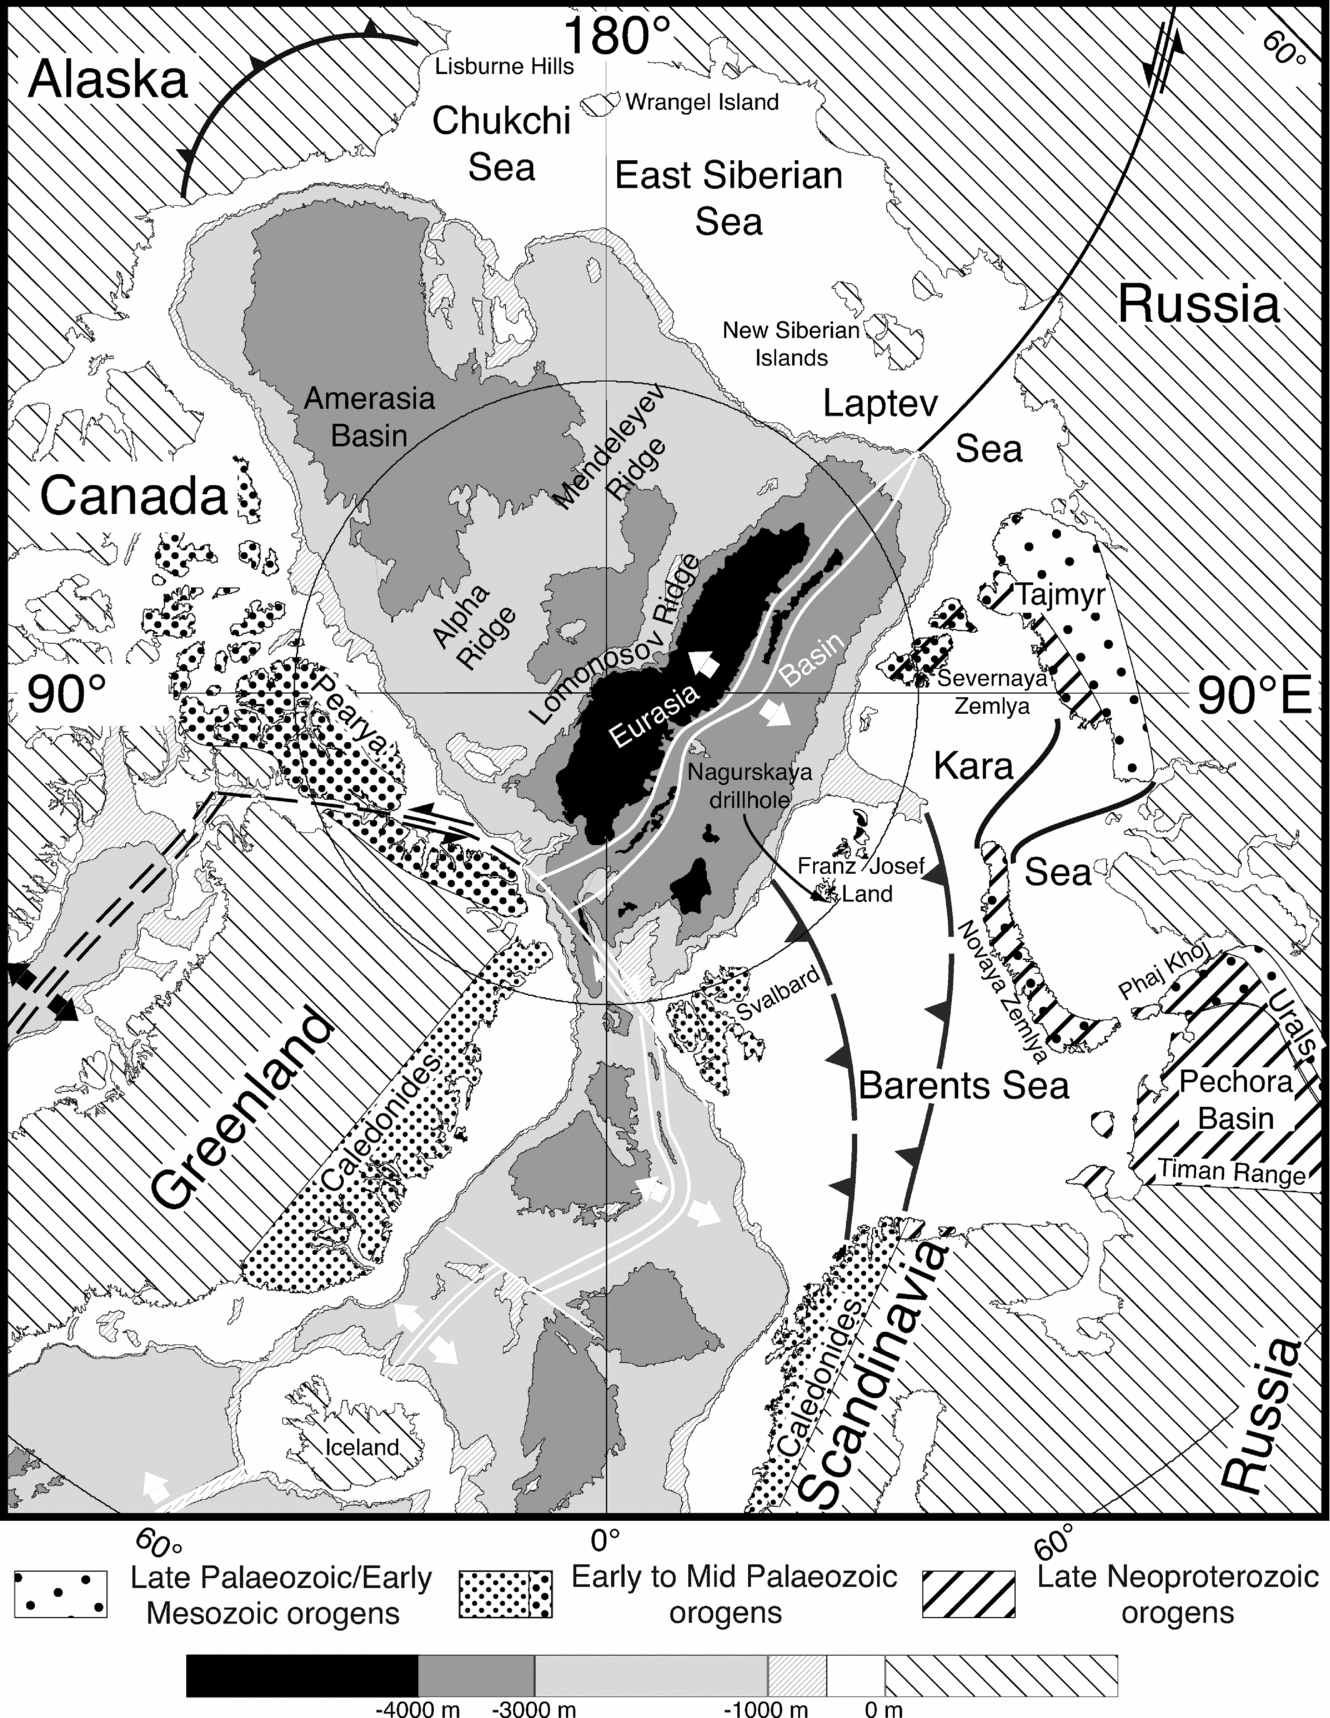
The last 20 years of research on the Palaeozoic orogens of the high Arctic (Fig. 1), from Pearya, via eastern Greenland and Svalbard, to Novaya Zemlya, Tajmyr and Severnaya Zemlya, have provided evidence of Mesoproterozoic, earliest Neoproterozoic, latest Palaeoproterozoic and, very subordinate, Neoarchaean igneous and metamorphic rocks; their signatures are widespread in detrital zircons of the younger Neoproterozoic and Palaeozoic sedimentary successions. This evidence casts doubt on the generally accepted hypothesis that the NE-trending Grenville Orogen of southeastern Canada continues offshore through the North Atlantic continental shelves, via the Rockall Bank and Scotland, to join up with the NW-trending Sveconorwegian Orogen offshore southwestern Scandinavia at c. 64°N; i.e. that this late Mesoproterozoic to earliest Neoproterozoic orogen had no continuation into the Arctic (Falkum & Petersen, Reference Falkum and Petersen1980; Pisarevsky et al. Reference Pisarevsky, Wingate, Powell, Johnson, Evans, Yoshida, Windley and Dasgupta2003; Cawood et al. Reference Cawood, Nemchin, Smith and Loewy2003, Reference Cawood, Nemchin, Strachan, Prave and Krabbendam2007; Pettersson, Pease & Frei, Reference Pettersson, Pease and Frei2009; Johansson, Reference Johansson2009; Kirkland, Daly & Whitehouse, Reference Kirkland, Daly and Whitehouse2007; Kirkland et al. Reference Kirkland, Bingen, Whitehouse, Beyer and Griffin2011).
Polarstereographic map of the Arctic (north of 60°N) with selected tectonic features. Bathymetry from Jakobsson et al. (Reference Jakobsson, Macnab, Mayer, Anderson, Edwards, Hatzky, Schenke and Johnson2008).
Within the Grenville Orogen of Laurentia, along the southern border of the Archaean to Palaeoproterozoic provinces of North America, four compressional phases have been recognized, two pre-Grenvillian (c. 1.25–1.22 Ga Elzevirian and 1.19–1.14 Ga Shawinigan) and two Grenvillian (1.08–1.02 Ga Ottawan and 1.00–0.85 Ga Rigolett), all separated by intervals of extension and orogenic collapse (e.g. Rivers, Reference Rivers1997, Reference Rivers2008).
The Sveconorwegian orogeny has also been subdivided into four major phases by Bingen, Nordgulen & Viola (Reference Bingen, Nordgulen and Viola2008), during which various Mesoproterozoic to latest Palaeoproterozoic terranes (1.66–1.46 Ga igneous rocks) were accreted to the southwestern margin of the Fennoscandian Shield: these are the 1.14–1.08 Ga Arendal, 1.05–0.98 Ga Agder (main phase), 980–970 Ma Falkenberg and 960–900 Ma Dalane (orogen collapse and post-collisional magmatism). The Sveconorwegian Orogen is flanked to the northeast by late Palaeoproterozoic (1.85–1.70 Ga), mostly granitic basement in central Scandinavia and, eventually, in the north, Sveconfennian (Palaeoproterozoic) terranes and Archaean complexes.
Those who have favoured a continuation of the Sveconorwegian Orogen northwards beneath the continental shelves of the Greenland and Norwegian seas into the southern Barents Shelf (e.g. Max, Reference Max1979; Peucat et al. Reference Peucat, Ohta, Gee and Bernard-Griffiths1989; Strachan, Nutman & Friderichsen, Reference Strachan, Nutman and Friderichsen1995; Kirkland, Daly & Whitehouse, Reference Kirkland, Daly and Whitehouse2006) have inferred that this was a segment of the main orogen that projected northeastwards (present coordinates) from the type areas. This paper summarizes the isotope age data (some unpublished) collected on the land areas around the Barents and Kara seas and compares them with evidence from East Greenland and, further south, the Scandinavian Caledonides, and the more distant parts of the Arctic Basin margins. It then discusses alternative hypotheses for the presence of these signatures in the Arctic and concludes that most of the zircons probably derive from the erosion of proximal Grenville–Sveconorwegian basement now preserved within the hinterland of the Timanides and Caledonides.
2. Eurasian high Arctic
2.a. Svalbard
Within the different provinces of the Svalbard Caledonides (Fig. 2; Harland, Reference Harland1997; Gee & Tebenkov, Reference Gee and Pease2004), Precambrian igneous rocks with ages of 2.7 Ga, c. 1.74 Ga, 1.21 Ga, 960 Ma and 660 Ma have been identified. Some of the 960 Ma granites have been shown to be syn-tectonic and accompanied by regional metamorphism. Many sedimentary successions carry zircon signatures similar to these ages, within prominent, often more varied, Mesoproterozoic populations.
Svalbard's Caledonian terranes. Modified from Gee & Teben'kov (Reference Gee and Pease2004).

In northeastern Svalbard, the Caledonian bedrock is subdivided into the Nordaustlandet and West Ny Friesland terranes (Fig. 2). In the former, the siliciclastic metasedimentary Brennevinsfjorden and Helvetesflya groups are intruded by 970–940 Ma syn- to post-tectonic granites (Gee et al. Reference Gee, Johansson, Ohta, Tebenkov, Krasilshikov, Balashov, Larionov, Gannibal and Ryungenen1995; Johansson et al. Reference Johansson, Gee, Larionov, Ohta and Tebenkov2005), characterizing the Nordaustlandet Orogen. They are separated by a major unconformity from overlying calc-alkaline volcanites (also early Tonian in age) and thick sandstone, shale and carbonate successions of the Murchisonfjorden Supergroup. The latter passes up into Vendian tillites (Marinoan; Halverson, Maloof & Hoffman, Reference Halverson, Maloof and Hoffman2004) and Cambro-Ordovician carbonate-dominated formations (Hinlopenstretet Supergroup). Migmatization influences the deepest structural levels on Nordaustlandet (Tebenkov et al. Reference Tebenkov, Sandelin, Gee and Johansson2002) and is at least partly Caledonian in age (440 Ma), followed by late- to post-orogenic (410–420 Ma) granite intrusion. The Brennevinsfjorden and Helvetesflya groups carry detrital zircons (Fig. 3) as young as 1.05 Ga, with the main populations at 1.8–1.6 Ga and 1.4–1.15 Ga and a minor component (c. 2.8–2.7 Ga) in the late Archaean (Larionov in Johansson, Maluski & Gee, Reference Johansson, Maluski and Gee2001).
Examples of detrital zircon age signatures – Svalbard and East Greenland. Diagrams were compiled from publications and own studies. Ages were recalculated from the analytical data and only those with a discordance of 10% or less were taken into account. For 238U–206Pb ages < 800 Ma 238U–206Pb ages are shown; for 238U–206Pb ages > 800 Ma 207Pb–206Pb ages are shown.

Detrital zircon data from the lower groups in the overlying Murchisonfjorden Supergroup (Kosteva & Tebenkov, Reference Kosteva and Tebenkov2011) have zircon populations similar to the metasedimentary rocks in the older basement, but with prominent main populations between 950 and 1150 Ma and, in one case, c. 1.9 Ga. The Murchisonfjorden Supergroup continues westwards into adjacent Ny Friesland (eastern Spitsbergen), where it is referred to as the Lomfjorden Supergroup and is underlain by the siliciclastic Planetfjella Group, also containing Mesoproterozoic zircons as young as 950 Ma (Larionov et al. Reference Larionov, Gee, Tebenkov and Witt-Nilsson1998).
The Neoproterozoic successions of the Nordaustlandet Terrane are thrust over the West Ny Friesland Terrane (Fig. 2; Witt-Nilsson, Gee & Hellman, Reference Witt-Nilsson, Gee and Hellman1998). They are dominated by a major antiformal thrust stack, composing the Atomfjella Complex. The latter is made up of 1.75–1.73 Ga granitic gneisses, which, locally, are hosted by a Neoarchaean quartz monzonite (Hellman, Gee & Witt-Nilsson, Reference Hellman, Gee and Witt-Nilsson2001) and tectonically intercalated with younger quartzite-dominated Mesoproterozoic formations (Hellman et al. Reference Hellman, Gee, Johansson and Witt-Nilsson1997) and intruded by c. 1.4 Ga dolerites. Four thrust sheets have been recognized and the lowest one (Finlandveggen Nappe), comprising siliciclastic and carbonate formations (Smutsbreen Group) and lacking mafic dykes, has yielded zircons dominated by Mesoproterozoic ages, ranging from 1.75 Ga to 1.2 Ga (Gee & Hellman, Reference Gee and Hellman1996).
A major Old Red Sandstone graben (Andreeland–Dicksonland, Fig. 2) separates Svalbard's Northeastern Province from the Northwestern Province (Gee & Hjelle, Reference Gee and Hjelle1966), where thick siliciclastic and carbonate successions (Krossfjorden and related groups) were subject to Caledonian migmatization at lower structural levels (Ohta et al. Reference Ohta, Larionov, Tebenkov, Lepvrier, Maluski, Lange and Hellebrandt2002; Pettersson et al. Reference Pettersson, Pease and Frei2009) and subsequent post-tectonic granite intrusion. The metasedimentary successions are intruded locally by 960 Ma granites (Ohta & Larionov, Reference Ohta and Larionov1998; Pettersson et al. Reference Pettersson, Pease and Frei2009) and have yielded detrital zircons as young as 1015 Ma (Fig. 3), with populations ranging back to c. 1.8 Ga and a few grains from the Neoarchaean (Ohta, Larionov & Tebenkov, Reference Ohta, Larionov and Tebenkov2003; Pettersson, Pease & Frei, Reference Pettersson, Tebenkov, Larionov, Andresen and Pease2009). Thus, the Northwestern Province is similar to the lower structural levels on Nordaustlandet. However, along the western margin of the Andréeland–Dicksonland Graben, on Biscayerhalvøya (Fig. 2), a Caledonian eclogite-bearing assemblage, the Richarddalen Complex (Gromet & Gee, Reference Gromet and Gee1998), is thrust-intercalated with lower grade, relatively high temperature/low pressure (HT/LP) schists. Within the hornblende gneisses, marbles and calcsilicate-bearing psammites of the Richarddalen Complex, granites, augen gneisses and gabbros have yielded c. 960 Ma ages and minor felsic intrusions an age of c. 660 Ma (Peucat et al. Reference Peucat, Ohta, Gee and Bernard-Griffiths1989).
Svalbard's Southwestern Province is located south of Kongsfjorden, within the Cenozoic West Spitsbergen fold-and-thrust belt. In southernmost Wedel Jarlsberg Land (Fig. 2), Mesoproterozoic igneous rocks occur in the Eimfjellet Complex (Group), thrust over metasedimentary formations of the Isbjørnhamna Group. The former contain granites and gabbros that have yielded ages of 1.22–1.2 Ga, and also acid volcanites of similar age (Balashov et al. Reference Balashov, Tebenkov, Ohta, Larionov, Sirotkin, Gannibal and Ryungen1995; Larionov et al. Reference Larionov, Tebenkov, Gee, Czerny and Majka2010). Electron probe microanalyser (EPMA) dating of monazite (Majka et al. Reference Majka, Mazur, Manecki, Czerny and Holm2008) has provided compelling evidence of regional amphibolite-facies metamorphism at c. 640 Ma, as previously indicated by Ar–Ar dating of hornblende and muscovite (Manecki et al. Reference Manecki, Holm, Czerny and Lux1998) and Kr–Ar ages of biotite (Gayer et al. Reference Gayer, Gee, Harland, Miller, Spall, Wallis and Winsnes1966). Populations of 1.0–0.9 Ga zircons were reported from the Neoproterozoic Isbjørnhamna Group, with a small, younger population at c. 700 Ma (Larionov et al. Reference Larionov, Tebenkov, Gee, Czerny and Majka2010). Voluminous populations of 1.2–0.90 Ga detrital monazites were retrieved from the Neoproterozoic Deilegga and Sofiebogen groups (Czerny et al. Reference Czerny, Majka, Gee, Manecki and Manecki2010). In one area, in northeastern Wedel Jarlsberg Land, c. 950 Ma augen gneisses (Czerny et al. Reference Czerny, Majka, Gee, Manecki and Manecki2010; Majka, Reference Majka2011) have recently been reported.
2.b. Franz Josef Land
Information about the pre-Carboniferous basement of Franz Josef Land is based on a single deep drill hole (Nagurskaya, Fig. 1), located on Alexandra Island in the westernmost part of the archipelago (Dibner, Reference Dibner1998). Beneath a Lower Carboniferous unconformity, tightly folded phyllites and turbidites are reported to contain Vendian acritarchs (Ilchenko, 1979 in Dibner, Reference Dibner1998). Two drill core samples of sandstones have yielded dominating Mesoproterozoic zircon populations, with youngest ages of c. 1 Ga and c. 1.35 Ga, respectively. Ar–Ar ages from muscovite, probably of detrital origin, of 1.1 Ga, 700 Ma and 640 Ma have also been reported (Pease, Gee & Lopatin, Reference Pease, Gee and Lopatin2001).
2.c. Novaya Zemlya
On Novaya Zemlya (Fig. 1), W-vergent Permo-Triassic folding and thrusting deforms a Palaeozoic sedimentary succession that was deposited on a Timanide and, perhaps, older basement, that is exposed in several places within the thrust front near the Barents Sea coast. In southern Novaya Zemlya (Korago et al. Reference Korago, Kovaleva, Lopatin, Orgo, Gee and Pease2004), Lower Ordovician shallow marine sandstones and carbonates overlie turbidites of inferred Neoproterozoic (Korago et al. Reference Korago, Kovaleva, Lopatin, Orgo, Gee and Pease2004) and Cambrian age (Pease & Scott, Reference Pease and Scott2009). In northern Novaya Zemlya, a continuous Cambrian and Ordovician succession of deeper water shales and turbidites shallows upwards through the Silurian period into fluvial sandstones and carbonates of Devonian age (Bondarev et al. Reference Bondarev, Ershov, Andreeva and Sobolev1978; Guo, Schekoldin & Scott, Reference Guo, Schekoldin and Scott2010).
The basement igneous and metamorphic rocks in the thrust front of central and northwestern Novaya Zemlya have been described by Korago et al. (Reference Korago, Kovaleva, Lopatin, Orgo, Gee and Pease2004). Kaplan et al. (Reference Kaplan, Copeland, Bro, Korago, Proskurnin, Vinogradov and Vrolijk2001) provided U–Pb zircon ages on granites (Sulimenev and Mitiushev-Kamen) of c. 600 Ma. Previous Pb–Pb ages on zircon populations in metasedimentary host rocks (Sulimenevskaya Series) range from c. 1.6 Ga to 1.4 Ga (Korago & Chukhonin, Reference Korago and Chukhonin1988), suggesting the presence of Mesoproterozoic basement, as was also indicated by inheritance ages in the late Neoproterozoic granites. More recently, Corfu et al. (Reference Corfu, Svensen, Neumann, Nakrem and Planke2010) dated dolerites and mafic sills in previously defined Devonian host rocks to 716–704 Ma and interpreted them to be related to late Neoproterozoic volcanic arc magmatism.
In the southernmost part of the archipelago, provenance analysis was carried out on one sample from below and two samples from above the Ordovician unconformity (Pease & Scott, Reference Pease and Scott2009). The results provide little evidence of late Mesoproterozoic sediment input. Some Mesoproterozoic to Neoarchaean grains are present, but typical Timanian populations (750–550 Ma) are dominant, with the main peaks in the relative probability curve at c. 600 Ma and c. 530 Ma (Fig. 4) and, in addition, in the Ordovician samples, at c. 500 Ma.
Examples of detrital zircon age signatures – Novaya Zemlya and Severnaya Zemlya. Diagrams were compiled from publications and own studies. Ages were recalculated from the analytical data and only those with a discordance of 10% or less were taken into account. For 238U–206Pb ages < 800 Ma 238U–206Pb ages are shown; for 238U–206Pb ages > 800 Ma 207Pb–206Pb ages are shown.

Zircons from about 30 samples from Palaeozoic sandstones of northern Novaya Zemlya were analysed in a more comprehensive investigation. The first data (Korago et al. Reference Korago, Kovaleva, Gee, Stolbov, Sobolev, Gol'tsin and Berejnaya2009) included two samples from the Ordovician and one from the Silurian strata, the latter dominated by a Mesoproterozoic source. Subsequently, 26 samples of early–mid Palaeozoic and also Permian age strata were analysed (Lorenz, Gee & Frei, Reference Lorenz, Gee and Frei2011). Turbidites dominate both the Ordovician and the Cambrian successions (including formations previously thought to be late Neoproterozoic in age); as in southern Novaya Zemlya (Pease & Scott, Reference Pease and Scott2009), they provide unambiguous Timanian signatures (c. 700–550 Ma) and some younger zircons in the upper Cambrian and Ordovician strata. In the Silurian, the input of Mesoproterozoic detrital zircons increases rapidly to more than 80% (Fig. 4), ranging in age from c. 2.1 Ga to 925 Ma, with particularly prominent peaks in the early (1.65–1.50 Ga) and late (1.25–1.0 Ga) Mesoproterozoic periods. These populations persist through the Devonian period (McClelland, pers. comm. 2010), but by Permian time the Mesoproterozoic provenance is minor and Uralian populations (c. 300 Ma) dominate, along with a Timanian signature (Lorenz, Gee & Frei, Reference Lorenz, Gee and Frei2011).
2.d. Urals
The major Permo-Triassic Novaya Zemlya anticlinorium continues southwards through Paj Khoj into the Polar Urals (Fig. 1). Further south, along the foreland fold-and-thrust belt of the Uralide Orogen, major anticlinoria, similar to that on Novaya Zemlya, occur along most of the 2000 km long mountain belt. In the south (Bashkirian Anticlinorium), they are cored by Archaean and Palaeoproterozoic complexes, and further north (Kvarkush Anticlinorium), by younger, particularly Neoproterozoic successions intruded by Timanian granites and gabbros.
In the Lapinskaya Anticlinorium (Fig. 1) of the Cis-Polar Urals (66°N), beneath a major, basal Ordovician unconformity, Neoproterozoic metasediments are intruded by several late Neoproterozoic granites with typical Timanian ages of 600–580 Ma (Gee et al. Reference Gee, Larionov, Belyakova, Pystin, Brekke, Henriksen and Haugdal2007). In the core of this anticlinorium, a paragneiss complex is dominated by Mesoproterozoic detrital zircons reaching back to 1.7 Ga, with the youngest at c. 950 Ma; a few Neoarchaean grains and a strong 600 Ma signature are also present. Metamorphic rims on the zircons in the paragneiss yield Timanian ages.
2.e. Tajmyr Peninsula
The Tajmyr Peninsula (Fig. 1) comprises a basement of accreted Neoproterozoic (Baikalian–Timanian) terranes, unconformably overlain by an upper Vendian to lower Mesozoic succession, folded and thrust southwards during a late Palaeozoic to early Mesozoic orogeny. Three E–W-trending belts have been recognized: northern, central and southern. Within Tajmyr's central belt, an amphibolite-facies (perhaps with eclogites) metasedimentary succession (Bezzubtsev et al. Reference Bezzubtsev, Malitch, Markov and Pogrebitskij1983; Bezzubtsev, Zalyaleyev & Sakovich, Reference Bezzubtsev, Zalyaleyev and Sakovich1986) is intruded by c. 900 Ma granites (Pease, Reference Pease2001) within which a metasedimentary xenolith yielded detrital zircons with ages between 1.74 and 1.0 Ga (also one older grain). Thus, Grenville–Sveconorwegian age crust (Mamont-Shrenk terrane, Fig. 1) is apparently present within the Neoproterozoic accreted complex (Vernikovsky et al. Reference Vernikovsky, Vernikovskaya, Pease, Gee, Gee and Pease2004). The latter incorporates Neoproterozoic island-arc volcanites (Chelyuskin and Stanovoi belts) dated to 750–730 Ma, and the 660 Ma Ust’-Tajmyr ophiolites.
Detrital zircon age analysis of three samples from thick turbidite successions that dominate northern Tajmyr (Pease & Scott, Reference Pease and Scott2009) yielded age populations ranging from 750 Ma to 500 Ma with dominant peaks at c. 550 Ma in two samples and at 516 Ma in one sample. Older ages are virtually absent. These siliciclastic successions were previously thought to be of Neoproterozoic age, as on Novaya Zemlya (see Section 2.c).
2.f. Severnaya Zemlya
The turbidite successions of northern Tajmyr continue northwards into the Severnaya Zemlya archipelago (Fig. 1). On October Revolution Island they pass into mid and upper Cambrian siliciclastic formations, the latter in black shale facies with turbidites. These are unconformably overlain by Lower Ordovician shallow marine siliciclastic formations with volcanites and Mid Ordovician carbonates (with evaporites), giving way in Late Ordovician time to sandstones and limestones, the latter dominating in the Silurian period. This carbonate facies passes transitionally up into Devonian Old Red Sandstones. Major E-vergent folds and thrusts are interpreted to be the result of late Caledonian deformation during Latest Devonian or Earliest Carboniferous times (Lorenz et al. Reference Lorenz, Gee and Simonetti2008).
Late Neoproterozoic to early Palaeozoic, c. 640 Ma and c. 570–540 Ma (dominant), detrital zircon age populations prevail throughout the Cambrian and Ordovician successions (Lorenz, Gee & Simonetti, Reference Lorenz, Gee and Simonetti2008). In contrast to the data from northern Tajmyr, this late Neoproterozoic Timanian signature is accompanied by diverse Meso- and late Palaeoproterozoic ages (Fig. 4). In the Old Red Sandstones, interpreted as molasse in a foreland basin to the Arctic Caledonides (Lorenz et al. Reference Lorenz, Gee and Simonetti2008), Mesoproterozoic to late Palaeoproterozoic ages dominate amongst the concordant zircons, including c. 1.2–1.05 Ga and early Neoproterozoic 0.95–0.85 Ga ages; Timanian and Neoarchaean signatures are also present (Fig. 4).
3. North Atlantic margins
Prior to the opening of the North Atlantic Ocean during Cenozoic time, the Caledonian provinces of the northwestern Eurasian Arctic (summarized in Section 2) connected southwards via the continental shelves into eastern Greenland and western Scandinavia (Gee et al. Reference Gee, Fossen, Henriksen and Higgins2008). A suitable way of constraining the alternative interpretations for the presence, or absence, of Grenville–Sveconorwegian basement in this largely unexposed North Atlantic realm has been to investigate the provenance of sedimentary rocks in the Caledonian nappes that were derived from the Laurentian and Baltoscandian continental margins. Some of these were originally deposited during Neoproterozoic time on basement that was subsequently subducted during the Caledonian orogeny; however, much of this basement probably remains beneath the continental shelves along the ocean margins.
3.a. East and North Greenland
In East Greenland (Fig. 1), Neoproterozoic to mid Palaeozoic successions have been thrust westwards across autochthonous Cambro-Ordovician cover and underlying Palaeoproterozoic to Archaean basement (Henriksen, Reference Henriksen2008; Higgins, Gilotti & Smith, Reference Higgins, Gilotti and Smith2008). Two major thrust complexes have been recognized (Higgins & Leslie, Reference Higgins and Leslie2000). In the lower thrust sheets, Palaeoproterozoic gneisses, metasediments and metavolcanics dominate (Higgins & Leslie, Reference Higgins, Leslie, Higgins, Gilotti and Smith2008). In the overlying allochthons, the Grenvillian signatures are unambiguous, both in terms of late-orogenic syn-tectonic intrusions and detrital zircon signatures in metasedimentary rocks (Fig. 3).
Steiger et al. (Reference Steiger, Hansen, Schuler, Bär and Henriksen1979) reported c. 1.05–0.95 Ga zircon ages (U–Pb) from augen granites in the Scoresby Sund region. The Mesoproterozoic ‘Krummedal supracrustal sequence’ is cut by c. 930 Ma granites and contains detrital Mesoproterozoic zircons as young as c. 1.1–1.0 Ga (Kalsbeek et al. Reference Kalsbeek, Thrane, Nutman and Jepsen2000; Watt & Thrane, Reference Watt and Thrane2001). It is at least locally affected by high-grade metamorphism and anatexis between 950 Ma and 920 Ma (Kalsbeek et al. Reference Kalsbeek, Thrane, Nutman and Jepsen2000). In the Renland area, Leslie & Nutman (Reference Leslie and Nutman2003) identified sediments derived from a late Mesoproterozoic source. They correlated this unit, which is influenced by early Neoproterozoic high-grade metamorphism, with the Krummedal sequence. Strachan, Nutman & Friderichsen (Reference Strachan, Nutman and Friderichsen1995) correlated the Smallefjord Group, located 200 km further north at a similar tectonic level, with the Krummedal sequence and demonstrated c. 980–890 Ma high-grade metamorphism. Detrital zircon provenance studies of the overlying Eleonore Bay Supergroup yielded Neoarchaean to early Neoproterozoic zircons, including a c. 1.2–1.0 Ga age assemblage (Dhuime et al. Reference Dhuime, Bosch, Bruguier, Caby and Pourtales2007).
The Krummedal and Smallefjord successions, occurring in the nappes derived from areas offshore of East Greenland, were apparently sourced from the Grenville–Sveconorwegian Orogen and affected by its youngest tectonothermal episode (Fig. 3). Some authors, before the turn of the last century, interpreted their results in terms of Grenvillian tectonothermal activity and as evidence for a northern arm of the Grenville–Sveconorwegian orogen projecting into the high Arctic (e.g. Strachan, Nutman & Friderichsen, Reference Strachan, Nutman and Friderichsen1995). During the last decade, other interpretations have been preferred. Watt, Kinny & Friderichsen (Reference Watt, Kinny and Friderichsen2000) suggested that the northern continuation of the Grenvillian orogeny, recorded in the Caledonian nappes of eastern Greenland, was related to magmatism and metamorphism in a late-orogenic extensional regime, and that widespread anatexis was only Caledonian in age. Subsequently, it has been shown that late Grenvillian anatexis of this so-called Renlandian episode affected the same rocks as the later Caledonian anatexis (Kalsbeek et al. Reference Kalsbeek, Higgins, Jepsen, Frei, Nutman, Higgins, Gilotti and Smith2008). Recently, Cawood et al. (Reference Cawood, Strachan, Cutts, Kinny, Hand and Pisarevsky2010) presented a new tectonic interpretation that relates the observed early Tonian (c. 950 Ma) and some late Tonian to earliest Cryogenian tectonothermal events, to an ‘external orogen’ along the margin of Laurentia, called the Valhalla orogen. It was inferred to be separate from the Grenville–Sveconorwegian orogen of the type area further south and includes parts of the Shetlands, Scandinavia, Svalbard and East Greenland.
In North Greenland, further evidence for Grenville–Sveconorwegian orogenic activity is present in the Neoproterozoic to (possibly) Cambrian units that unconformably overlie the late Palaeoproterozoic Independence Fjord Group (Kirkland et al. Reference Kirkland, Pease, Whitehouse and Ineson2009). Mesoproterozoic terranes contribute a considerable amount of detritus (c. 1.5–1.3 Ga and c. 1.2–1.0 Ga) to the area. Also cobble-sized granitic clasts with a c. 1.25 Ga metamorphic overprint have been reported.
3.b. Scandinavian Caledonides
The Sveconorwegian Orogen of southwestern Scandinavia has been explored in much detail during the last decade (e.g. Andersen et al. Reference Andersen, Griffin, Jackson, Knudsen and Pearson2004; Bingen et al. Reference Bingen, Davis, Hamilton, Engvik, Stein, Skar and Nordgulen2008; Bingen, Nordgulen & Viola, Reference Bingen, Nordgulen and Viola2008) providing a foundation for interpretation of detrital zircon signatures in the Neoproterozoic and lower–mid Palaeozoic sedimentary successions deposited on this basement and in the Caledonian allochthons emplaced from further to the west.
In the central parts of the Scandinavian mountain belt (Fig. 1), high-grade psammitic and pelitic paragneisses in the Seve nappes, derived from the outer parts of the Baltoscandian margin (Gee, Reference Gee1975; Andréasson, Reference Andréasson1994), have provided evidence of unambiguous 1.7–1.0 Ga Mesoproterozoic source terranes, with main populations at 1.6–1.4 Ga (Claesson, Reference Claesson1982, Reference Claesson1987; Williams & Claesson, Reference Williams and Claesson1987). Ladenberger et al. (Reference Ladenberger, Gee, Claesson and Majka2009) provided complementary detrital zircon data, with populations ranging from 1.7 Ga to 0.9 Ga and a dominating peak in the latest Mesoproterozoic. Recent data from the Seve nappes of northern Jämtland (Kirkland et al. Reference Kirkland, Bingen, Whitehouse, Beyer and Griffin2011) confirm these studies (Fig. 5). Zachrisson, Greiling & Persson (Reference Zachrisson, Greiling and Persson1996) identified 1645 Ma granitic gneisses in the Seve nappes of southern Västerbotten and, further north, in Norrbotten, folded 945 Ma metavolcanites have been described (Albrecht, Reference Albrecht2000). Metadolerites are described in both areas, intruded prior to Caledonian HP metamorphism. In the immediately underlying less-deformed and greenschist-facies metamorphosed Särv nappes (Strömberg, Reference Strömberg1961), which are dominated by fluvial sandstones but including both upper Neoproterozoic carbonates and tillites (Kumpulainen, Reference Kumpulainen1980), recent work (Be'eri-Shlevin et al. Reference Be'eri-Shlevin, Gee, Claesson, Ladenberger, Majka, Kirkland, Robinson and Frei2011) has shown strong bimodal provenance signatures with major populations at 1.7–1.4 Ga and 1.2–0.9 Ga (Fig. 5). Data from the underlying allochthons (Jämtlandian nappes) towards the Caledonian foreland in the central Scandes also yield unambiguous evidence of Sveconorwegian provenance terranes (Dahlqvist et al. Reference Dahlqvist, Gee, Frei and Ladenberger2011).
Examples of detrital zircon age signatures – Scandinavian Caledonides. Diagrams were compiled from published data. Ages were recalculated from the analytical data and only those with a discordance of 10% or less were taken into account. For 238U–206Pb ages < 800 Ma 238U–206Pb ages are shown; for 238U–206Pb ages > 800 Ma 207Pb–206Pb ages are shown.

In the northernmost parts of the Scandes, in Finnmark, the Seve and Särv allochthons pass into the Kalak nappes. Correlation of the different units (cf. Gee et al. Reference Gee, Kumpulainen, Roberts, Stephens and Zachrisson1985; Zachrisson, Reference Zachrisson1986) is based on comparison of the lower dolerite-intruded sandstones of the Kalak nappes with the Särv nappes, and the overlying thrust sheets of higher grade metasedimentary rocks, locally intruded by gabbro and underlain by hartzbergite-dunite (e.g. Halti Igneous Complex), with the Seve. Palinspastic restoration of the Kalak nappes (Gayer et al. Reference Gayer, Rice, Roberts, Townsend and Welbon1987) implies that they originated at least 300 km to the northwest of their present locations, partly in the Timanide domain of Baltica's northern margin (Gee & Pease, Reference Gee and Pease2004). Provenance studies of the Kalak sandstones (Kirkland, Daly & Whitehouse, Reference Kirkland, Daly and Whitehouse2007) resulted in a subdivision of this nappe complex into lower (Sværholt) and upper (Sørøya) parts. Although all units have zircon age signatures that have much in common with the Särv and Seve further south, the dating of granite intrusions (Hårvik and Repvåg) by Kirkland, Daly & Whitehouse (Reference Kirkland, Daly and Whitehouse2006) in the lower nappes (Kolvik and Olderfjord) indicates that at least some of these sedimentary successions were of latest Mesoproterozoic to earliest Neoproterozoic age (pre-980 Ma and post-1030 Ma; i.e. the ages of the granites and the youngest detrital zircons, respectively). In the higher Kalak nappes, a more complex Ediacaran magmatic history has been recorded (e.g. the Seiland alkaline igneous suite; Roberts et al. Reference Roberts, Corfu, Torsvik, Ashval and Ramsay2006), which may be related to NW-trending fracture zones, penetrating the Timanian continental margin during the opening of the Iapetus Ocean (Bergström & Gee, Reference Bergström, Gee, Gee and Sturt1985). Kirkland, Daly & Whitehouse (Reference Kirkland, Daly and Whitehouse2007) proposed that the Kalak nappes were foreign to Baltica and derived from the Laurentian margin, implying the presence of an Iapetus suture beneath the Kalak nappes. This interpretation is incompatible with the tectonostratigraphic correlations referred to above; in this context, it is of interest that Kirkland et al. (Reference Kirkland, Bingen, Whitehouse, Beyer and Griffin2011) present Laurentian-like signatures from a lower tectonic level (autochthonous to parautochthonous; Fig. 5) and commented on the Laurentia and Baltica detrital zircon signatures, ‘There is intrinsically little difference between both continents magmatic heritage in the Mesoproterozoic’.
4. Amerasian Arctic
Today, the Eurasia and Amerasia basins (Fig. 1) separate the terranes along the Arctic margin of eastern Eurasia, western Canada and Arctic Alaska from the areas presented above. Whereas the Cenozoic oceanic crust of the Eurasia Basin is well defined and its history of opening uncontroversial, the Amerasia Basin evolution is less well constrained (e.g. Jackson & Gunnarsson, Reference Jackson and Gunnarsson1990; Embry, Reference Embry2000; Miller et al. Reference Miller, Gehrels, Pease and Sokolov2010; Lebedeva-Ivanova, Gee & Sergeyev, Reference Lebedeva-Ivanova, Gee, Sergeyev, Spencer, Gautier, Stoupakova, Embry and Sørensen2011). A better understanding of the distribution of the Grenville–Sveconorwegian, Timanian and Caledonian crust in the high Arctic will help to resolve some of the problems with the interpretation of the younger tectonics.
4.a. Pearya
Constituting the northernmost part of Ellesmere Island in the Canadian Arctic, Pearya (Fig. 1) is regarded as an exotic terrane accreted to Laurentia during the Ellesmerian (late Caledonian) orogeny (Trettin, Reference Trettin1987, Reference Trettin and Trettin1991 a,b); it shares many aspects of its Precambrian and Palaeozoic history with Svalbard's Southwestern Province (Harland & Wright, Reference Harland and Wright1979; Ohta, Reference Ohta1994; Gee & Tebenkov, Reference Gee, Teben'kov, Gee and Pease2004), in particular a late Mesoproterozoic to earliest Neoproterozoic orogeny (e.g. Trettin, Reference Trettin1987; Trettin, Parrish & Loveridge, Reference Trettin, Parrish and Loveridge1987; Pearya succession I). The Neoproterozoic to Palaeozoic strata have been recently studied by Malone & McClelland (Reference Malone and McClelland2010), providing evidence of Grenville-age provenance. In all studied periods (Neoproterozoic, Ordovician, Silurian and Devonian), these authors report detrital zircon age assemblages in the interval from 1.2 Ga to 0.96 Ga, with the Meso- and Palaeoproterozoic also represented. Late Neoproterozoic (650–570 Ma) and Palaeozoic (500–400 Ma) ages were retrieved from the Palaeozoic samples.
4.b. Northwestern Canada
Recent studies of the Franklinian Basin (Anfinson et al. Reference Anfinson, Leier, Embry and Dewing2011) provide evidence of Mesoproterozoic to late Palaeoproterozoic (2.1–0.95 Ga) zircon populations dominating most of the Devonian, giving way to entirely Caledonian (450–370 Ma) and Timanian (700–550 Ma) signatures in the youngest (Famennian) strata. Likewise, in the Upper Devonian to lower Mississippian siliciclastic formations of northwestern Canada in the McKenzie River delta area (Fig. 1), the Ellesmere clastic wedge (Beranek et al. Reference Beranek, Mortensen, Lane, Allen, Fraser, Hadlari and Zantvoort2010; Lemieux, Hadlari & Simonetti, Reference Lemieux, Hadlari and Simonetti2011) has provided clear evidence of Caledonian (460–430 Ma) and Timanian (680–530 Ma) source terranes, and also of a marked early Mesoproterozoic population (1.6–1.3 Ga). Apparently, as in the case of Pearya, outboard terranes (cf. Crockerland; Embry, Reference Embry, Vorren, Bergsager, Dahl-Stamnes, Holter, Johansen, Lie and Lund1993) to the north were accreted to the Laurentian margin during the Caledonian orogeny. Late Caledonian southwards advance of these allochthons continued during Devonian time within the Ellesmerian fold-and-thrust belt.
4.c. Arctic Alaska
The Lisburne Hills (Fig. 1) are the onshore continuation of the long (>800 km) fold-and-thrust belts of the Wrangel and Herald arches below the Chukchi Sea (Moore et al. Reference Moore, Dumitru, Adams, Witebsky and Harris2002). They are composed of three sequences: ‘Pre-Mississippian rocks’ (siliciclastic rocks with carbonates of Ordovician and Silurian age), the ‘Ellesmerian Sequence’ (marine and non-marine siliciclastic rocks, carbonates and shales of Mississippian to Early Jurassic age) and the ‘Brookian Sequence’ (mainly lithic sandstones and turbidites of Cretaceous age), which were all deformed during Late Cretaceous and early Cenozoic times. Miller et al. (Reference Miller, Gehrels, Pease and Sokolov2010) analysed two samples from the marine to non-marine sandstones of the Lower Carboniferous Kapaloak Formation (Ellesmerian Sequence). Zircon ages range from Archaean (3 Ga) to mid Palaeozoic (c. 450 Ma). Dominating are Palaeo- to Mesoproterozoic assemblages at 1.9 Ga, from 1.8 to 1.6 Ga with a peak at 1.65 Ga, 1.55 to 1.45 Ga, and between 1.3 and 0.95 Ga with a peak at 1.22 Ga. Also, late Neoproterozoic (650–550 Ma) ages are well represented.
4.d. Wrangel Island
On Wrangel Island (Fig. 1), Silurian and younger sedimentary strata unconformably overlie the Neoproterozoic Wrangel Complex (Kos'ko et al. Reference Kos'ko, Cecile, Harrison, Ganelin, Khandoshko and Lopatin1993). The Wrangel Complex is the lowermost exposed unit on the island and consists of more than 2 km of highly deformed felsic to intermediate volcanic rocks, volcaniclastic rocks, phyllites, quartzites and conglomerates and is intruded by dykes and sills of varying composition and granites (Kos'ko et al. Reference Kos'ko, Cecile, Harrison, Ganelin, Khandoshko and Lopatin1993). Cecile et al. (Reference Cecile, Harrison, Kos'ko and Parrish1991) obtained U–Pb dates on tectonized granites of c. 700 Ma, and on an acid subvolcanic porphyry of c. 630 Ma. Siliciclastic rocks and carbonates make up the Silurian to Lower Devonian; sandstones and conglomerates dominate throughout Devonian time and into Early Carboniferous time, where they pass into limestones. The Permian comprises both carbonate and clastic rocks; the Triassic, turbiditic sandstones and slates. Miller et al. (Reference Miller, Gehrels, Pease and Sokolov2010) studied the sediment provenance of the Devonian to Triassic successions. The detrital zircon age spectra from the Palaeozoic samples show clear evidence for a c. 1.3–0.95 Ga provenance area. Of similar importance is a Meso- to Palaeoproterozoic provenance around a c. 1.6 Ga maximum in the relative probability curve. Timanian (c. 700 Ma and 630 Ma) and Caledonian (450 Ma) peaks are also present.
5. Discussion
Outcrops of Mesoproterozoic igneous and metamorphic rocks are few and far between in the Arctic; their rarity has allowed the development of a hypothesis that confines the Grenville–Sveconorwegian Orogen to the type areas in southeastern Canada and southwestern Scandinavia (Fig. 6a), with the Grenville and Sveconorwegian segments, prior to the opening of the Iapetus Ocean, being connected directly beneath the continental shelves of the North Atlantic at c. 64°N (present coordinates). Recent reconstructions of Rodinia (Li et al. Reference Li, Bogdanova, Collins, Davidson, De Waele, Ernst, Fitzsimons, Fuck, Gladkochub, Jacobs, Karlstrom, Lu, Natapov, Pease, Pisarevsky, Thrane and Vernikovsky2008 and map enclosure in that volume) place the northern part of proto-Baltica near Scotland, facing southeastern Greenland. This requires subsequent displacements of the whole of Baltica in relation to Laurentia by thousands of kilometres during the Iapetus Ocean opening and/or Caledonian Orogeny. The hypothesis implies that the occurrence of late (i.e. early Neoproterozoic) Grenvillian–Sveconorwegian basement in the Arctic (for example, on Svalbard) was achieved either by long-distance (up to 4000 km) strike-slip displacement of terranes (e.g. Pettersson, Pease & Frei, Reference Pettersson, Pease and Frei2010), or the presence of the separate ‘external’ early Neoproterozoic Valhalla orogen (Cawood et al. Reference Cawood, Strachan, Cutts, Kinny, Hand and Pisarevsky2010). The ubiquitous evidence of Mesoproterozoic detrital zircon populations characteristic of the type areas of the Grenville–Sveconorwegian Orogen in today's high Arctic were therefore explained by long-distance river transport from ‘southerly’ mountainous sources of the type area. A far simpler hypothesis, based on the evidence summarized in this paper, is that the Grenville–Sveconorwegian Orogen is present within the Caledonian and Timanian hinterland domains beneath the continental shelves of most (if not all) of the North Atlantic and high Arctic (Fig. 6b).
Sketch reconstruction of the late Mesozoic North Atlantic Caledonides with Grenville–Sveconorwegian basement distribution. (a) The interpretation preferred in recent reconstructions of Rodinia (e.g. Li et al. Reference Li, Bogdanova, Collins, Davidson, De Waele, Ernst, Fitzsimons, Fuck, Gladkochub, Jacobs, Karlstrom, Lu, Natapov, Pease, Pisarevsky, Thrane and Vernikovsky2008 and map enclosure in that volume); (b) the interpretation preferred in this paper.

Direct evidence of Mesoproterozoic complexes in the Arctic is found in the Timanian-age fold belt in Tajmyr (e.g. in the Mamont-Shrenk terrane), the Eimfjellet Complex of southwestern Spitsbergen and the basement of the Pearya Terrane in northern Canada. Other potential candidates in Spitsbergen, Novaya Zemlya and the Polar Urals are being investigated, as are allochthonous basement slices in the base of the Caledonian nappes of the Middle and Lower allochthons in Scandinavia. The occurrence of late Grenville-age (early Neoproterozoic) syn-tectonic granites, intruded at c. 960–930 Ma into uppermost Mesoproterozoic to lowermost Neoproterozoic siliciclastic formations, is more widespread, being located in all Caledonian provinces on Svalbard (Nordaustlandet orogeny), eastern Greenland in the highest nappes (Renlandian Orogeny), Scotland and northern Scandinavia (Kalak Nappes). The external orogen hypothesis of Cawood et al. (Reference Cawood, Strachan, Cutts, Kinny, Hand and Pisarevsky2010), referring only to the active margin of Laurentia, was inferred to result from the rotation of Baltica and based on limited palaeomagnetic data. The hypothesis preferred here suggests that these siliciclastic successions (many of them turbidites) were deposited in foreland basins along both margins of the Grenville–Sveconorwegian Orogen and were deformed, metamorphosed and intruded by granites during the final stages of this orogeny. That a similar foreland basin environment existed along the Baltoscandian margin of the Sveconorwegian Orogen is required to accommodate successions of latest Meso- to earliest Neoproterozoic age in the Kalak nappes of northern Norway (Kirkland, Daly & Whitehouse, Reference Kirkland, Daly and Whitehouse2006). These Caledonian allochthons were originally suggested by these authors to have been derived from Laurentia, separated from Baltica by an unidentified suture. However, recent detrital zircon data (Kirkland et al. Reference Kirkland, Bingen, Whitehouse, Beyer and Griffin2011) and evidence of southerly provenance (Roberts, Reference Roberts2007) favour their location along the Baltoscandian margin.
Based on research on Svalbard in the 1950–60s, Harland (Reference Harland1971) proposed that the different Caledonian provinces in this northwesternmost part of the Barents Shelf were derived from E and NE Greenland and juxtaposed by sinistral strike-slip faulting. On Spitsbergen, major high-angle faults separating ‘terranes’ and defining the Old Red Sandstone horst and graben system were inferred to involve large transcurrent displacements (Harland & Wright, Reference Harland and Wright1979). N–S axial extension within some of the Caledonian metamorphic complexes of western Ny Friesland (Harland, Reference Harland1958; Witt-Nilsson, Gee & Hellman, Reference Witt-Nilsson, Gee and Hellman1998) and Biscayerhalvøya (Gee, Reference Gee1972; Friend et al. Reference Friend, Harland, Rogers, Snape and Thornley1997) was taken to support the terrane assembly hypothesis, but the character of these fault zones is not unambiguous, with evidence of both Silurian transcurrent movement and mainly vertical displacements (normal and reverse) during Devonian deposition. Nevertheless, evidence of sinistral displacements in Scotland, eastern Greenland and Scandinavia have persuaded some authors (Soper et al. Reference Soper, Strachan, Holdsworth, Gayer and Greiling1992; Streule et al. Reference Streule, Strachan, Searle, Law, Law, Butler, Holdsworth, Krabbendam and Strachan2010) that transpression dominated the Caledonian orogeny. An alternative hypothesis (Gee & Page, Reference Gee and Page1994), preferred here, is that the transcurrent movements were subordinate and related to syn- to late-orogenic axial extrusion (tectonic escape), comparable to that described from Tibet (Molnar & Tapponnier, Reference Molnar and Tapponnier1977).
Although much of the detrital zircon data from the high Arctic is found in turbidites and other deeper water sediments and could be far-transported, some of the occurrences provide compelling evidence of deposition proximal to Grenville–Sveconorwegian basement. In northern Novaya Zemlya, the facies change from lower Palaeozoic turbidites to shallower marine and partly fluvial environments in mid Palaeozoic time (Fig. 4), inferred previously to be related to the proximity of the Caledonian (Scandian) deformation front (Gee, Bogolepova & Lorenz, Reference Gee, Bogolepova, Lorenz, Gee and Stephenson2006), is shown here to be accompanied by spectacular changes from characteristic Timanian to Grenville–Sveconorwegian detrital zircon age signatures. That these zircon populations should have been transported over 2000 km across the Asgaard Sea of Cawood et al. (Reference Cawood, Strachan, Cutts, Kinny, Hand and Pisarevsky2010), or from the Sveconorwegian Orogen of southwestern Scandinavia along the Baltoscandian margin and across the Timanide Orogen, to be recycled into fluvial sandstones by Caledonian tectonism, is no simple scenario. Likewise, all the detrital zircon data from the Neoproterozoic shallow marine to fluvial feldspathic sandstone successions in the long-transported (over 200 km) thrust sheets of the Scandinavian and East Greenland Caledonides favour the presence of Sveconorwegian and Grenvillian source rocks in the Caledonian and Timanian hinterlands of the Arctic.
Of importance for this discussion about the distribution of the Grenville–Sveconorwegian Orogen in the high Arctic is the evidence of a late Neoproterozoic (Torellian) orogeny in southwestern Spitsbergen. Amphibolite-facies metamorphism at c. 640 Ma (Majka et al. Reference Majka, Mazur, Manecki, Czerny and Holm2008) and thrusting of the 1.2 Ga Eimfjellet igneous suite onto the Cryogenian Isbjørnhamna turbidites and carbonates has been demonstrated (Larionov et al. Reference Larionov, Tebenkov, Gee, Czerny and Majka2010), along with well-documented evidence of a major unconformity separating lower from upper Neoproterozoic successions (Birkenmajer, Reference Birkenmajer1975; Bjørnerud, Reference Bjørnerud1990). This evidence suggests that the Timanian orogenic belt, prior to the Caledonian orogeny, may have had a continuation from the northern margin of the East European Craton (Pechora Basin and Timan Range) across the Barents Shelf to southwestern Spitsbergen and, possibly, to northern Laurentia (Pearya).
The question naturally arises as to why these Mesoproterozoic parts of the Grenville–Sveconorwegian Orogen that are inferred to exist in the Caledonian and Timanian hinterland (Fig. 6b) are mostly hidden beneath the younger cover. Opening of the Iapetus Ocean approximately along the axis of the Grenville–Sveconorwegian Orogen is the explanation preferred here. Post-orogenic collapse of the Grenville–Sveconorwegian Orogen in early Neoproterozoic time was followed by the development of sag and rift basins, and thinning of the crust continued until the opening of the Iapetus Ocean in Ediacaran and Cambrian times. Subsequent ocean closure and Caledonian collision of Baltica and Laurentia resulted in the Scandian Orogeny and many hundreds of kilometres of underthrusting of the latter by the former (Gee, Reference Gee1978). Most of the Baltoscandian margin crust that underthrust Laurentia would have been the collapsed, extended Sveconorwegian complexes, previously composing the basement to the Neoproterozoic basins.
6. Summary and conclusions
Detrital zircons of late Mesoproterozoic and earliest Neoproterozoic age (c. 1.2–0.95 Ga) are abundant in the younger Neoproterozoic and some of the Palaeozoic successions of the high Arctic, in sandstones deposited in deep and shallow marine and even in fluvial environments. Likewise, detrital zircons of mid Mesoproterozoic to latest Palaeoproterozoic age are also present and apparently derived from older terranes involved in the Grenville–Sveconorwegian Orogeny.
Both the Grenvillian and Sveconorwegian orogens in the type areas include a final phase of deformation, metamorphism and granite intrusion in earliest Neoproterozoic time (c. 970–930 Ma). This episode is well represented in the Arctic, particularly along the Laurentian margin (in eastern Greenland and on Svalbard), but also influencing the Baltoscandian margin (in Finnmark).
Older Grenville–Sveconorwegian components (Mesoproterozoic) of the type areas, exposed towards the hinterland of these orogens, have been identified only in Tajmyr (within the Baikalide–Timanide accreted terranes), on Svalbard (in the Southwestern Province) and on Pearya. Other possible Mesoproterozoic terranes (for example, on Novaya Zemlya and elsewhere on Svalbard) are being investigated. The paucity of basement of this age within the younger orogens is inferred here to be related to the lack of exposure of the basement beneath the continental shelves of the North Atlantic Ocean and the Barents and Kara seas.
The Caledonian orogeny resulted from the more or less orthogonal collision of Baltica and Laurentia with many hundreds of kilometres of horizontal shortening. Transpression, with dominantly sinistral strike-slip displacements, was significant only in the hinterland of this orogen and related to late-orogenic axial extension and tectonic escape. Thus, the interpretation preferred here, that the Grenville–Sveconorwegian Orogen continues northwards (present coordinates) from type areas to the edge of the Eurasian shelf, implies that the opening of the Iapetus Ocean occurred approximately along the axis of the collapsed and extended Grenville–Sveconorwegian Orogen. Tectonic inheritance not only controlled the opening of the North Atlantic Ocean (van Waterschoot van der Gracht, Reference van Waterschoot van der Gracht and van Waterschoot van der Gracht1928; Wilson, Reference Wilson1966), but also the opening of Iapetus.
Acknowledgements
This paper is based on published literature and the last two decades of high Arctic exploration that we have carried out on Svalbard, Novaya Zemlya, Tajmyr and Severnaya Zemlya, made possible by logistic support from the Swedish Polar Research Secretariat. The manuscript has benefited substantially from reviews by Robert Scott and an anonymous reviewer, and by advice from the editor, Mark Allen. Thanks are also due to many other colleagues from different countries, with whom we have enjoyed discussions of high Arctic geology, a collaboration which has been supported by the Swedish Institute.



