Callous–unemotional behaviors (CU) are characterized by a lack of guilt, empathy, and affect and are predictive of later psychopathy and conduct disorder, with the presence of CU representing a more severe, stable, and aggressive pattern of behaviors (Edens, Campbell, & Weir, Reference Edens, Campbell and Weir2007; Frick, Ray, Thornton, & Kahn, Reference Frick, Ray, Thornton and Kahn2014). Thus, CU is diagnostically informative when assessing psychopathology. The utility of CU in assessing diagnostic severity of psychopathology and behavior problems is made clear by its addition as a subtype for conduct disorder in the DSM-5 (American Psychiatric Association, 2013).
CU is often discussed in the context of clinical samples with psychopathy and conduct disorder in adolescence, yet elevated CU is also associated with impairment in childhood in nonclinical samples. For example, in a community sample in middle childhood through early adolescence, conduct problems were more strongly related to proactive aggression in children with high CU (Thornton, Frick, Crapanzano, & Terranova, 2012). Similarly, individuals with higher CU bully more than others, above and beyond differences in bullying accounted for by conduct problems (e.g., Viding, Simmonds, Petrides, & Frederickson, Reference Viding, Simmonds, Petrides and Frederickson2009). It is thus not surprising that children with higher CU often have low prosociality and poor peer relationships (for a review on the importance of CU, see Viding & McCrory, Reference Viding and McCrory2012b). In addition, in community childhood samples, greater levels of CU in childhood are related to attention-deficit/hyperactivity disorder (ADHD; e.g., Willoughby, Mills-Koonce, Gottfredson, & Wagner, Reference Willoughby, Mills-Koonce, Gottfredson and Wagner2014) and conduct problems (e.g., Viding, Frick, & Plomin, Reference Viding, Frick and Plomin2007). Thus, there are clear meaningful individual differences in CU in childhood and beyond, even in nonclinical community samples where CU is assessed on a continuum. Consequently, CU in childhood is useful not only as a risk factor for later severe psychopathology but also as a set of behaviors associated with social and behavioral maladjustment in childhood more generally.
Although the relevance of investigating CU in both clinical and nonclinical samples has been established, much remains to be known. Genetically informed research allowing for a better understanding of the mechanisms underlying individual differences in CU can provide critical information on why children differ in CU. One such way to explore these underlying mechanisms is by using a twin design, which can provide estimates of the extent to which variation in the population is due to genetic, shared environmental (experiences common to family members), and nonshared environmental (experiences unique to individuals within a family, and measurement error) influences on CU. Thus far, this behavioral genetic approach has been applied to the exploration of CU in community samples of twins as young as 7 years and as old as early adulthood, and consistently finds genetic and nonshared environmental contributions to variation in CU, with no shared environmental effects (see Viding & McCrory, Reference Viding and McCrory2012a, for an overview). Genetic influences account for approximately 40%–78% of the variation, with the nonshared environment explaining the remaining variance (Viding & McCrory, Reference Viding and McCrory2012a). Similar estimates are found when exploring genetic effects at the extreme (i.e., top 10% of the sample; Viding, Blair, Moffitt, & Plomin, Reference Viding, Blair, Moffitt and Plomin2005). These high heritability estimates are seen for CU both with and without other behavior problems, such as antisocial behavior (Humayun, Kahn, Frick, & Viding, Reference Humayun, Kahn, Frick and Viding2014; Larsson, Viding, & Plomin, Reference Larsson, Viding and Plomin2008).
From a developmental perspective, CU is moderately stable across age with phenotypic age to age correlations in the range of 0.4 to 0.6 (Frick et al., Reference Frick, Ray, Thornton and Kahn2014). These moderate correlations suggest that while CU is to some extent stable across age, there is also substantial change from one age to the next. At question then, is what factors explain continuity and change in CU? Only two longitudinal twin studies have examined genetic and environmental sources of change and stability in CU, and focus on middle childhood and early adulthood. These studies find that from 7 to 12 years of age, and from 17 to 24 years of age, genetic factors contribute to both stability and change, whereas nonshared environmental factors influence only change across age (Blonigen, Hicks, Krueger, Parick, & Iacono, Reference Blonigen, Hicks, Krueger, Patrick and Iacono2006; Fontaine, Rijsdijk, McCrory, & Viding, Reference Fontaine, Rijsdijk, McCrory and Viding2010). Nothing is known, however, about the genetic and environmental sources of variance in individual differences in CU in early childhood. This is an important developmental question as genetic and environmental influences on individual differences are dynamic and can change across age (Plomin, DeFries, Knopik, & Neiderhiser, Reference Plomin, DeFries, Knopik and Neiderhiser2013). Consequently, the factors that influence CU in early childhood may differ from those that operate at later ages.
The study of genetic and environmental influences on CU in very young children is particularly relevant as early childhood is a period that may be developmentally significant for several reasons. For example, characteristics central to the development of CU, such as empathy and guilt, first appear at approximately 2 years of age (Kochanska, Gross, Lin, & Nichols, Reference Kochanska, Gross, Lin and Nichols2002; Young, Fox, & Zahn-Waxler, Reference Young, Fox and Zahn-Waxler1999), and CU is proposed as the normative development of these characteristics gone awry (Frick & Viding, Reference Frick and Viding2009). CU has also been related to aggression in high-risk preschool samples (Ezpeleta, Osa, Granero, Penelo, & Domenech, Reference Ezpeleta, Osa, Granero, Penelo and Domènech2013; Kimonis et al., Reference Kimonis, Frick, Boris, Smyke, Cornell, Farrell and Zeanah2006), and elevated CU in early childhood predicts worse antisocial behavior over time (Frick et al., Reference Frick, Ray, Thornton and Kahn2014). Thus, investigating CU as a continuum in early childhood can inform on individual differences in these behaviors as they are first coming online and may be more malleable to change. The responsiveness of very young children to intervention (Olds, Robinson, Song, Little, & Hill, Reference Olds, Robinson, Song, Little and Hill2005) makes this developmental period a promising avenue for research on CU and later psychopathology.
The assessment of CU in early childhood was previously limited because there were few measures available. The use of CU-specific measures was rare in young children, and no general assessment of early child behavior had included CU scales for the investigation of these behaviors. More recently, a valid and reliable CU scale has been created using the Child Behavior Checklist 1.5–5 (CBCL 1.5–5; Achenbach & Rescorla, Reference Achenbach and Rescorla2000; Willoughby et al., Reference Willoughby, Mills-Koonce, Gottfredson and Wagner2014; Willoughby, Waschbusch, Moore, & Propper, Reference Willoughby, Waschbusch, Moore and Propper2011), making measurement of CU in early childhood more feasible. A distinct CU factor has been shown to emerge from factor analyses of CBCL 1.5–5 items assessing problem behaviors related to ADHD, oppositional defiant disorder (ODD), and CU in children at 2 (Waller, Shaw, et al., Reference Waller, Gardner, Shaw, Dishion, Wilson and Hyde2015) and 3 years of age (Willoughby et al., Reference Willoughby, Waschbusch, Moore and Propper2011, Reference Willoughby, Mills-Koonce, Gottfredson and Wagner2014). This measure of early CU has been found to show significant variability in community samples, and this variability is predictive of other behavioral outcomes such as ADHD and ODD (Waller, Hyde, Grabell, Alves, & Olson, Reference Waller, Hyde, Grabell, Alves and Olson2015; Willoughby et al., Reference Willoughby, Waschbusch, Moore and Propper2011, Reference Willoughby, Mills-Koonce, Gottfredson and Wagner2014) as has been found in older childhood using more established measures. More important, with respect to validity, the CBCL 1.5–5 CU measure has been shown to be stable across early childhood in community samples (Willoughby et al., Reference Willoughby, Waschbusch, Moore and Propper2011), and high CU at 2 years is predictive of more teacher-reported externalizing behavior problems at age 7 (Waller, Shaw, et al., Reference Waller, Gardner, Shaw, Dishion, Wilson and Hyde2015). Thus, it is possible to assess CU in early childhood, and there are meaningful individual differences in early CU that are predictive of later outcomes.
The present study fills an important gap in the literature by exploring genetic and environmental sources of variability in CU in early childhood. In addition to exploring genetic and environmental variances at each age, we also examine genetic and environmental contributions to stability and change across ages 2 and 3, a time when the components of CU are first coming online and can inform on factors that influence the development of early CU. Analyses of genetic and environmental contributions to phenotypic stability and change permit the estimation of the extent to which genetic effects on a trait at one age overlap with genetic effects at another age (i.e., the genetic correlation) and, further, whether new genetic influences on the trait emerge across time. Such analyses also inform about environmental sources of individual continuity and change and can therefore provide important information about developmental processes (Saudino, Reference Saudino2012).
Based on previous research in older children and adolescence, we predicted genetic and nonshared environmental influences on individual differences in CU in toddlerhood. However, given that individual differences in other behavior problems in early childhood (e.g., ADHD, externalizing, and internalizing problems) have been shown to be influenced by the shared environment (Bartels et al., Reference Bartels, Vanden Oord, Hudziak, Rietveld, van Beijsterveldt and Boomsma2004; Saudino, Carter, Purper-Ouakil, & Gorwood, Reference Saudino, Carter, Purper-Ouakil and Gorwood2008; Schmitz, Cherny, Fulker, & Mrazek, Reference Schmitz, Cherny, Fulker and Mrazek1994), we also expected family-wide environments that are common to siblings may also influence CU. Finally, we anticipated genetic influences on stability in CU across age, and environmental influences on change from age 2 to 3 years.
Methods
Participants
Participants were from the Boston University Twin Project. Twins were assessed within approximately 2 weeks of their second and third birthdays. Three hundred and fourteen same-sex twin pairs (145 monozygotic [MZ], 169 dizygotic [DZ]) participated in age 2 assessments. Of these, 304 (141 MZ, 163 DZ) were reassessed at age 3. Ethnicity was generally representative of the Massachusetts population (85.4% Caucasian, 3.2% Black, 2% Asian, 7.3% mixed, 2.2% other). Socioeconomic status according to the Hollingshead (Reference Hollingshead1975) Four-Factor Index ranged from low to upper middle class (range = 20.5–66, M = 50.9, SD = 14.1). Zygosity was determined via DNA analyses using DNA obtained from cheek swab samples. In the cases where DNA was not available (n = 3), zygosity was determined using parents’ responses on physical similarity questionnaires, which have been shown to be more than 95% accurate when compared with DNA markers (Price et al., Reference Price, Freeman, Craig, Petrill, Ebersole and Plomin2000).
Assessment of CU behaviors
Primary caregivers (94% mothers) completed the CBCL 1.5–5 for each twin at both ages. Following Willoughby et al. (Reference Willoughby, Waschbusch, Moore and Propper2011), a five-item screening measure from the CBCL 1.5–5 was used to assess CU behaviors for each twin. Items included “doesn't seem to feel guilty after misbehaving,” “punishment doesn't change behavior,” “seems unresponsive to affection,” “shows little affection toward people,” and “shows too little fear of getting hurt.” Each item was rated as 0 (not true), 1 (sometimes true), or 2 (always true). Possible scores range from 0 to 10, with our nonclinical sample ranging from 0 to 7. This measure has been shown to be valid and reliable in prior research. With regard to validity, as indicated earlier, the CBCL 1.5–5 measure of early childhood CU shows a pattern of intercorrelations consistent with the literature (i.e., CU correlates significantly with ADHD and ODD; Willoughby et al., Reference Willoughby, Waschbusch, Moore and Propper2011). Nonetheless, factor analyses indicate that CU emerges as a distinct construct in 2- and 3-year-olds, demonstrating that parents are able to discriminate between CU and other behavior problems at a young age (Waller, Shaw, et al., Reference Waller, Gardner, Shaw, Dishion, Wilson and Hyde2015; Willoughby et al., Reference Willoughby, Waschbusch, Moore and Propper2011, Reference Willoughby, Mills-Koonce, Gottfredson and Wagner2014). We replicated these findings. Confirmatory factor analyses of the 17 items comprising the CU, ADHD, and ODD scales were conducted separately at ages 2 and 3 using Mplus Version 7 (Muthén & Muthén, Reference Muthén and Muthén1998–2012). At both ages, a three-factor model (CU, ADHD, ODD) provided the best fit to the data (see online-only supplementary Table S.1, Table S.2, Figure S.1, and Figure S.2 for model fit statistics and factor loadings at each age). To further examine the factor structure of CU in early childhood, longitudinal confirmatory factor analyses to explore factor invariance at ages 2 and 3 were conducted. A two-factor model (CU at age 2 and CU at age 3) allowing the factors to correlate across age provided a reasonable fit to the data (root mean square error of approximation = 0.081, comparative fit index = 0.926); and using the DIFFTEST procedure in Mplus, factor loadings could be equated across age without a significant detriment in fit (Δχ2 = 5.114, df = 4, p = .276; root mean square error of approximation = 0.072, comparative fit index = 0.935, weighted root mean square residual = 1.287).
In terms of reliability, prior research has found that the internal consistency for the CBCL 1.5–5 early childhood CU measure is typically moderate (α range = 0.55–0.65), but is consistent with measures of CU in middle childhood that tend to have lower internal consistency in general (Willougby et al., 2014). In the present sample internal consistency, assessed by the Cronbach α, was consistent with previous research (age 2 α = 0.55; age 3 α = 0.61; for a comparison with a similar measure at both ages, see Waller et al., Reference Waller, Gardner, Viding, Shaw, Dishion, Wilson and Hyde2014).
Data transformations
As expected in our normative sample, CU scores were positively skewed, and were log-transformed to create a more normal distribution. Because twin covariances can be inflated by variance due to sex, all scores used in the behavior genetic analyses were residualized for sex effects (McGue & Bouchard, Reference McGue and Bouchard1984).
Correlational analyses
The twin method involves comparing genetically identical (MZ) twins with fraternal (DZ) twins who share approximately 50% of their segregating genes. Genetic influences are implied when co-twin similarity covaries with the degree of genetic relatedness. If heredity affects a trait, the twofold greater genetic similarity of MZ twins is expected to make them more similar than DZ twins. Intraclass correlations typically serve as indices of co-twin similarity. A MZ correlation that is greater than the DZ correlation suggests genetic influence on the phenotype. DZ correlations that exceed one-half the MZ correlation suggest the presence of shared environmental influences. Differences within pairs of MZ twins (i.e., the extent to which the MZ intraclass correlation is less than 1.0) are due to nonshared environmental influences and measurement error.
To evaluate genetic and environmental sources of covariance in CU across age, cross-twin cross-age correlations were calculated. The cross-twin cross-age correlation involves correlating Twin A's CU score at age 2 with Twin B's CU score at age 3 and vice versa. Genetic contributions to the age-to-age covariance (i.e., genetic stability) are implied when the MZ cross-twin correlation is greater than the DZ cross-twin correlation.
Model-fitting analyses
Although correlations can be used to indicate the presence of genetic and environmental effects, longitudinal bivariate Cholesky models were used to estimate the magnitude of genetic and environmental contributions to variances in CU at each age and covariances across age and their 95% confidence intervals (see Neale & Cardon, Reference Neale and Cardon1992; Saudino, Reference Saudino2012, for descriptions of this model). Models were fit to raw data using a maximum likelihood pedigree approach implemented in Mx structural equation modeling software (Neale, Boker, Xie, & Maes, Reference Neale, Boker, Xie and Maes2006). This approach allows the inclusion of participants with incomplete data.
The longitudinal bivariate model partitions the phenotypic variance of CU at each age into genetic, shared, and nonshared environmental components. Moreover, at age 3 the model estimates the genetic and environmental effects persisting from CU at age 2 (i.e., stability effects) and those specific to age 3 (i.e., change). Thus under this model, “change” represents variances in CU that are independent of variances at age 2. This model allows the estimation of genetic, shared environmental, and nonshared environmental correlations between CU phenotypes across age. The genetic correlation (r g) indicates the extent to which genetic effects on CU at age 2 correlate with genetic effects on CU at age 3, independent of the heritability of each measure. The genetic factors that influence two measures (or one measure across time) can covary perfectly even if the genetic factors on each measure contribute only slightly to the phenotypic variance. Thus, r g can be 1.0 even when the heritability of each measure is modest. Conversely, two measures may be substantially heritable, but the genetic correlation would be zero if the genetic effects on the two measures do not overlap. Similar logic applies to r c and r e.
The overall fit of a model can be assessed by calculating twice the difference between the negative –2 log likelihood of the model and that of a saturated model (i.e., a model in which the variance/covariance structure is not estimated and all variances and covariances for MZ and DZ twins are estimated). The difference in negative –2 log likelihood is asymptotically distributed as χ2 with degrees of freedom equal to the difference in the number of parameters in the full model and that in the saturated model. In addition to the full model estimating all genetic and environmental sources of variance and covariance, a reduced model dropping all nonsignificant paths in the full model was fit to the data. The fit of this more parsimonious reduced model was compared to that of the full model.
Results
Descriptive statistics
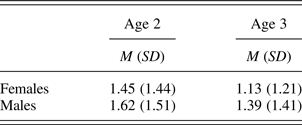
Table 1 lists the means and standard deviations by age and gender. Given that we are using a nonclinical sample, means were low, as expected. This is consistent with the literature using the CBCL 1.5–5 CU scale in early childhood in community and high-risk samples, where means ranged from 0.29 to 1.8 and meaningful individual differences were reported (Waller, Hyde, et al., Reference Waller, Shaw, Neiderhiser, Ganiban, Natsuaki, Reiss and Hyde2015; Willoughby et al., Reference Willoughby, Waschbusch, Moore and Propper2011, Reference Willoughby, Mills-Koonce, Gottfredson and Wagner2014). Mean differences were evaluated using generalized estimating equations implemented in the SAS GENMOD procedure to account for dependence in the data because our sample comprised twin pairs. General estimating questions are an extension of the standard generalized linear models that allow modeling of correlated data (Liang & Zeger, Reference Liang and Zeger1986). CU significantly declined across age (F = 5.15, df = 304, p = .02). The gender effect was nonsignificant (F = 1.37, df = 312, p = .24); however, means were in a direction consistent with the literature with males being higher in CU. The interaction between gender and age was not significant (F = 0.74, df = 305, p = .39).
Callous–unemotional descriptive statistics
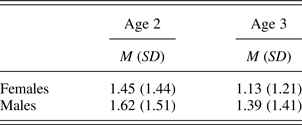
Note: Means (standard deviations) are provided for the nontransformed scores.
Phenotypic and twin correlations
CU was moderately stable across age (r = .45, p < .0001). MZ intraclass and cross correlations (Table 2) exceeded those for DZ twins, suggesting genetic influences on CU at each age and on the continuity across age.
Twin intraclass and cross-age correlations (95% confidence intervals)
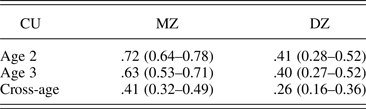
Note: CU, Callous–unemotional; MZ, monozygotic; DZ, dizygotic.
Model-fitting analyses
As seen in Table 3, although the full model provided a good fit to the data, all shared environmental parameters and the nonshared environmental across-age covariance parameter were nonsignificant (i.e., had confidence intervals that included zero) and could be dropped from the model without a significant detriment to fit. Estimates of genetic and environmental variances from the more parsimonious reduced model are presented in Table 4. There was little differential heritability across age (i.e., heritability estimates were not significantly different at ages 2 and 3 years). Genetic influences accounted for approximately two-thirds of the variance at both ages. The remaining variance at each age was explained by nonshared environmental influences. Both genetic and nonshared environmental factors contributed to change. Fifty-eight percent (i.e., .38/.65 × 100) of the genetic effects and 100% of the nonshared environmental effects at age 3 were independent of effects at age 2. Only genetic factors contributed to continuity across age, with 41.5% (i.e., .27/.65 × 100) of the genetic variance at age 2 persisting at age 3. The genetic correlation across age, indexing the degree of genetic overlap independent of the genetic variance at each age (i.e., regardless of whether the strength of the heritability estimate at each age is low or high), was .65, 95% confidence interval [0.55, 0.74]. This means that 65% of the genetic effects contributing to CU are overlapping at ages 2 and 3 years.
Model-fitting results

Note: –2LL, –2 log likelihood statistic; Δχ2, chi-square difference; AIC, Akaike information criterion; ACE, the full model including genetic, shared, and nonshared environmental influences.
a The overall fit of the model is determined by the difference in –2LL of the model and that of a saturated model.
b The relative fit of the model determined by the χ2 difference (Δχ2) between full bivariate ACE model and reduced model. Best fitting model indicated in bold.
c Drop all C and E covariance.
Genetic and environmental variance components (95% confidence intervals) from best fitting model

Note: a2, Genetic variance; c2, shared environmental variance; e2, nonshared environmental variance.
Discussion
Our findings with a very young sample are remarkably consistent with prior research examining CU in older children and adolescents. We found high heritability of CU at ages 2 and 3, and genetic influence on both stability and change across age. The nonshared environment (i.e., those experiences unique to each child) explained the remaining variance in CU at both ages, and contributed solely to change across age. Even at this young age, the shared environment did not contribute to individual differences in CU in early childhood.
Genetic factors accounted for the largest source of variance in CU at both ages (approximately two-thirds of the variance) with little evidence of differential heritability across age. Moreover, our estimates of genetic influence are similar to those in older samples. In other words, heritability estimates of CU do not differ greatly across age and across studies. This is not to say that the same genes are operating across age, just that the proportion of variance that is attributed to genetic influences (i.e., genetic effect size) is similar at different ages. In the present study, there was clear evidence of genetic change across the transition from infancy to early childhood; roughly half of the genetic variance at age 3 was independent from that at age 2. This novel genetic variance represents genetic change. Consequently, links between CU and developmental outcomes, such as ADHD, may vary across different developmental periods as a result of different environmental and genetic mechanisms that operate on CU across age. Further behavioral genetic research exploring the underlying links between CU and other behavioral outcomes (e.g., aggression and ADHD) at various ages is important to better understand how CU is associated with maladaptive behaviors across development.
There was also evidence of genetic stability across early childhood. It was these stable genetic factors that fully explained the age to age phenotypic stability. In other words, what makes a child behave similarly in CU across toddlerhood is entirely due to genetic effects that overlap across age. Finding possible biomarkers of this stability in CU could begin to identify children who are at risk for a more stable, severe CU developmental trajectory.
The strong genetic influences on CU do not suggest that intervention is not possible. CU was only moderately stable across age, indicating that there is substantial change even across a short 1-year period. These strong genetic influences on CU as well as the genetic contribution to stability across age do, however, make CU a promising target for identifying specific variants in molecular work on psychopathy (Viding et al., Reference Viding, Frick and Plomin2007). Yet we must remember that the novel genetic influences on CU at age 3 highlight the importance of considering age when conducting molecular genetic work on CU. Failures to replicate findings across age may reflect developmental change.
Previous research with other behavior problems (e.g., internalizing and externalizing) has found that shared environments play a significant role in early childhood (e.g., Saudino et al., Reference Saudino, Carter, Purper-Ouakil and Gorwood2008), but that heritability increases and shared environmental factors decrease with age (Eley & Stevenson, Reference Eley and Stevenson1999; Rhee & Waldman, Reference Rhee and Waldman2002; Rice, Harold, & Thapar, Reference Rice, Harold and Thapar2002; Scourfield et al., Reference Scourfield, Rice, Thapar, Harold, Martin and McGuffin2003). Although we predicted that early CU might also be influenced by environments that are shared within the family, this was not the case. The finding of no significant shared environmental influences on CU implies that parent characteristics that operate similarly across children within a family, such as parent personality or parenting style, do not play a direct role in the development of early CU. Moreover, it suggests that CU shows a different genetic and environmental developmental trajectory from other behavior problems.
The lack of shared environmental influences does not mean that the environment is unimportant; it merely means that family-wide factors do not contribute to individual differences in CU. The environments that are important to variation in CU are those that are unique to each individual within a family. Nonshared environmental factors accounted for roughly one-third of the variance in CU at both ages, highlighting the importance of environments that are specific to each child in the family. The simple twin design does not inform on the specific nonshared environments that are at work, but the finding of nonshared environmental influences highlights the importance of exploring environments that differ within rather than across families. Research should focus on environmental experiences that are unique to individuals within a family. Because a variety of unique experiences outside of the home are less likely to be relevant for our young age group (i.e., peers, teachers, or extracurricular activities are unlikely to differ substantially for twin toddlers), one plausible nonshared environmental factor is differential parenting. Parents may be sensitive to the unique needs and behaviors of their children and use different strategies or techniques with each child. Specifically, parent positivity, negativity, and discipline may vary for each child. The utility of targeting differential parenting is suggested by the finding that enhancing warmth in the parent–child interaction can decrease levels of CU in young children (Somech & Elizur, Reference Somech and Elizur2012). Research in early childhood demonstrates that parents use more negativity toward children with higher levels of CU (e.g., Fontaine, McCrory, Boivin, Moffitt, & Viding, Reference Fontaine, McCrory, Boivin, Moffitt and Viding2011; Waller et al., Reference Waller, Gardner, Hyde, Shaw, Dishion and Wilson2012, Waller, Gardner, et al., Reference Waller, Gardner, Shaw, Dishion, Wilson and Hyde2015), although no direction of effect has been established. One way in which negative parenting may directly influence CU is through differential parent demonstration of unemotional or harsh behavior and poor emotional communication, making it difficult for the child to understand the perspective or emotions of others (Daversa, Reference Daversa2010). However, differential parenting may be more complicated. It may be that there is a direct effect of differential parenting on CU, but it is also possible that the child's genetically influenced CU behaviors are eliciting more negative parenting, and/or less positive parenting (i.e., evocative genotype–environment correlation). Lower parental warmth is associated with higher levels of CU in early childhood (Waller, Gardner, et al., Reference Waller, Gardner, Shaw, Dishion, Wilson and Hyde2015; Waller et al., Reference Waller, Gardner, Viding, Shaw, Dishion, Wilson and Hyde2014), and has demonstrated a bidirectional effect (Waller et al., Reference Waller, Gardner, Viding, Shaw, Dishion, Wilson and Hyde2014) such that low parental warmth at age 2, in part, causes higher levels of child CU at age 3, and elevated CU at age 2 decreases parental warmth at age 3. These bidirectional results, though not explicitly exploring evocative genotype–environment correlations, hint that parents may be responding to genetically influenced CU behaviors of their children. Evidence of an evocative genotype–environment correlation has emerged between a related construct, low social motivation, and hostile parenting in an adoption design (Elam et al., Reference Elam, Harold, Neiderhiser, Reiss, Shaw, Natsuaki and Leve2014), but to date, there have been no studies of evocative genotype–environment correlations with CU. Behavioral genetic research using measured environments, such as differential parenting, in combination with measures of early CU, can address the question of whether CU evokes specific nonshared environmental effects.
As with past research, we found that the nonshared environment contributed to change, but not stability, in CU across age (Blonigen et al., Reference Blonigen, Hicks, Krueger, Patrick and Iacono2006; Fontaine et al., Reference Fontaine, Rijsdijk, McCrory and Viding2010). All of the nonshared environmental effects at age 3 were independent from those that operated on CU at age 2. Although beyond the scope of a simple twin design, this finding raises the intriguing question of the different nonshared environments that influence CU at each age. This is particularly important to developing interventions in early childhood. One possibility is that by 3 years of age children are more likely to be in some form of daycare or preschool, allowing for greater child-specific environmental influences such as interactions with peers and teachers/daycare providers. In our sample, attending some form of daycare increased by 39% from age 2 to 3 years. It may also be that differential parenting is affecting CU differently at each age. Even if the environments themselves do not change (e.g., even with no change in differential parenting at age 2 and 3), the relative impact on CU in children can vary with age. It is also possible that the amount or type of differential parenting changes across toddlerhood. This could be due to changes in parenting as a result of greater cognitive and socioemotional skills in the children, or new parenting tasks that emerge at age 3 (e.g., helping the child navigate peer relationships in preschool), which could create changes in how the parent is interacting with each child. Future work should identify specific nonshared environmental factors contributing to CU across young childhood, bearing in mind that the effects may differ across age. Identifying these individual age-specific environmental factors may be a critical next step to create targeted interventions. This is particularly important given that young children are more receptive to intervention (e.g., Ramey & Ramey, Reference Ramey and Ramey1998; Zigler, Taussig, & Black, Reference Zigler, Taussig and Black1992). Regardless of the mechanism, it is clear that across even 1 year of development there is substantial change in both environmental and genetic factors critical to individual differences in CU.
The potential limitations of this study should be acknowledged. CU scales typically show modest internal consistency, and our data is in line with other estimates in early childhood and beyond (e.g., Hyde et al., Reference Hyde, Shaw, Gardner, Cheong, Dishion and Wilson2013; Willoughby et al., Reference Willoughby, Waschbusch, Moore and Propper2011). However, within our sample, the stability and intercorrelations between other behavior problems are consistent with prior research with the CBCL 1.5–5 (Waller, Shaw, et al., Reference Waller, Gardner, Shaw, Dishion, Wilson and Hyde2015; Willoughby et al., Reference Willoughby, Waschbusch, Moore and Propper2011, Reference Willoughby, Mills-Koonce, Gottfredson and Wagner2014), and our biometric results are consistent with prior twin studies of CU at later ages. Thus, even though CU generally tends to show lower reliability, consistent results are emerging in the literature. Another potential limitation was the use of parent reports to assess CU. This is a limitation common to almost all studies of behavior problems in young children as clinician, teacher, and self-report are generally not possible with toddlers. However, the present results are in accord with previous research with older children that employed multiple reporters of child behavior. Hence, it appears that parents’ reports of their young children's CU behaviors have the potential to inform about an important aspect of behavior in early childhood. In addition, quantitative genetic analyses indicate the magnitude of genetic influence and the extent of genetic overlap across age, but they do not identify specific genes responsible for individual differences in CU. Similarly, although these designs can tell us about the impact of nonshared environments on the development of CU, they do not provide information about the specific environments that influence the behaviors under study. Nonetheless, these findings of anonymous effects provide important avenues for future research focusing on specific genetic and environmental effects. For example, researchers interested in understanding how the environment influences developmental change in CU would do well to focus on nonshared environments. Related to this, the basic twin design does not examine possible Genetic × Environment interactions and, as such, estimates the average effects in the population (i.e., average genetic variance collapsing across all levels of the environment). Results from the basic twin design are accurate, but general (Krueger, South, Johnson, & Iacono, Reference Krueger, South, Johnson and Iacono2008). Future work looking at Genetic × Environment interactions will allow for a more nuanced understanding of the genetic and environmental etiology of CU by exploring whether the heritability of CU varies under different environmental conditions (e.g., negative or positive parenting). Finally, our sample of approximately 300 twin pairs does not afford sufficient statistical power to explore possible gender differences in the magnitude of genetic and environmental effects. The literature in middle childhood and adolescence suggests few gender differences in heritability and environmental estimates (Viding et al., Reference Viding and McCrory2012a), but it remains an empirical question as to whether this is the case in early childhood.
In sum, even in very young children, CU is highly heritable yet moderately stable across age, suggesting malleability in the preschool years. Overlapping genetic factors across age explain the stability in CU from age 2 to 3 years, whereas both genetic and nonshared environmental influences contribute to change in CU. These results highlight the importance of considering a child's age when assessing behavioral outcomes, and suggest targets for intervention and molecular genetic work in CU. For CU to be truly understood and applied successfully to clinical work on psychopathology, development must be not be ignored.
Supplementary Material
To view the supplementary material for this article, please visit https://doi.org/10.1017/S0954579416001267.