1. Introduction and literature review
In rural areas of low-income developing countries, farming systems tend to be household-based and integrated with natural resources, such as forests and pasture lands. Households depend on these natural assets for fuel, animal food, building materials, fruits and medicines, and generally access them through ‘common’ systems. Many of these common resources have substitutes that households might privately employ. For example, villagers may plant trees on-farm that serve many of the same purposes as common forests. They might also adopt technologies, such as lorena stoves, that may conserve fuelwood or they may use commercial fuels when available.
This paper examines the relationship between common property forest management (CPFM) and on-farm tree planting. This linkage is of interest, because households often utilize multiple sources for fuelwood and other forest products, including natural forests, community plantations (Kohlin and Amacher, Reference Kohlin and Amacher2005; Jagger et al., Reference Jagger, Pender and Gebremedhin2005) and private trees planted on-farm (Fortman et al., Reference Fortman, Antinori and Nabane1997; Heltberg et al., Reference Heltberg, Arndt and Sekhar2000; Linde-Rahr, Reference Linde-Rahr2003; Nepal et al., Reference Nepal, Bohara and Berrens2007). On-farm tree investments may therefore reduce pressure on forests. Moreover, as we seek to understand the potential of CPFM for sustainable development, it is important to know something about the responses that can be expected when common forest management is improved.
In recent decades there have been important advances in our understanding of the management of common resources. An enormous literature has emerged that emphasizes the distinction between open access and community ownership and discusses the incentives for community members to cooperate. All of this literature stresses the need for households to defer their individual interests to improve forest productivity and enhance the long-term community interest. This implies that effective CPFM policies force households to restrict their collections compared with privately desired levels (e.g., Olson, Reference Olson1965; Dayton-Johnson, Reference Dayton-Johnson2000; Wade, Reference Wade1988; Ostrom, Reference Ostrom1990; Bromley, Reference Bromley1990; Baland and Platteau, Reference Baland and Platteau1996, Reference Baland and Platteau1999; Sethi and Somanathan, Reference Sethi and Somanathan1996).
In many countries policies have been adopted to improve management, with almost a conventional wisdom advocating devolution of natural resources to local groups resulting. Devolution of forests has, for example, been underway in Nepal since the early 1980s and most forest lands were transferred to users in 1993 through the creation of forest user groups (Adhikari, Reference Adhikari2002; Cooke, Reference Cooke2000; Pradhan and Parks, Reference Pradhan, Parks, Hanna and Munasinghe1995). Agrawal (Reference Agrawal2001, Reference Agrawal2000) notes that governments in more than 50 countries are ceding some control over resources to local users.
In addition to devolution itself, due to work by Ostrom (Reference Ostrom1990) and Agrawal (Reference Agrawal2000, Reference Agrawal2001) certain policies are now believed to be best practices, but we would emphasize the efficacy of various CPFM components is very much the subject of current empirical research. We divide these believed best practices into institutional characteristics and management tools. We define institutional characteristics as the basic values and arrangement of institutions. For example, clarity of access to forest resources, fairness, democracy and public participation are institutional characteristics. Management tools are policy instruments used to encourage or force members to mitigate their use of forests or improve forest quality. Fixed allotments of fuelwood and fodder, monitoring by officials and villagers, payments for rights to collect forest products, formal and informal sanctions, and work requirements to improve forest quality are all management tools.
Local control over natural resources is now regarded positively when forests mainly provide direct use values, but only recently has empirical work emerged that focuses on household responses to CPFM and that evaluates which elements spur behavioral shifts that improve social welfare (Hegan et al., Reference Hegan, Hauer and Luckert2003; Adhikari, Reference Adhikari2002; Amacher et al., Reference Amacher, Hyde and Kanel1996, Reference Amacher, Hyde and Kanel1999; Cooke, Reference Cooke2000; Edmonds, Reference Edmonds2002; Heltberg, Reference Heltberg2001; Heltberg et al., Reference Heltberg, Arndt and Sekhar2000; Linde-Rahr, Reference Linde-Rahr2003). The work of Nepal et al. (Reference Nepal, Bohara and Berrens2007) is of special interest, because it deals directly with incentives for on-farm tree planting. They look at a variety of social networks and find that forest-related institutions particularly spur on-farm tree planting. Other less forest-related groups have limited effects.
In this paper we look at on-farm tree planting as one of the technologies households might employ when faced with improved CPFM. Household modeling is used as the analytical framework, because production systems in low-income developing countries are labor-intensive, household-based, and key inputs and outputs are non-marketed (Cooke, Reference Cooke1998; Jacoby, Reference Jacoby1993; Singh et al., Reference Singh, Squire and Strauss1986). Comparative statics are then conducted, after which we use household data from the Bolivian highlands to identify the determinants of CPFM and estimate the effects of CPFM on the planting of trees on-farm. A particular contribution of this paper is to examine the effects of CPFM at varying levels of disaggregation. We test whether an overall CPFM index, institutional characteristics index, management tools index, and a variety of components of these two sub-indices are correlated with on-farm tree planting. We take this approach, because we want to know if it is the package of CPFM components or some of the individual aspects that cause households to respond to CPFM by planting trees on-farm. Perhaps not surprisingly, we find that some CPFM aspects spur more response than others, but the main finding of note is that the overall package of CPFM – and especially the basic values and institutional characteristics – is what appears to drive on-farm tree planting.
Nepal et al. (Reference Nepal, Bohara and Berrens2007) focus on the social value of various institutions households might join and find CPFM institutions have the strongest effects. This paper builds on their work, as well as that of others, by focusing on the category of institutions they found to be most significant. The paper is organized as follows. In Section 2 a model of a household production system is presented and comparative static results are discussed. Section 3 presents the econometric model used and data from a survey of 32 communities in the Bolivian Andes. Section 4 presents the results and Section 5 concludes and suggests avenues for further research.
2. A household analytical model and comparative static results
The theoretical and applied literatures suggest that effective CPFM, which is made up of institutional characteristics and management tools, should result in higher quality forests by restricting household deforesting behavior. Because households' most important variable factor is labor, we model these restrictions as inequality constraints on forest-related labor supply. Following Heltberg (Reference Heltberg2001) and Platteau and Abraham (Reference Platteau and Abraham2002), it is supposed forest policies are endogenous, but taken as given when villagers make their day-to-day decisions. Village households maximize utility, which is a function of cooked grains (gc), cooked meat (mc), and other goods (X) that must be purchased (1). First derivatives are positive and cross-partials zero.

Cooked grains (gc) are produced by combining fuel, raw grains, a stove technology and household labor. Fuels can be fuelwood collected by the household (f) or substitutes may be purchased (F). Households may also sell fuelwood (fs). Raw grains can be produced on-farm (g) or purchased in the market (G). Households may also sell grains (gs). The cooking technology (s) is the efficiency with which cooked grains are produced, so if a household has an improved stove, a higher value of gc is produced per unit of fuel. These inputs are combined with home effort (EH) to produce food.

Cooked meat (mc) is produced using (3), which is a function similar to that for cooked grains. The only difference is that meat is not purchased. Raw meat is a positive function of the animals (A) held, all of which provide meat. Examples include cattle, llamas, goats and sheep.

Raw grains are produced using household labor (Eg) and hired labor (Eh). Labor is complemented by agricultural land (L), which is fixed, and animals (A) that provide dung fertilizer and traction power (4). First derivatives are positive and second derivatives negative in this and the following three production functions.

Fuelwood is produced using fuelwood collection time (Ef) applied to common forests (Q) and trees on-farm (T). Higher quality commons offer the possibility to produce more fuelwood with a given input of Ef. On-farm trees are pure substitutes for common forests (5)

Equation (6) presents the animal production function. Animals are produced using grazing (Egr) and fodder collection (Efo) labor combined with Q and T. Animals are modeled as a technology that produces meat, dung, and traction, but they don't provide inter-temporal benefits.

Production occurs subject to the time constraint in (7). All on-farm activities are included, as well as off-farm wage labor (Ew). Leisure is not considered, because the labor–leisure tradeoff is not germane to our research questions.

There is no saving or borrowing and therefore the budget constraint binds. Cash is earned from wages at rate w from local labor markets, sales of raw grains at price Pg and sales of wood at price PF. Cash is spent on grains, priced at Pg, fuelwood priced at PF, wage labor hired-in at wage rate wh, and purchased non-food goods (X), which come at a per unit cost of PX (8).

Three inequality constraints allow for the possibility that households' labor supply to common property forest-dependent activities could be restricted by CPFM. Examples include allowable cutting of fuelwood, maximum days grazing in common forests, the requirement that households take what they need but not more, or that allocations be fair (9)

Equation (6) is substituted into (3) and (4). Equation (5) can be substituted into (2) and (3), which is then substituted into (1). Assuming a linear form of the utility function, the Lagrangian representing the household's maximization problem is given in (10). λ1 and λ2 are the Lagrange multipliers on the time and budget constraints. λ3, λ4, and λ5 are policy multipliers.

The endogenous variables are Eg, Ef, Eh, Efo, Egr, EH, Ew, F, fs, gs, G, and X. Maximizing the Lagrangian with respect to these variables yields 12 first-order conditions. Because our focus is on tree planting in response to CPFM, we only present FOCs for F and labor allocation variables dealing with common forests. Complementary slackness requires that either the differences in the constraints equal zero or if the constraints do not bind, the Lagrange multipliers are zero. Looking at what happens if λ3, λ4, λ5 are positive or zero therefore allows us to predict the adoption effects when CPFM imposes binding labor constraints. Non-negative values for λ3, λ4, and λ5 therefore represent the use of CPFM policies.




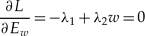

Comparative static results
We substitute (11(e)) into (11(f)) and the result into (11(b)). Rearranging, gives (12).

If λ3 is positive, binding fuelwood collection constraints exist. To maintain equality the right-hand side must rise or components of the left-side must decline. One possibility is that ∂f/∂Ef could rise, which could happen if on-farm tree planting (T) increased. We therefore expect that CPFM should increase on-farm tree planting. With constraints on fodder collection/grazing (i.e. if we use (11c) or (11d) rather than (11b)), similar results can be shown.
An alternative to tree planting would be for cooking efficiency (s) to rise when access to common property forests is restricted. Households might therefore adopt improved stoves or other technologies that conserve fuelwood. Finally, either or both of the two partial derivatives on the left-hand side could fall to maintain equality, which with diminishing returns would occur if use of commercial fuels (F), such as electricity, increased. The model therefore predicts that fuelwood-conserving technologies and commercial fuels are substitutes for on-farm tree planting. The intuition behind these results is straightforward. Faced with constraints, households look for alternatives to products from common forests. Planting of on-farm trees is one possibility, but others include technological measures such as alternative fuels and improved cooking technologies. The remainder of this paper focuses primarily on testing the first of these hypotheses, but also examines whether electricity and lorena stoves are indeed substitutes for trees planted on-farm.
3. Data and econometric method
The predictions of the analytical model are tested using data from a 2000 survey of village-level officials and 378 households in 32 communities in the five Bolivian Andes departments of Cochabamba, Chuquisaca, Oruro, Potosi, and La Paz. The sample is stratified to include more villages and households in the more populated departments of Cochabamba, Potosi and La Paz (about 25 per cent each) and fewer from Oruro and Chuquisaca (total of 25 per cent), which are less populous. The survey asked about (1) household characteristics, (2) forest management, (3) consumption, (4) production, and (5) assets. It is available upon request.
As is true throughout the developing world, Bolivian communities located in mountainous and hilly areas use forests for fuels, construction materials, medicines, fruits, fodder and grazing. In contrast to the lowland forests of Santa Cruz and Beni Departments, upland forests have limited commercial value. They have therefore largely escaped control by the central government. In the Andes, average elevation is higher in the north (by about 500 m), but so are temperature and rainfall, making it more fertile. Spanish colonization was concentrated in the north, which had a culture of private property earlier than other areas (Castro and Rist, Reference Castro and Rist1999; Moscoso and Villanueva, Reference Moscoso and Villanueva1997).
There are a variety of institutional regimes that control natural resources in rural Bolivia. Local communities have had substantial control over natural resources since 1952 when a major revolution ushered in an agrarian reform. Government reforms in the mid-1990s further decentralized forest control, but these measures mainly affected the lowland forests. In most areas systems are informal and evolved locally, implying significant and idiosyncratic differences in CPFM across communities. Some are indigenous and evolved over centuries.
In our survey of village-level policies we found that in some villages there is de-facto open access, with effectively no management. In the remainder, though, a variety of locally developed structures and officials regulate forests. For example in some areas no managers are named, but in village meetings residents agree on rules for forest use. Other villages have a variety of officials involved, including mayors, council members, community directors and presidents, peasant union presidents, forestry directors, and heads of committees for environmental protection. Thirty-three per cent of villages regulate forests based on formal laws, but all of those also use custom. In total, 78 per cent of villages regulate forests by custom and 22 per cent have no regulation at all. Except for grazing and timber, few villages explicitly control forest products. For example, while 55 per cent of villages regulate timber harvest and one-third control grazing, less than 10 per cent explicitly restrict fuelwood and fodder collections. These results suggest that CPFM is often tailored to local conditions.
The goals of the empirical analysis are to identify the household and community-level determinants of CPFM and test the degree to which various aspects of better CPFM spur on-farm tree planting. Because we are aware of no literature that analyzes tree planting's relationship with CPFM in the disaggregated fashion we attempt in this paper, our hypothesis is that all indices positively affect agro-forestry.
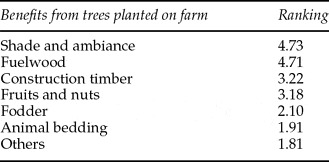
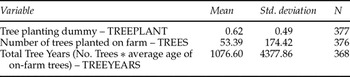
On-farm tree planting is very common, but by no means universal. Sixty-two per cent of respondents report they or their ancestors planted trees on their lands, making non-participation an important econometric issue. The average number of trees is 53 and for those who planted trees, the average age of trees is 14 years. As shown in table 1, the most important benefits reported by survey respondents are shade/ambiance, followed very closely by fuelwood production. Based on a t-test for equality of means we are not able to reject the null hypothesis that the means are equal (t = −0.09).
Mean ranking of benefits from on-farm trees (maximum ranking 7.0)

A majority of households use fuelwood for cooking, but other fuels are also used. These include electricity, which is provided by public enterprises to 2.6 per cent of households, and biomass fuels, such as dung and a local shrub called thola. Almost half of households use lorena cooking stoves, which in some cases can reduce fuelwood use. The lorena stove was introduced in Central America in 1979 and is popular throughout Latin America, because it is made of local materials, is attractive and has a chimney to channel smoke outside the home (www.aprovecho.net). As indicated by some aspects of the literature (e.g. Bluffstone, Reference Bluffstone1998), such technologies are potentially important ways to reduce fuelwood use and as the analytical model suggests they may also substitute for tree planting. We therefore incorporate the option that households may choose to adopt lorena stoves as an alternative to tree planting.

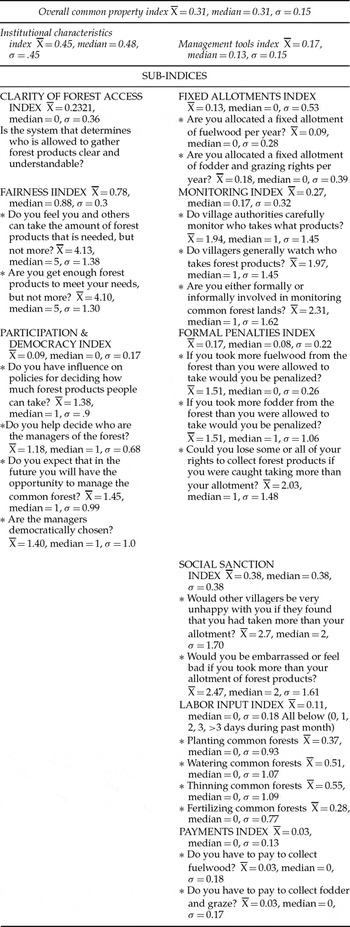
To address our two research objectives we create CPFM indices based on criteria suggested by Ostrom (Reference Ostrom1990) and Agrawal (Reference Agrawal2001). Nine indices were created for each household using the formula in (13). In this expression Aij is the value of index component i for household j and Mini and Maxi are the sample maximum and minimum for component i. This formula is used by the UNDP to compute the human development index and is ∈[0, 1]. CPFM variable definitions and descriptive statistics are presented in table 2. At the top is the overall CPFM index that is an average of institutional characteristics and management tools indices, which are themselves averages of more specialized indices. In these indices all components are weighted equally.
Definitions and descriptive statistics of CPFM indices (All indicesi ∈[0,1] as per (13). Unless noted, survey answers coded such that 5 = definitely, 1 = definitely not.)

It is important to emphasize that our CPFM indices are based on survey respondent perceptions. Perceptions are used for two reasons. First, in developing countries on-the-ground management can often correspond poorly with stated policies. Perceptions therefore have the potential to better reflect reality. Second, developing ‘objective’ measures of CPFM would require interviews with village leaders or forest managers who might have difficulties characterizing the details of CPFM facing individual households in their villages. Perceptions therefore offer a better opportunity to analyze the effects of disaggregated CPFM components.
If we examine the mean values in table 2, the picture that emerges is one of rather loose management, which some branches of the literature suggest should lead to limited behavioral effects, such as on-farm tree planting (e.g. Gibson et al., Reference Gibson, Lehoucq and Williams2002). In fact, only 28 per cent respond that forest access rules are at least ‘somewhat clear’. Few respondents report having fixed allotments for fuelwood (only 8 per cent) and about three-quarters think they would ‘definitely not’ be penalized if they take more forest products than they are allotted. An important missing institutional element is public participation. Few respondents believe they can influence forest management or that systems are democratic. Yet despite the lack of formal controls and apparent alienation, a substantial minority report that officials and villagers monitor forests. The data also suggest that villagers may be motivated by social pressures. Almost half say other villagers would at least ‘probably’ be unhappy or angry if they took too much fuelwood or fodder. Similar portions would be embarrassed if they took too much and many thought they could lose some of their forest privileges if they were caught overusing forests.
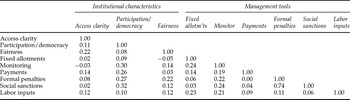
The overall CPFM index is strongly influenced by both sub-indices, but the institutional characteristics index has a higher correlation (ρ = 0.88) with the overall index than management tools (ρ = 0.53). Any taxonomy has an element of arbitrariness, but the two sub-indices appear to be measuring very different CPFM features, because they are very weakly correlated with each other (ρ = 0.13). We are therefore not concerned about multicollinearity between the two indices. Table 3 presents the correlation coefficients between the more detailed CPFM indices. Other than a high correlation between formal penalties and social sanctions (ρ = 0.74) and modest correlations between our participation/democracy index and four variables in the management tools index, there do not appear to be serious worries about multicollinearity. To test our specifications we ran all models with the formal penalties and social sanctions indices separately and aggregated into an overall penalty-sanction index. All models performed better in terms of generating statistically significant estimates when the indices were included separately. We also ran models with and without the participation/democracy index, but dropping the variable yielded no additional significance from the four correlated variables. Based on these tests we do not consider multicollinearity to be an issue.
Spearman correlations between CPFM index components

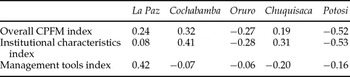
As shown in table 4, CPFM varies across departments. For example, the overall CPFM index is positively correlated with the Cochabamba (ρ = 0.32), La Paz (ρ = 0.24) and Chuquisaca (ρ = 0.19) dummies, but is negatively correlated with Potosi (ρ = −0.52) and Oruro (ρ = −0.27). Breaking the overall CPFM index into institutional characteristics and management tools indices reveals some subtleties. For example, the management tools index is positively associated with the La Paz dummy (ρ = 0.42), whereas the institutional characteristics index is virtually uncorrelated with households in that region. The situation is quite different in Cochabamba, however, where institutional characteristics appear to dominate (ρ = 0.41), while the management tools index is actually negatively associated with the department dummy (ρ = −0.07). The same basic result is also found for Chuquisaca.
Spearman correlations between department dummies and CPFM indices

We do not have detailed qualitative information on the nature of CPFM in the five departments where we have our 32 study communities and are therefore not able to shed much light on the reasons for these regional differences. We would note, however, that villages in departments with higher levels of CPFM tended to also have more area, be predominantly Aymara rather than Quechua and have forest management regulated by custom. As shown in first-stage regressions presented in the following section, these variables also tended to be associated with higher levels of CPFM.
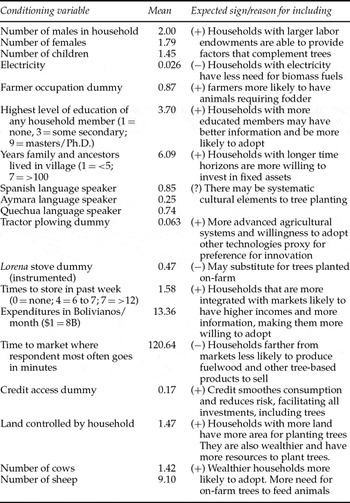
In addition to the forest management variables listed in table 2, in the econometric models a number of conditioning variables are included. These are listed in table 5 along with their means, expected relationships with on-farm tree planting and rationale for inclusion. Though generally poor, most households are integrated with markets, with 73 per cent of respondents having gone to a store during the week before the survey. This is despite a mean travel time of two hours. Borrowing is difficult for households, with only 16 per cent of respondents having access to credit from local money lenders. Mean land holdings are 1.47 hectares per household and 10 per cent of households are landless. Large animal holdings are limited, with less than half of households reporting cows and 40 per cent reporting pigs. Fifty-five per cent have sheep, with a mean of nine.
Conditioning variables included in all models

We define tree planting in three ways to derive conclusions that are robust to dependent variable definition and econometric technique. The first is a binomial variable indicating if household members or their ancestors had planted trees. Including ancestral trees is critical, because most families have been on their land for over 100 years. The second variable is the number of trees planted. Finally, the average age of on-farm trees is interacted with number of trees planted, giving total tree years on farm. Descriptive statistics are given in table 6.
Dependent variables

Recent literature has emphasized the endogeneity of forest management institutions. We therefore instrument for CPFM variables, using variables suggested in the literature as key drivers of coordination at the village level (Heltberg, Reference Heltberg2001; Platteau and Abraham, Reference Platteau and Abraham2002; Baland and Platteau, Reference Baland and Platteau1996). We also treat the use of lorena cooking stoves as endogenous, because our model suggests they are substitutes for tree planting that can be chosen by households. We consider electricity use to be exogenous to households' decisions, because it is clearly superior to wood as a fuel and is provided through political processes by the state.
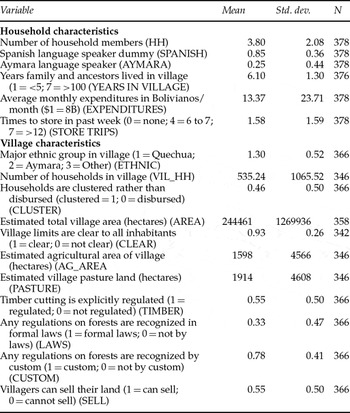
As shown in table 7, our CPFM instruments are a combination of household and village characteristics. Household and village characteristics come from our surveys of household heads and village leaders. As results change somewhat when department dummies are included, we present models with and without department dummies. As shown in table 7, villages have a mean of 535 households and most are primarily Quechua. They are evenly split between clustered and disbursed settlement patterns and virtually all have clear boundaries. About half have regulations for timber cutting in forests and allow people to sell their land. Typically, though, forest management regulations are determined wholly by custom, though some villages also utilize formal laws.
Descriptive statistics of instrumental variables used (abbreviations in parentheses)

The dependent variable TREEPLANT is analyzed using a probit model. The other two variables, TREES and TREEYEARS are count data variables and are therefore analyzed using count data methods. We test for a Poisson distribution, but, based on the highly significant over-dispersion parameter, it is rejected in favor of the more flexible negative binomial (NEGBIN) model. As was already noted, there is also substantial non-participation in the sample, with about one-third of respondents not planting any trees. The zero inflated negative binomial (ZINB) model accounts for high levels of non-participation unless there is sample selection, which if not corrected would lead to bias (Heckman, Reference Heckman1979; Linde-Rahr, Reference Linde-Rahr2003; Kohlin and Amacher, Reference Kohlin and Amacher2005). We therefore test for sample selection, but found that the inverse Mills ratio was not significant in any of the models (p value 0.40 to 0.58). We therefore do not report our Heckman results.
Using Vuong tests, we find we can reject the use of NEGBIN in favor of ZINB models at 1 per cent levels of significance or better. Unfortunately, ZINB models are highly sensitive to the specification of the inflation equation. In the following section we therefore report ZINB and NEGBIN results for the dependent variable TREES. Finding that the ZINB and NEGBIN results are similar, for TREEYEARS only ZINB results are presented. In these models we specify an inflation equation that includes variables reflecting regional and household characteristics. These include the following, with variables in italics indicating those also included in our tree-planting equations: LA PAZ DEPARTMENT DUMMY, OCCUPATION, HOUSEHOLD SIZE, YEARS IN VILLAGE, EDUCATION, ELECTRICITY, CAN BORROW, STORE TRIPS, LAND AREA, CATTLE, SHEEP.
4. Results
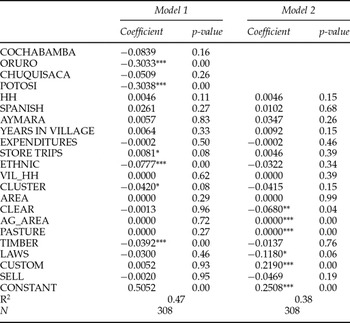
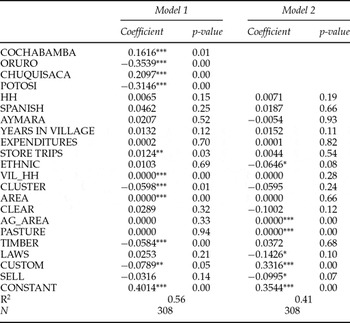
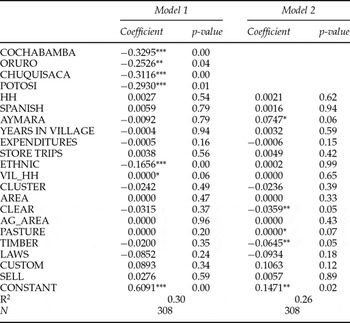
We now present models of our three aggregated CPFM indices, followed by results of our tree planting models. Sample sizes reflect the need for full-rank matrices and are less than 378 in all models. In the interest of brevity, we do not present results for the determinants of the nine individual CPFM indices, but these results are available from the authors. The CPFM index models are used to generate instruments for subsequent equations, but are also of interest in their own right as contributions to the literature on determinants of CPFM. All models have robust standard errors adjusted for village clustering. Models with and without department dummies are presented for each of our three aggregated CPFM indices, because village characteristics are correlated with department dummies, causing some village-level variables to become insignificant when department dummies are included. As F tests show, however, the models with department dummies (Model 1) better explain variations in CPFM. We therefore use Model 1 predicted values as instruments.
We see in tables 8–10 that a number of variables are associated with the overall CPFM, institutional characteristics and management tools indices. In Model 2, which omits department dummies, our three aggregated indices are all positively related with village agricultural area and/or village pasture. This may suggest that more village-controlled agriculture and pasture implies less forest, driving up its value and returns to better management. Villages where customs drive regulation also have higher values of all three indices in Model 2, but, in two models, villages that regulate forests using formal laws have lower levels of CPFM. This probably reflects the difficulties of legislating CPFM and the important relationship between social capital (i.e. customs) and CPFM (e.g. see Heltberg, Reference Heltberg2001; Hegan et al., Reference Hegan, Hauer and Luckert2003)).
Determinants of overall common property index (first stage IV regression) (average of institutional characteristics and management tools indices) OLS with robust standard errors adjusted for village clustering

Notes: ***, **, * indicate significant at 1%, 5%, and 10% levels.
Determinants of institutional characteristics index level (first stage IV regression) OLS with robust standard errors adjusted for village clustering

Notes: ***, **, * indicate significant at 1%, 5%, and 10% levels.
Determinants of management tools index level (first stage IV regression) OLS with robust standard errors adjusted for village clustering

Notes: ***, **, * indicate significant at 1%, 5%, and 10% levels.
It is striking how including the department dummies improves the fit of all three regressions. F tests that the coefficients on the department dummies are zero are rejected in all models at much better than the 1 per cent significance levels, indicating that idiosyncratic factors not captured by the sixteen household and village variables are important in determining the levels of CPFM perceived by households. This finding suggests that subtle and perhaps unobservable factors are likely to be the most important determinants of CPFM in countries like Bolivia.
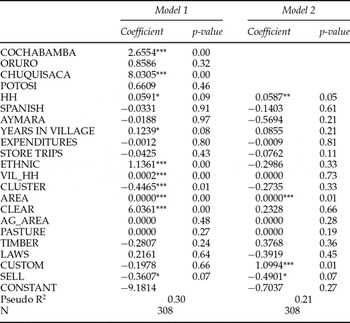
Table 11 presents our model of lorena stove adoption. We see a number of similarities particularly with our model of the institutional characteristics index. For example, in both models regression coefficients on the Cochabamba and Chuquisaca Department dummies, village size (measured by area and number of households) are positive and significant. Households in villages with clustered settlement patterns and those in villages that allow households to sell their land are less likely to adopt lorena stoves and have lower values of the institutional characteristics index. Though the overlap is certainly less than perfect, a number of similar results exist, which is not the case for the management tools index model. With a Spearman correlation between the two variables of 0.50, we are able to reject the hypothesis of independence at much better than the 1.0 per cent significance level. Predicted values of the two variables are even more tightly correlated (ρ = 0.82). Not surprisingly, given the correlation between the institutional characteristics and overall CPFM index, similar issues are present with the overall CPFM index, though the correlation with lorena stoves is less dramatic. As is discussed below, tree planting regressions are interpreted with reference to this result. Why institutional characteristics would be so correlated with lorena stove adoption while management tools is not is a question that seems to merit future research.
Determinants of lorena stove adoption (first stage IV regression) probit with robust standard errors adjusted for village clustering

Notes: ***, **, * indicate significant at 1%, 5%, and 10% levels.
We now turn our attention to models of on-farm tree planting, all of which are estimated with robust standard errors adjusted for the effects of village-level clustering. We analyze the effect of CPFM on tree planting using instrumental variables from the four regressions discussed above, plus those from our nine models of disaggregated indices, which are not presented. This approach allows us to examine whether it is the package of CPFM variables, the categories of CPFM (e.g. institutional characteristics or management tools) or individual components of CPFM that spur behavioral change. To highlight findings that are robust to CPFM and tree planting definitions, our discussions of marginal effects focus on results that are common across regressions.
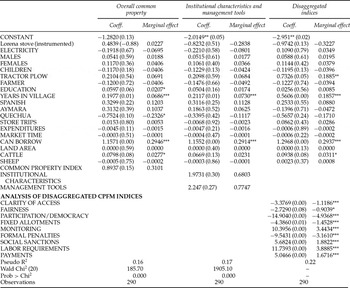
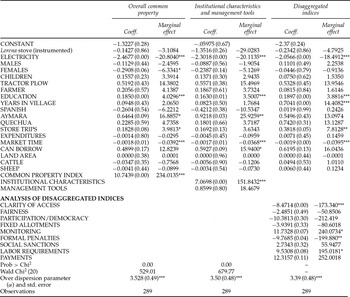
We see in table 12 that instrumented overall CPFM, institutional characteristics and management tools indices are not significantly correlated with the existence of trees on-farm at more than the 10 per cent level of significance. This contradicts our priors and dropping the lorena stove variable does not change this result. Table 16 presents elasticities of all CPFM variables significant at least at the 10 per cent level.
Probit models of on-farm tree planting (TREEPLANT) with different CPFM measures, robust standard errors adjusted for clustering by village

Notes: P values in parentheses *, **, *** indicate significance at least at the 10%, 5% and 1% levels.
All our detailed indices are correlated with TREEPLANT at least at the 10 per cent significance level. Positive and significantly correlated is instrumented monitoring. The relevant elasticity at the mean is 1.50, which means that a doubling of the overall CPFM index increases the probability of tree planting by 150 per cent. Throughout this section, this is the meaning of elasticities discussed. Social sanctions (ε = 1.15), labor requirements (ε = 0.69), and payments (ε = 0.08) indices are also positively and significantly correlated with the existence of on-farm trees. These results confirm our priors and it is interesting to note that these variables are all part of the management tools index. The clarity of access (ε = −0.41), fairness (ε = −1.14), participation/democracy (ε = −0.72), fixed allotments (ε = −0.30), and formal penalties (ε = −0.87) indices are all negatively correlated with the existence of on-farm trees. These results do not confirm our priors, which is that any increase in CPFM should lead to tree planting. Most of these variables are in the institutional characteristics index.
Neither the instrumented lorena stove variable nor the electricity dummy are significant, suggesting that neither of these variables determines if households plant trees. Running the model without the institutional characteristics or overall CPFM indices does not change this finding. These results contradict the predictions of the analytical model that fuel saving technologies and alternative fuels should be negatively correlated with tree planting. Positive and significantly correlated with TREEPLANT are years households have lived on their property and whether they are able to borrow. Marginal effects in both cases are small.
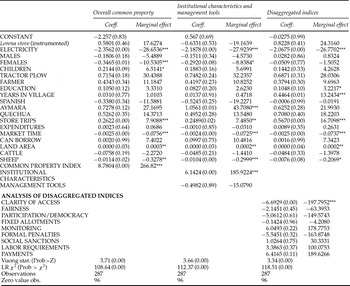
Table 13 presents NEGBIN results for number of trees planted on-farm. The overall CPFM index is positively and significantly correlated with TREES in this model as is the instrumented institutional characteristics index. Elasticities are 1.37 and 1.29, indicating strong effects on numbers of trees planted, and this is true with or without the lorena stove variable in the model. Among the disaggregated CPFM indices, monitoring and labor requirements are positively related to on-farm tree planting as they were in the probit model, with elasticities of 1.22 and 0.40 respectively. Clarity of access and formal penalties indices are negatively and significantly related to TREES as they were to TREEPLANT with elasticities of −0.76 and −0.64, suggesting that formalizing access and imposing penalties for violations reduces tree planting incentives.
Negative binomial models–numbers of trees planted (TREES) with various CPFM measures, robust standard errors adjusted for clustering by village

Notes: P values in parentheses *, **, *** indicate significance at least at the 10%, 5%, and 1% levels.
In no model is the instrumented lorena stove variable significant, but if either institutional characteristics or overall CPFM indices are dropped, lorena stoves are positively correlated with TREES at more than the 1 per cent significance level (ε ≈ 0.78). This result refutes our hypothesis that tree planting and improved stoves are substitutes; indeed, they may be complements. In all models the electricity dummy is negatively and significantly correlated with numbers of trees on-farm, though elasticities are extremely low. Education is positive and significant with ε ≈ 0.27. Time to closest market (MARKET TIME) is negatively related to on-farm tree planting in all models, but this is not a major driver of tree planting, because elasticities are approximately −0.09. STORE TRIPS is positively associated with tree planting in two models (0.12 < ε < 0.23). In two models households that speak Aymara also plant more trees with elasticities of 0.08 and 0.12.
Table 14 presents ZINB tree planting model results. We find a number of similarities with the NEGBIN model, but many more conditioning variables are significant and there is more uniformity across the three models. With and without lorena stoves in the model, elasticities of the overall CPFM and institutional characteristics indices are positive and approximately 1.57 in each case. This again suggests an important relationship between our aggregated CPFM indices (but not management tools) and tree planting. A key difference with the NEGBIN model is that among the disaggregated indices only clarity of access is significantly correlated with numbers of on-farm trees (ε = −0.86).
Zero inflated negative binomial models–trees planted (TREES) with various CPFM measures, robust standard errors adjusted for clustering by village

Notes: P values in parentheses *, **, *** indicate significance at least at the 10%, 5%, and 1% levels.
Electricity is again negatively correlated with tree planting with very small elasticity and the lorena stove coefficient estimate is not significantly different from zero. As was true in the NEGBIN model, if institutional characteristics or overall CPFM indices are dropped, the variable becomes positive and significant at greater than the 1 per cent significance level (ε = 1.05). In all three ZINB models coefficient estimates for STORE TRIPS are significant at the 1 per cent level or better, with elasticities between 0.23 and 0.49. MARKET TIME is again negatively and significantly correlated with TREES, though in the ZINB model elasticities of approximately −0.16 indicate more significant effects. These results suggest that in addition to CPFM, market integration is a significant determinant of tree planting. LAND AREA is positively related to tree planting in all models, but with elasticities of 0.05 to 0.08, estimated effects are small. We find evidence that households with more sheep plant fewer trees, presumably reflecting that sheep holding households rely on common rather than private lands for their livelihoods. Elasticities are small (ε = −0.04), however. In two models numbers of females were negatively and significantly correlated with TREES (ε = −0.30). Other estimates are significant in at most one of the models and are therefore not discussed.
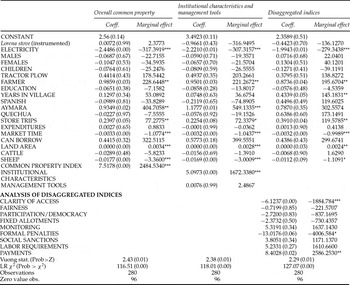
We now consider TREEYEARS, which is the product of numbers of trees and average age per tree reported by survey respondents. This variable captures both tree quantity and quality. In table 15 we find similarities with previous results, but also some differences. The overall CPFM and institutional characteristics indices are positively correlated with TREEYEARS as they were for TREES, but with elasticities of 0.72 and 0.70. Among disaggregated indices only PAYMENTS is positively correlated with TREEYEARS, but with an elasticity of only 0.07. CLARITY OF ACCESS and FORMAL PENALTIES are negatively correlated with TREEYEARS as in other models, with elasticities of −0.40 and −0.63, indicating inelasticity.
Zero inflated negative binomial models–total tree years (TREEYEARS) with various CPFM measures, robust standard errors adjusted for clustering by village

Notes: P values in parentheses *, **, ***indicate significance at least at the 10%, 5%, and 1% levels.
Households with electricity or more sheep are found not only to plant fewer trees, but also to have younger trees. Elasticities are again small at less than −0.02. Lorena stove adoption is unrelated to TREEYEARS unless the institutional characteristics and overall CPFM indices are dropped, whereby the variable is positive and significant (ε ≈ 0.38). Households that speak Aymara, go to the store more often and live closer to markets not only have more on-farm trees, but older trees (0.09 < ε < 0.12). The variable FARMER is positive and significant with elasticities of about 0.18.
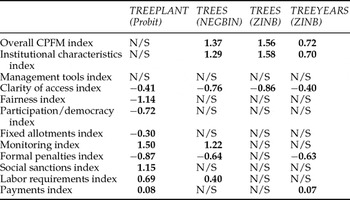
Table 16 presents a summary of CPFM elasticities with respect to our three aggregated measures of on-farm tree planting. With the exception of the probit model, which analyzes the existence of on-farm trees, in all models the overall CPFM and institutional characteristics indices are positively and significantly correlated with on-farm tree planting. Elasticity magnitudes are similar for the two variables and are particularly large when tree planting is measured as number of trees on-farm. These results suggest the overall package of CPFM and particularly the basic values and arrangement of CPFM institutions are major drivers of tree planting. Such findings are in line with our priors, though we also expected management tools to positively affect tree planting.
Summary of elasticities of CPFM variables with respect to on-farm tree planting

Note: N/S indicates not significant at least at the 10% level.
Among the disaggregated CPFM indices the result that is most robust to definition of on-farm tree planting is the negative, inelastic relationship between clarity of access to forest resources (CLARITY OF ACCESS) and tree planting. The other result that is robust across at least three models is the negative and inelastic coefficient estimate for the variable FORMAL PENALTIES. These results contradict our priors that all CPFM indices should be positively correlated with tree planting, but they also challenge us to think more deeply about the nature of these variables and how they differ from others that did not exhibit robust relationships. We note that both these variables – probably more than any other disaggregated indices – indicate clear property rights over common resources. For example, high levels of access clarity indicate that group membership is very well-defined and encroachers are therefore less likely. If formal penalties exist then rules for group members who take forest products must also be well-defined. The results therefore suggest that households plant fewer trees on their farms when common forest access is clear and formal penalties exist, because their rights are more secure. Productivity of forests may also be higher, further reducing incentives to plant on-farm. One might suppose that FIXED ALLOTMENTS would better indicate this feature, but it must be recalled that CPFM systems tend to be informal and based on custom. Fixed allotments therefore play a limited role in managing forests and, it seems, generating behavioral change.
5. Conclusion
Though often promoted aggressively by analysts and policy makers, relatively little is known about the details of how households respond to CPFM. This paper looked at the use of on-farm trees as one substitute for fuelwood and fodder collected from common forests. The analytical model suggests that constraints on forest degrading behavior should increase on-farm tree planting and that non-wood fuels like electricity and fuel conservation technologies, such as lorena stoves, substitute for these trees.
Our empirical results suggest that a strong ‘package’ of CPFM measures creates the strongest incentives for on-farm tree planting. Except for the probit model, in all tree planting models the overall CPFM index was positive and significant at greater than the 1 per cent level. Further, estimated elasticities are quite high, suggesting that on-farm tree planting is quite responsive to better overall CPFM. It is notable that the institutional characteristics part of the CPFM index drives these results and elasticities corresponded closely to those of the overall CPFM index. As a package, higher levels of clarity, fairness, public participation and democracy appear to spur tree planting, indicating that these basic values and norms may be especially important for altering household behaviors. It is notable that in no model is the management tools index significant. Taken as a group, variables such as fixed allotments, monitoring, formal penalties, social sanctions, labor requirements and payments for forest products do not appear to spur tree planting. These results point to the central role of custom in determining CPFM effectiveness.
Indeed, among the components of the management tools index the results that were most robust to estimation technique and dependent variable choice were that clarity of access and the existence of formal penalties were negatively correlated with tree planting. If tree planting is a behavior that indicates CPFM success, these CPFM aspects therefore appear to be counterproductive, but the correct interpretation may be more subtle, because these variables also indicate secure rights to common forests, making on-farm tree planting less desirable.
A number of conditioning variables are significant, including the electricity dummy, which is negatively correlated with tree planting in all models except the probit. Elasticities with respect to electricity availability were quite low, which was the case for most other statistically significant conditioning variables. This suggests non-CPFM variables are not empirically important drivers of on-farm tree planting. Of special note is that in no model is the lorena stove variable significant and only when the overall CPFM and institutional characteristics indices are dropped from the NEGBIN and ZINB models do we get significance. The estimated coefficient is positive rather than negative as expected, however, suggesting that improved stoves may complement on-farm tree planting. More research into the links between CPFM and cooking technologies within the household production system is clearly needed.
Indeed, a variety of important research questions remain. Now that we have shed some light on the relationship between CPFM and on-farm tree planting, it is important to evaluate whether relationships also exist with other technologies that could substitute for common forests. Such technologies may, for example, include commercial fuels and improved agricultural inputs. Of perhaps most importance to the long-run research agenda is to determine if and under what circumstances the constraints imposed by reducing open access actually increase long-run rural incomes. Also critical is the identification of policy instruments that increase rents and assure that any gains from better management reach all parts of households and strata of societies.