Implications
Inhalation of either high concentration of carbon dioxide (CO2) or nitrogen (N2)/CO2 mixtures induces a non-immediate loss of consciousness in which pigs feel aversion. However, when CO2 is lower than 20% and it is contained in an anoxic atmosphere (< 2% oxygen (O2)) with a high concentration of N2, the aversion is significantly reduced. Exposure to mixtures of N2 and CO2 causes a later loss of consciousness than high concentrations of CO2, which increases the duration of animal suffering. However, reduction of aversion during N2/CO2 mixture inhalation may improve animal welfare. The time to recover consciousness is reduced in N2/CO2 concentrations, especially in 85N15C. In order to avoid recovering, the use of 85N15C is not recommended for stunning pigs, and for 80N20C and 70N30C gas mixtures the time of exposure should be raised until at least 5 min.
Introduction
Stunning before slaughter is a statutory requirement in Europe (Council Regulation (EC) No. 1099/2009, 2009). One of the main used methods for stunning pigs in Europe is the exposure to an atmosphere with high concentration of CO2 (>80% CO2 in air). However, the inhalation of high concentration of CO2 compromises animal welfare as it does not cause immediate loss of consciousness (Raj and Gregory, Reference Raj and Gregory1995); instead, the inhalation of CO2 in pigs produces irritation of the nasal mucosal membranes (Gregory et al., Reference Gregory, Raj, Audsley and Daly1990), hyperventilation (Gregory et al., Reference Gregory, Moss and Leeson1987) and breathlessness (European Food Safety Authority (EFSA), 2004).
Exposure to anoxia (<2% O2 by volume in atmospheric air) using inert gases (i.e. argon or nitrogen (N2)) has been considered an alternative to high concentration of CO2 as it reduces aversion (Raj and Gregory, Reference Raj and Gregory1995; Dalmau et al., Reference Dalmau, Rodríguez, Llonch and Velarde2010b; Llonch et al., Reference Llonch, Dalmau, Rodríguez, Manteca and Velarde2012b). However, the time to induce unconsciousness when exposed to anoxia is longer (54 s) than when exposed to hypercapnia (>80% CO2, 32 s; Raj et al., Reference Raj, Johnson, Wotton and McKinstry1997). In order to reduce the time to unconsciousness, Raj and Gregory (Reference Raj and Gregory1995) proposed adding low concentrations of CO2 to the anoxic atmosphere for producing a hypercapnic hypoxia.
Some studies suggest that N2 can be used to stun pigs by anoxia (Dalmau et al., Reference Dalmau, Rodríguez, Llonch and Velarde2010b; Llonch et al., Reference Llonch, Andaluz, Rodriguez, Dalmau, Jensen, Manteca and Velarde2011). However, high concentration of N2 (>90%) in atmospheric air has a low stability, defined as the capability of the gas to be sustained within the pit in the existing stunning systems without being displaced by atmospheric air (Dalmau et al., Reference Dalmau, Llonch, Rodríguez, Ruíz-de-la-Torre, Manteca and Velarde2010a). The same authors reported that adding CO2 to high N2 concentration atmosphere increases the stability of the gas mixture. However, CO2 concentrations higher than 30% have been reported to be aversive (Raj and Gregory, Reference Raj and Gregory1995), which limits the CO2 concentration that can be added to the gas mixture.
Raj et al., (Reference Raj, Johnson, Wotton and McKinstry1997) assessed the brain activity in pigs anaesthetized with a gas mixture of argon with up to 30% CO2. However, the brain activity in pigs exposed to different mixtures of N2 and up to 30% of CO2 has not yet been studied.
Numerical indexes, based on the objective assessment of the electroencephalography (EEG), have been used by several authors to assess unconsciousness during stunning in pigs (Raj et al., Reference Raj, Johnson, Wotton and McKinstry1997; Martoft et al., Reference Martoft, Jensen, Rodriguez, Jorgensen, Forslid and Pedersen2001; Rodriguez et al., Reference Rodriguez, Dalmau, Ruiz-de-la-Torre, Manteca, Jensen, Rodriguez, Litvan and Velarde2008). They provide an on-time index of the brain activity that reports, by means of a numerical scale, the state of consciousness of the individual.
The Index of Consciousness® (IoC, IoC-view ® monitor, Morpheus Medical, Barcelona, Spain) is an algorithm that analyses the raw EEG with a unitless scale from 0 (isoelectric EEG, coma) to 99 (awake) (Revuelta et al. Reference Revuelta, Paniagua, Campos, Fernández, Martínez, Jospin and Litvan2008). The IoC-view ® monitor is currently used in human patients (Revuelta et al. Reference Revuelta, Paniagua, Campos, Fernández, Martínez, Jospin and Litvan2008), but has also been used in pigs (Llonch et al., Reference Llonch, Andaluz, Rodriguez, Dalmau, Jensen, Manteca and Velarde2011). The wireless technology of the IoC-view ® allows the assessment of the brain activity in non-restrained animals in conditions similar to those found in commercial slaughterhouses.
According to Holst (Reference Holst2002), unconsciousness can also be assessed by the absence of the brain stem reflexes (such as corneal reflex and rhythmic breathing) and sensitivity by means of the reflex response to pain. The advantage of these reflexes is that they can be easily monitored in the slaughterhouse once the animals get out of the stunner crate. However, in order to be a valid indicator of unconsciousness at stunning in commercial conditions, they need to be assessed and correlated with the brain activity.
The aim of this study was to assess unconsciousness in pigs during and after the exposure to the gas concentrations of 70% N2 and 30% CO2 (70N30C), 80% N2 and 20% CO2 (80N20C) and 85% N2 and 15% CO2 (85N15C) compared with 90% CO2 in air (90C) by means of the IoC®, their behaviour and the absence of brain stem reflexes.
Material and methods
Animals
The study included three trials of 24 commercially crossbred female pigs each. The mean live weight of the pigs was 93.0 kg (mean). The animals were transported to the experimental facilities 3 days before the start of each trial. On arrival, the animals were divided into the four treatment groups of six animals housed in separate pens of 18.2 m2 (8.3 × 2.2 m). Water and food were available ad libitum, but pigs were fasted 12 h before the experimental procedure.
Facilities
The experiment was carried out at the experimental slaughterhouse of Institut de Recerca i Tecnologia Agroalimentàries (IRTA)-Monells, next to the housing pens, and equipped with a Dip Lift CO2 stunning unit (Butina, Alps, Copenhagen, Denmark) that has a crate that descends into a well of 260 cm depth and 8 m3 of volume. The CO2 and N2 concentrations were controlled and mixed with two flowmeters (R-300-G Inox, Maquinsa, Madrid, Spain) at three bars of pressure, and a flow rate of 16 Nm3/h (Dalmau et al., Reference Dalmau, Llonch, Rodríguez, Ruíz-de-la-Torre, Manteca and Velarde2010a). The CO2 and O2 concentration at 120 cm depth was monitored with a portable infrared and electrochemical sensor, respectively (Map Check Combi O2/CO2, PBI-Dansensor, Barcelona, Spain). The housing pens were connected to the stunning unit by a straight corridor of 412 cm length and 60 cm width.
Stunning and recording procedures
Each treatment group was stunned with one of the following gas mixtures: 90C, 70N30C, 80N20C and 85N15C, all with <2% O2 by volume in atmospheric air.
Each trial was carried out during 4 consecutive experimental days, one per treatment. The order of the gas mixtures among the 4 days in each trial was randomly selected. During the experimental day, each pig was randomly moved to an adjacent pen without other animals. There, it was restrained with a snare and its head skin shaved and cleaned. Afterwards, three EEG surface electrodes (Blue sensor, AMBU, Spain) were attached to the skin in the head at the level of the frontal bone, separated 5 mm one from each other. Once all EEG electrodes were properly placed, the IoC-view ® monitor was attached to the hind part of the abdomen with an elastic bandage to avoid any damage during the experiment. After that, the pig was left for 10 min in the pen so that it could calm down to record the basal EEG. The pig was then moved to the corridor and allowed to enter voluntarily into the stunning crate. After 30 s, if the pig had not entered the crate it was gently pushed inside. Half of the group exposed to 70N30C, 80N20C and 85N15C were exposed to the gas mixture for 3 min (short period) and the others for 5 min (long period). Pigs exposed to 90C were also divided into two groups and according to the time of exposure of 2 and 3 min period each. Each pig was subjected to only one gas treatment. The crate descended to the bottom of the well for 23 s, remained stationary for 74 s (2-min exposure), 134 s (3-min exposure) and 254 s (5-min exposure) and ascended for 23 s to the floor. All recording times were synchronized with the time at which the pig started the descent into the well. Groups of eight and nine animals were alternated between short and long exposure among all treatments.
Measurements
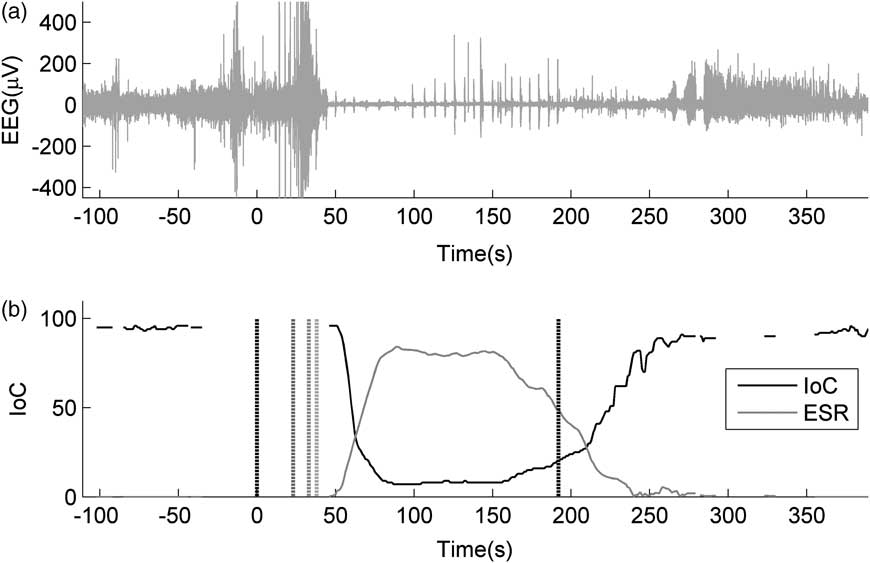
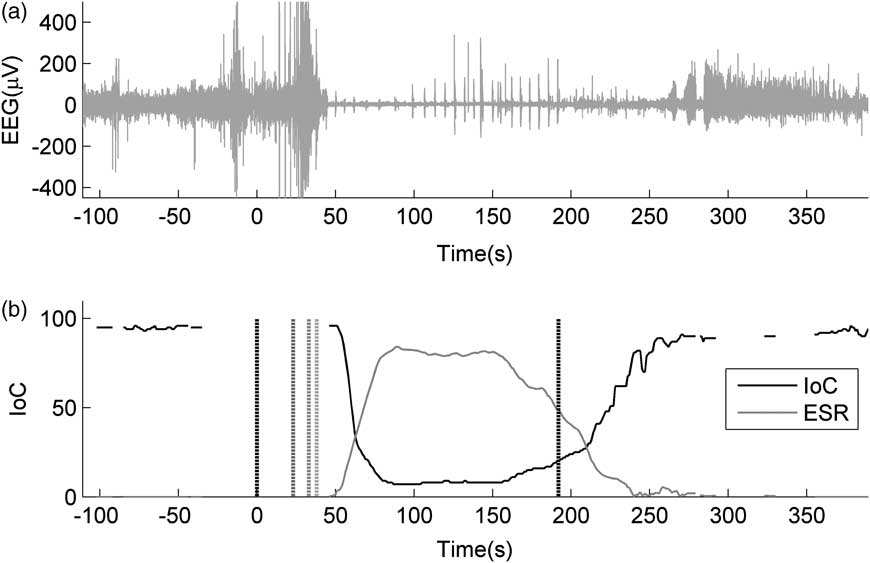
EEG was recorded from 10 min before the exposure until the basal IoC levels were achieved or when death was certified after the exposure. The IoC and the electric suppression rate (ESR) were calculated online from the EEG by the IoC-view ® monitor (Revuelta et al., Reference Revuelta, Paniagua, Campos, Fernández, Martínez, Jospin and Litvan2008). The ESR reflects the isoelectric EEG activity interrupted by brief periods of high-amplitude EEG activity indicating a non-specific reduction in cerebral metabolic activity (Rampil, Reference Rampil1998) and which appears during deep anaesthesia (Schaul, Reference Schaul1998). An example of the data available for each pig is presented in Figure 1. The IoC was calculated by an algorithm based on the EEG and the ESR of the data recorded during the last 7 to 12 s (Cardenas, Reference Cardenas2008). In order to correlate the time of the IoC to the onset of the behavioural and physiological reflexes, the IoC recordings were delayed an average of 10 s (Llonch et al., Reference Llonch, Andaluz, Rodriguez, Dalmau, Jensen, Manteca and Velarde2011).
Example of a raw electroencephalography (EEG) (a) and the Index of Consciousness (IoC) and electric suppression rate (ESR) (b) graphs before, during and after the exposure to a gas (i.e. 80N20C). The ‘a’ figure represents the amplitude (μV) of the electroencephalographic waves v. time (seconds). The figure ‘b’ shows the IoC and ESR values obtained after the analysis of the figure ‘a’ by the IoC-view ® monitor. The interval between the spotted black bars corresponds to the duration of exposure. In both figures, the 0 s corresponds to the beginning of the exposure. It also represents the loss of balance and the onset of vocalization and gagging, which are marked with decreasing spotted grey bars, respectively.
The behaviour of the animal in the stunning system was recorded by means of a video camera (Sony Colour CCD AVC 565, Circontrol, Barcelona, Spain) placed on the roof of the crate and connected to a digital image recorder (VDVR-4S 550430, Circontrol). The video records were subsequently analysed using behaviour analysis software (Observer XT 9, Noldus, Wageningen, The Netherlands). The behavioural measures assessed were:
• Gasping: a very deep breath through a wide open mouth, which may involve stretching of the neck. It is considered an indicator of the onset of breathlessness (Velarde et al., Reference Velarde, Cruz, Gispert, Carrión, Ruiz-de-la-Torre, Diestre and Manteca2007).
• Loss of balance: the inability of the animal to remain in a standing position and considered the first indicator of the onset of unconsciousness (Raj and Gregory, Reference Raj and Gregory1996).
• Vocalizations: shouts or snores emitted by the animal during the induction of unconsciousness (EFSA, 2004; Rodriguez et al., Reference Rodriguez, Dalmau, Ruiz-de-la-Torre, Manteca, Jensen, Rodriguez, Litvan and Velarde2008).
• Muscular excitation: a period of struggling ranging from fairly vigorous running and jumping movements to clonic convulsive seizures (Dodman, Reference Dodman1977).
• Gagging: low-frequency inhalations with the neck towards the front legs and occasional emitting of sounds similar to snoring (Rodriguez et al., Reference Rodriguez, Dalmau, Ruiz-de-la-Torre, Manteca, Jensen, Rodriguez, Litvan and Velarde2008). It has been considered an indicator of deep unconsciousness (EFSA, 2004).
After stunning, responsiveness to pain stimulus and presence of rhythmic breathing and corneal reflex were each assessed at 10 s intervals until 5 min after the end of the exposure. Corneal reflex was measured by touching the cornea with a blunt object; the response to pain stimulus was performed by a nose prick and assessing the blinking response; and the rhythmic breathing was visually assessed according to the movements of the flank. Those animals that after the end of exposure showed IoC values close to 0 and absence of all three reflexes were considered dead. Pigs that recovered consciousness were moved to the pen and euthanized after the end of the experiment by exposure to 90C for 5 min.
The experimental protocol was approved by the Institutional Animal Care and Use Committee of IRTA, which is authorized by the Spanish Authority of Animal Husbandry.
Statistical analysis
Data were analysed with the Statistical Analysis System (SAS 9.2, SAS Institute Inc., Cary, NC, 1999–2001). Latency measures (such as time to the first gasping, loss of balance, vocalization, onset and duration of muscular excitation, the time to reappear pain sensitivity, rhythmic breathing and corneal reflex), IoC and ESR data were analysed using a mixed model ANOVA (PROC MIXED) with a covariance structure of compounds symmetric with ‘gas mixture’ and ‘time of exposure’ as fixed effects. The ‘trial’ as a random effect was included in the model. When ANOVA showed significant differences (P < 0.05), a least square means comparison test (LSMEANS) adjusted to multiple comparison test of Tukey was carried out.
Binary data (presence of gasping, vocalization, muscular excitation, pain sensitivity, rhythmic breathing, corneal reflex and number of dead pigs) were analysed using a generalized linear model of ANOVA (PROC GENMOD) following a binomial distribution. ‘Gas mixture’ and ‘time of exposure’ were considered the fixed effects.
The correlation by means of the PROC CORR procedure between the different measures of behaviour and IoC were also analysed. In all cases, significance was assumed at P < 0.05.
Results
Brain activity
The IoC and ESR were successfully recorded in 56 out of 72 pigs. In the other animals, the IoC and ESR data were lost during the muscular excitation phase. Among the successfully recorded animals, 17 were exposed to 70N30C, 13 to 80N20C, 11 to 85N15C and 15 to 90C. The average basal IoC was 95.5 ± 0.47 and the ESR was 0.0, without differences among treatments. After the start of the exposure, the IoC decreased significantly (P = 0.002) from basal levels earlier in the animals exposed to 90C (37.6 ± 2.25 s) than in those exposed to 70N30C (45.2 ± 1.83 s), 80N20C (46.9 ± 2.28 s) and 85N15C (43.3 ± 2.36 s). The animals with a long exposure time showed significantly (P = 0.001) lower IoC value (0.8 ± 0.32) than those with a short exposure time (3.7 ± 0.71). The minimum value was reached significantly later (P < 0.001) during long exposure (257.2 ± 19.45) than during short exposure (138.6 ± 11.60).
The ESR appeared on average at 40.7 ± 1.90 s after the start of induction. The animals exposed to a long period showed higher maximum values of this rate than the short period (98.7 ± 0.65 v. 91.2 ± 1.72, respectively). No differences were observed between the gas mixtures assessed in time to get the maximum values (204.5 ± 14.08 s).
Twenty-five out of fifty-six pigs died after the gas exposure. The percentage of dead animals after the inhalation was affected by the gas mixture (P < 0.01) and the time of exposure (P < 0.001). All pigs exposed to 90C for the long exposure died, whereas 75% of those exposed to the short exposure recovered consciousness. No pig exposed during short period to 70N30C, 80N20C and 85N15C died, whereas after the long exposure 69.6% of the animals died, without differences between N2/CO2 treatments.
At the end of exposure, the time to recover the basal IoC was shorter (P = 0.032) in the short exposure (140.6 ± 16.90 s) than in the long one (179.0 ± 26.68 s); however, no differences were found between the gas mixtures.
Behaviour
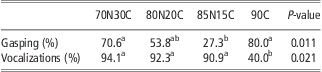
For the behaviour analysis, 56 out of 72 pigs with successful brain activity recordings were taken into account. The percentage of animals experiencing gasping was lower when exposed to 85N15C than 70N30C (P = 0.031) and 90C (P = 0.011; Table 1). However, the onset of this behaviour was similar between gas mixtures and exposure time (21.1 ± 1.02 s), and occurred before the IoC differed significantly from baseline in all pigs assessed. The pigs exposed to 90C lost balance earlier (22.3 ± 0.49 s) than those exposed to 70N30C (25.4 ± 0.69 s), 80N20C (24.5 ± 0.76 s) and 85N15C (26.4 ± 20.02 s), but this parameter was not affected by the exposure time. Loss of balance occurred while the IoC maintained the basal values in 98.2% of the animals. However, the time to loss of balance and the time that the IoC started to decrease were correlated (r = 0.40; P = 0.007) and, on average, the IoC decreased significantly below basal levels at 18.7 s after loss of balance. Fifty-five out of 56 animals showed muscular excitation. It started earlier (P = 0.002) in 90C (23.6 ± 0.88 s) than in 70N30C (27.8 ± 1.19 s), 80N20C (26.4 ± 0.66 s) and 85N15C (28.9 ± 1.91 s) treatments. At the onset of muscular excitation, the IoC had not significantly decreased from basal levels in 96.4% of the animals. The duration of the muscular excitation phase was longer in animals exposed to 70N30C (P = 0.007), 80N20C (P = 0.003) and 85N15C (P = 0.002) than 90C (Table 2), without differences between exposure times. During muscular excitation, the EEG was contaminated by muscular activity artefacts defined by high-amplitude waves. The percentage of animals that vocalized after loss of balance was significantly lower when exposed to 90C (40%) than when exposed to 70N30C (94.1%; P = 0.006), 80N20C (92.3%; P = 0.013) and 85N15C (90.9%; P = 0.021; Table 1). Vocalizations started on average at 34.1 ± 1.17 s, without differences among treatments or duration of exposure. However, the percentage of pigs that vocalized while the IoC showed basal levels was lower in 90C compared with 70N30C (P = 0.003), 80N20C (P = 0.012) and 85N15C (P = 0.026; Table 1).
Effect of the gas mixture on the percentage of pigs (n = 56) experiencing gasping and vocalizations when they were exposed to 70% N2 and 30% CO2 (70N30C), 80% N2 and 20% CO2 (80N20C), 85% N2 and 15% CO2 (85N15C) and 90% CO2 (90C)
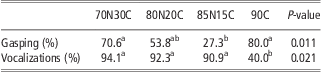
N2 = nitrogen; CO2 = carbon dioxide.
a,bMeans with different superscript letters are significantly different among gas mixtures.
Effect of the gas mixture on the duration of the muscular excitation during the exposure and the time to perform corneal reflex and response to pain when pigs (n = 56) had been exposed to 70% N2 and 30% CO2 (70N30C), 80% N2 and 20% CO2 (80N20C), 85% N2 and 15% CO2 (85N15C) and 90% CO2 (90C) gas mixtures

N2 = nitrogen; CO2 = carbon dioxide; RMSE = root mean square error.
a,bMeans with different superscript letters are significantly different among gas mixtures.
All animals (56 out of 56) showed gagging at 48.3 ± 1.85 s after the start of gas exposure. In 38.2% of those animals, gagging occurred when the IoC was not significantly different from the basal level, without differences between treatments or exposure times. Gagging occurred on average 5.1 s after the IoC initial decrease and 7.6 s after the onset of ESR increase.
Physiological reflexes
For the analysis of the physiological reflexes, 56 out of 72 pigs with successful brain activity recordings were taken into account. Rhythmic breathing was present in 19.6% of the live animals (n = 31 out of 56) just after the end of the exposure. The remaining animals recovered rhythmic breathing on average at 15.9 s after the end of the exposure when the IoC value was on average 15.6 ± 1.56, without differences between treatments or time of exposure.
Corneal reflex was already present at the end of the exposure in 25% of the live pigs. Pigs exposed to 85N15C recovered corneal reflex earlier (P = 0.049) than 90C (Table 2), but no differences were found between exposure duration. No differences were found between treatments or times of exposure in the average IoC value (18.5 ± 1.90) when pigs recovered the corneal reflex.
Among pigs that survived to the anaesthesia, 10.7% showed sensitivity to pain. In those that did not initially show this reflex, sensitivity to pain appeared earlier in 85N15C than 90C (P = 0.034), but no differences were found between the exposure duration (Table 2). The average IoC value when pigs recovered the sensitivity was 22.1 ± 3.99, without differences between treatments or exposure duration.
Discussion
Raj et al. (Reference Raj, Johnson, Wotton and McKinstry1997) exposed pigs to argon and CO2 gas mixtures and monitored the pigs’ brain activity by auditory evoked potentials (AEP). They stated that pigs that were exposed to 80% CO2 lost brain responsiveness later (21 s) than those exposed to 30% CO2 and 60% of argon in air (17 s) and to 90% argon (15 s). Martoft et al. (Reference Martoft, Jensen, Rodriguez, Jorgensen, Forslid and Pedersen2001), using the AEP, concluded that pigs exposed to 90% CO2 lost brain responsiveness on average at 14 s.
According to the IoC, pigs showed a decrease in brain activity at 37.6 s, 45.2 s, 46.9 s and 43.3 s after the start of the exposure to 90C, 70N30C, 80N20C and 85N15C, respectively. This delay in the onset of unconsciousness in the results of Raj (Reference Raj1999) and Martoft et al. (Reference Martoft, Jensen, Rodriguez, Jorgensen, Forslid and Pedersen2001) was also found by Rodriguez et al. (Reference Rodriguez, Dalmau, Ruiz-de-la-Torre, Manteca, Jensen, Rodriguez, Litvan and Velarde2008) who monitored the brain activity using AEP and concluded that the onset of unconsciousness occurred after 60 s of exposure to 90 CO2. Raj (Reference Raj1999) and Martoft et al. (Reference Martoft, Jensen, Rodriguez, Jorgensen, Forslid and Pedersen2001) obtained different results, but in both studies pigs were hung in a hammock and rapidly immersed in a box that contained the modified atmosphere. However, in our experiment, as well as in that by Rodriguez et al. (Reference Rodriguez, Dalmau, Ruiz-de-la-Torre, Manteca, Jensen, Rodriguez, Litvan and Velarde2008), the methodology of the gas exposure simulated commercial conditions, where pigs are immersed gradually to the required concentration in the base of a pit. It is likely then that a rapid exposure to the gas mixture will induce a quicker loss of consciousness.
In this study, the time to loss of balance, considered the first indicator of the onset of unconsciousness (Raj and Gregory, Reference Raj and Gregory1995), occurred on average 18 s earlier than the brain activity decrease. However, just after the loss of balance, 98.2% of the pigs showed muscular excitation, which could affect the IoC calculation. In fact, in pigs anaesthetized with propofol (which do not perform muscular excitation), the loss of balance occurred on average 7 s before the brain activity decrease (Llonch et al., Reference Llonch, Andaluz, Rodriguez, Dalmau, Jensen, Manteca and Velarde2011). The differences between both studies reveal that muscular excitation artefacts might delay the decrease of the IoC below basal levels, as the muscular movements embed the EEG recording with sparks of muscular activity that disrupt the IoC calculation.
In previous studies (Raj et al. Reference Raj, Johnson, Wotton and McKinstry1997), it was concluded that the time to loss of AEP is lower when exposed to anoxia or hypercapnic anoxia than hypercapnia. Inversely, our results suggest that the brain activity decreased earlier in 90C than in N2 and CO2 mixtures. In addition, the time to loss of balance was also shorter in 90C than in N2/CO2 mixtures. It is likely that a faster and deeper hyperventilation during inhalation of high CO2 concentration atmosphere (Forslid, Reference Forslid1992) increases gas intake and shortens the induction period and time to lose consciousness compared with N2 and CO2 mixtures.
When the muscular excitation started, the IoC was similar to basal levels in 96% of the pigs. The IoC maintained the basal values during the whole muscular excitation phase, and the onset of brain activity was reached after the end of this phase. Zeller et al. (Reference Zeller, Schatzmann and Imhof1987) and Rodriguez et al. (Reference Rodriguez, Dalmau, Ruiz-de-la-Torre, Manteca, Jensen, Rodriguez, Litvan and Velarde2008) stated that the physical activity during CO2 exposure might be an aversive response to the respiratory distress induced by the gas inhalation. On the other hand, Forslid (Reference Forslid1987) concluded that the struggling movements of the muscular excitation phase are convulsions that occur during unconsciousness. Our results suggest that the muscular excitation during gas mixtures exposure could start as an aversive response to the atmosphere, defined by vigorous escape attempts, and continued as convulsions during unconsciousness.
Pigs exposed to 90C started the muscular excitation phase earlier than the pigs exposed to N2/CO2 gas mixtures. This fact could be due to a more pronounced aversive reaction to the inhalation of high concentrations of CO2, which has been already mentioned by different authors (Raj and Gregory, Reference Raj and Gregory1996; Velarde et al. Reference Velarde, Cruz, Gispert, Carrión, Ruiz-de-la-Torre, Diestre and Manteca2007; Llonch et al., Reference Llonch, Dalmau, Rodríguez, Manteca and Velarde2012b).
The duration of the muscular excitation phase was longer in animals exposed to the N2/CO2 gas mixtures than to 90C. It has been stated that convulsions are caused by the release of the caudal reticular formation in the higher neuronal centres (Ernsting, Reference Ernsting1965) and that anoxia is more efficient than hypercapnia in abolishing the suppressive activity of higher centres contributing to a longer period of convulsions (Raj, Reference Raj1999). Consequently, the period of convulsions during hypercapnic hypoxia is prolonged compared with hypercapnia, which enhances the duration of the whole muscular excitation phase.
Gasping, used as an indicator of the sense of breathlessness, occurred before the decrease of the brain activity. According to our results, 80% of the animals exposed to 90C showed gasping, whereas this percentage decreased significantly in animals exposed to 85N15C (27.3%). Compared with hypoxia, hypercapnia is a more potent respiratory stimulant (Raj, Reference Raj2008), and therefore an increase of the CO2 concentration in the atmosphere provokes a rise of the sense of breathlessness (EFSA, 2004; Velarde et al. Reference Velarde, Cruz, Gispert, Carrión, Ruiz-de-la-Torre, Diestre and Manteca2007; Llonch et al. Reference Llonch, Rodríguez, Gispert, Dalmau, Manteca and Velarde2012a).
In the present study, the number of animals that vocalized was higher when exposed to N2/CO2 gas mixtures than to 90C. In conscious animals, vocalization is an indicator of stress (Raj et al., Reference Raj, Johnson, Wotton and McKinstry1997). In a commercial pig slaughterhouse, Gregory et al. (Reference Gregory, Moss and Leeson1987) observed that the majority of pigs vocalized during the inhalation of high concentrations of CO2 while they were conscious. In contrast, Raj (Reference Raj1999) concluded that vocalizations during exposure to argon, argon/CO2 mixture and 80% CO2 occurred while unconscious, given that they appeared just after the loss of somato-sensory evoked potentials and the appearance of gagging. In the present study, vocalizations occurred during muscular excitation, thus making the assessment of brain activity difficult. Nevertheless, when vocalizations occurred, any of the circumstances described by Raj et al. (Reference Raj, Johnson, Wotton and McKinstry1997) happened, and thus it could not be demonstrated that animals were unconscious when vocalized and that they are not signs of aversion.
During the exposure to all gas mixtures, gagging appeared on average 5 s after the brain activity started to decrease and 7 s after the onset of ESR. These results seem to confirm that gagging is a rudimentary brain stem response occurring in association with the process of exhalation that takes place when general anaesthesia is achieved. Consequently, after an exposure to a hypercapnia or hypercapnic anoxia, it can be considered as an indicator of unconsciousness.
According to the results of the IoC, a prolonged exposure to hypercapnia or hypercapnic anoxia induced a deep unconsciousness leading to death in some animals. The higher percentage of dead animals occurred in the 90C compared with N2/CO2 gas mixtures, but also in the longest time of exposure. This increase in the percentage of dead animals may be due to the deeper inhibition of the respiratory centre during hypercapnia.
The survival times of various parts of the brain after a period of anoxia may differ according to the regional O2 consumption rate. For example, the survival time of the medulla, where the respiratory centre is located, is one of the longest among all brain structures. Thus, normal brain activity may be restored in anoxia-stunned animals if O2 is administered or if they are allowed to breathe atmospheric air. On the other hand, after inhalation of high concentrations of CO2, apart from recovering O2 blood levels, the cerebrospinal fluid pH has to be restored to basal values, which could take longer. Inevitably, the recovery of consciousness is quicker (Raj, Reference Raj1999) and more frequent in hypercapnic anoxia than hypercapnia.
After the end of the exposure, the IoC reveals that normal brain activity was restored later in the long exposure than in the short one, but no differences were found between gas mixtures. This effect of the exposure duration is consistent with the number of dead animals as the metabolic crisis caused by the gas mixture inhalation increases with the rise of the time of exposure. With regard to the effect of treatment in the animals that recovered, the time to get the basal brain activity showed a great variation. This individual variability could mask significant differences between gas mixtures.
In contrast to the results of the IoC, an effect of the gas mixture was observed in the time to recover some brain stem reflexes. The time to recover corneal reflex and response to pain stimulus were shorter in animals exposed to gas mixtures with less CO2 (85N15C) compared with the other gas mixtures, suggesting that higher CO2 concentration induces longer periods of unconsciousness.
After the gas mixture exposure, the brain activity was not correlated with the appearance of the brain stem reflexes. For instance, rhythmic breathing, corneal reflex and sensitivity to pain appeared when the IoC was still below basal levels (15.6, 18.5 and 22.1, respectively). However, as Anil and McKinstry (Reference Anil and McKinstry1991) suggested, some symptoms commonly considered relevant for the assessment of consciousness are indicative of brain stem activity only and do not relate to cortical function. The IoC assesses cortical activity rather than brain stem activity and the recovery of the brain stem reflexes might precede consciousness.
Conclusions
According to the IoC, induction to unconsciousness by the exposure to 70N30C, 80N20C, 85N15C and 90C is not immediate. During this time, animals show signs of aversion and breathlessness, which is more severe in 90C compared with N2/CO2 gas mixtures. On the other hand, the onset of unconsciousness occurs earlier (from 6 to 9 s) when animals are exposed to high concentrations of CO2 (hypercapnia) compared with N2/CO2 gas mixtures (hypercapnic hypoxia), which reduce the period of time that animals are subjected to the aversive situation.
During inhalation of either CO2 or N2/CO2 gases, animals perform muscular excitation, which, with regard to the level of brain activity, might start as an aversive response to the gas inhalation and be followed to uncoordinated convulsions. This muscle excitation delays the calculation of the IoC, which makes the assessment of brain activity difficult.
According to the IoC, the recuperation of some brain stem reflexes such as corneal reflex, rhythmic breathing and response to pain after gas stunning could be used as indicators of the onset of brain stem activity recovery, but do not necessarily indicate recovery of the cortical activity and therefore consciousness.
In order to guarantee the maintenance of unconsciousness, pigs stunned with the N2 and CO2 mixtures tested should be exposed during at least 5 min to the gas. At the end of the exposure, the recovery of the brain stem activity started earlier in N2/CO2 gas mixtures, especially in 85N15C, compared with 90C, for which reason the use of 85N15C for the gas stunning of pigs is not recommended.
Acknowledgement
This work was funded by the Instituto Nacional de Investigación y Tecnología Agraria y Alimentaria (INIA) of the Ministerio de Ciencia e Innovación of Spain (AGL2005-06671-CO2-01).