


1. Introduction
Drifting and blowing snow occur when loose snow particles are available at the surface and when wind speeds increase above a certain threshold value. Then, turbulent motions are able to lift the snow particles upwards against the action of gravity. For moderately strong winds, the particles remain confined very close to the rigid surface and periodically rebound at the surface; this is generally referred to as saltation. For stronger winds, snow particles are able to leave the saltation layer and become suspended. In fully developed blowing snow, saltation and suspension occur simultaneously. In particular, the functional dependence of total snowdrift-transport rates on the wind velocity has been studied widely (e.g. Reference Budd, Dingle, Radok and RubinBudd and others, 1966; Reference RadokRadok. 1970; Reference TakeuchiTakeuchi, 1980; Reference SchmidtSchmidt, 1986; Reference Pomeroy and MalePomeroy and Male, 1992).
Snowdrifting is one of the many manifestations of two-phase flow systems. Therefore, the physical mechanisms involved in the drifting of snow are similar to those investigated ill the broad and complex field of two-phase (solid-fluid/gas) flows. Analogous processes are, for instance, the drifting of wind-blown desert sand (Reference BagnoldBagnold, 1941, Reference Bagnold1966), the transport of sediment over the ocean floor and river beds (e.g. Reference Bridge and DominicBridge and Dominic, 1984), blood flow, quicksand, sea spray and dense fog.
Snowdrifting occurs regularly over snow-covered regions such as the ice sheets of Antaretica and Greenland. The transport of snow by the wind can be a major mass-balance component over snowfields and ice sheets by spatially redistributing the precipitated snow (e.g. Reference Takahashi, Naruse, Nakawo and MaeTakahashi and others, 1988). Blowing snow over the edge of Antaretica even contributes in an absolute sense to the integrated mass balance. Sublimation of blowing snow also negatively contributes to the surface mass balance of snow-covered regions (e.g. Reference SchmidtSchmidt, 1982; Reference King, Anderson, Smith and MobbsKing and others, 1996). Furthermore, the occurrence of snowdrifting causes acceleration of the downslope katabatic winds Over sloping surfaces as a result of the increase in near-surface density of the gravity flow (Reference Kodama, Wendler and GosinkKodama and others, 1985). Drifting and blowing snow even affect the longwave-radiation balance of the lowest atmospheric layers, as pointed out by Reference Yamanouchi and KawaguchiYamanouchi and Kawaguchi (1984). Obviously, the occurrence of drifting snow influences and modifies many physical processes in the near-surface atmospheric layers.
This study focuses on the influence of drifting and blowing snow on ihe vertical turbulent mixing of momentum and scalars in the atmospheric surface layer. To keep a snow particle in suspension at a certain average height above the surface, the residual upward turbulent stress exerted on the particle must balance the downward force of gravitation. This requires expenditure of the surface-layer turbulence, which is manifested by decreases in turbulence-intensity and turbulent-length scales (Reference Adams and WeatherlyAdams and Weatherly, 1981). As the snowdrifting content decreases sharply with height, the surface layer is stably stratified and turbulence is reduced (Reference Wamser and Lykossov.Wamser and Lykossov, 1995). This mechanism is conceptually similar to a thermally stable turbulent surface layer in which negative buoyancy destroys turbulence (Reference Lumley and Bradshaw.Lumley, 1978). The effect of snowdrifting on turbulence may therefore be described by introducing an appropriate “snowdrift” Richardson number which depends on the vertical turbulent suspended snow flux. Besides showing model results in which this effect is quantified, we will present a simple, first-order parameterization of the stability effects of snowdrifting in terms of known surface-layer variables. As this study is one of the first to discuss the effects of snowdrifting on atmospheric turbulence and, since the model that is used includes various assumptions and empirical parameterizations, the results presented here are far from definitive; future work will focus on refitting the model.
2. Model Description
The drifting of snow particles in the air is considered as a two-phase turbulent flow of air mixed with rigid, non-cohesive, inertia-free spherical snow particles, separated sufficiently to be considered isolated so that particle interaction can be safely neglected (Reference Lumley and Bradshaw.Lumley, 1978). Furthermore, it is assumed that volume concentration is high enough so that the air-snow mixture may be regarded as a continuum and that the horizontal velocity of the particles equals that of the air but is low enough to ignore interaction. For this, it is necessary that the particles are small relative to the smallest length scale in turbulence, the Kolmogorov length scale, which is about 1 mm in the lower atmosphere. This is generally the case for snowdrifting with a particle diameter varying roughly between 40 and 400 μ (e.g. Reference Budd and RubinBudd, 1966).
2.1. Saltation of Snow
In our model of the suspension layer, the mass concentration in the saltation layer serves as the lower boundary condition. Snow stalls to drift when the friction velocity becomes larger than a certain threshold friction velocity. Assuming that saltation particle velocity is proportional to the threshold friction velocity  where
 is the threshold shear stress for snowdrift initiation and ρ is the density of the air snow mixture) with velocity-proportionality constant c, and using the empirically determined relation ce = 0.68 u
*
−1 where e is the saltation efficiency and u
* is the friction velocity, Reference Pomeroy and GrayPomeroy and Gray (1990) derived the following relation for the saltation-mass concentration
 (in kg m −3):

where g is the acceleration of gravity and hs is the height of the saltation layer. They showed that saltation-mass concentrations evaluated using Equation (1) compared favourably with observed values over a wide range of friction velocities. The height of the saltation layer is assumed to depend on the surface-friction velocity according to measurements made by Reference Pomeroy and GrayPomeroy and Male (1992). They defined hs as the height where downward-extrapolated suspended-mass concentrations equal the saltation-mass concentration. For various values of the threshold friction velocity, they arrived at the following empirical relation:

Several authors have argued that the shear stress at the surface remains at the threshold value during snowdrifting, even though the stress applied by the free atmosphere becomes larger (e.g. Reference BagnoldBagnold, 1941; Reference OwenOwen, 1964). In order to initiate saltation, the turbulent fluctuations must be able to break the cohesive bonds between the snow crystals at the surface and lift the particle (Reference SchmidtSchmidt, 1980). According to Reference Pomeroy and MalePomeroy and Gray (1990), the threshold-friction velocity for fresh, loose, dry snow varies from 0.07 to 0.25m s−1, whereas for old, wind-hardened, dense and wet snow its value can be much larger (0.25−1.0 m s−1). In this study, we assume that u *t is independent of particle size.
In order to account for the differences in size and weight of the drifting snow particles, we have subdivided the size spectrum into 16 classes of 30 μm width, with particle diameters ranging from 30 to 480μm. In the saltation layer, the frequency distribution of particle diameter is prescribed according to the well-known gamma function (with the shape parameter equal to 4 and the mean diameter equal to 200 μm (Reference SchmidtSchmidt (1982)). Reference Budd, Dingle, Radok and RubinBudd (1966) and Reference SchmidtSchmidt (1982) found that the gamma function adequately describes measured particle distributions at various heights in the suspension layer. In the following, we will refer to  as the mass concentration of particles with radius ri
, and to
 as the total mass concentration of suspended snow particles at a specific height above the surface (z):
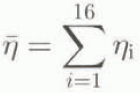
with  . In this study, we will not discuss in detail the simulated particlc-size distributions.
2.2. Suspension of Snow
Snow particles in suspension remain at a certain average height above the solid surface as a result of two balancing forces: the downward force of gravitation and the upward force due to a residual upward turbulent stress (we have neglected possible electrostatic forces). The flow must do work to keep the particles in suspension. Reference LeederLeeder (1983) demonstrated that the upward-directed residual Reynolds stress, arising from asymmetrical shear turbulence, is in balance with the immersed weight of the suspended mass. He found that this upward stress reaches a maximum 30% of the fluid shear stress  . There is a net-slip velocity or drag between the fluid and the particles. Hence, the fluid is decelerated and, consequently, turbulence is diminished in the presence of suspended particles (Reference Bridge and DominicBridge and Dominic, 1984). Generally, this reduction is due to a reduction in turbulent length scales and to a diminishing of turbulent-velocity fluctuations. If a parcel of the fluid with particlemass concentration equal to the local value changes level by means of turbulent movements, it will experience an anomalous buoyancy (actually a change in drag force exerted on the particles) which forces it back to its original level (Reference Lumley and Bradshaw.Lumley, 1978). This behaviour is conceptually equivalent to that of a thermally stably stratified turbulent surface layer in which real buoyancy effects destroy turbulence. We may therefore describe the influence of a stable suspended-snow stratification on turbulence in the surface layer by introducing the flux “snowdrift” Richardson number, which is defined as the ratio of destruction of turbulent kinetic energy by buoyancy forces (due to the stable density stratification of the air-snow mixture) and the turbulent energy production by shear (Reference Adams and WeatherlyAdams and Weatherly, 1981):

where  is the turbulent flux of suspended snow-particle mass,
 is the turbulent-momentum flux,
 is the relative excess of snow-particle density (ρs) over air density (ρa)) and μ is the mean horizontal velocity. Note that in the case of snow suspension, the air-snow mixture is always stably stratified, which means that
 .
In a horizontally homogeneous flow over a flat bottom, with the horizontal velocity aligned with the x axis and the z axis positive upward, the governing equations for horizontal velocity and suspended snow-mass concentration in size class  are:


where  is the Reynolds stress,
 is the total density (with
 is the volume concentration of snow in air) and Vi
is the terminal fall velocity of particles with radius ri
. The term
 in Equation (6) represents the downward flux of suspended snow due to the gravity force, in which the particle terminal-fall velocity is taken as

This is an empirically determined relation which takes into account Reynolds number-dependent particle drag (Reference Pomeroy and GrayPomeroy and Male, 1992). In a classical manner, the second-order moments in Equations (5) and (6) are parameterized in terms of the mean gradients (i.e. first-order closure):


The turbulent-eddy diffusivities of momentum Km
and suspended-snow particles  are written as


in which  (= 0.4) is the von Kármán constant, u*
is the height-dependent friction velocity and Φ is the stability function

where  is a parameter to be determined empirically. An increase in Φ (i.e. Φ > 1) represents a decrease in turbulent intensity under a stable-density stratification, induced by a stable stratification of suspended snow mass
 . In cases with a stable suspended-sediment gradient, values of
 ranging from 5.5 to 7.0 have been reported (Reference Bridge and DominicBridge and Dominic, 1984). These values compare well with the “thermal” equivalent of
 for a thermally stable surface layer (e.g. Reference GarrattGarratt, 1992). Notice that applying the stability concept in terms of the Richardson number provides no in-formation about the nature of the decrease in turbulence (i.e. turbulent length scales or intensity).
The parameter  is introduced to allow for a difference in the diffusivity of snow particles compared to the eddy diffusivity of momentum, as was suggested by the results of Sommerfield and Businger (1965). However, in this study we will use
 = 1, since we see no a priori reason why the turbulent eddies in the air-snow mixture should affect the momentum and snow fluxes differently. According to Reference GarrattGarratt (1992), first-order closure (Equations (8) and (9)) works quite well in stable boundary layers when the transfers are dominated by small eddies of length scales smaller than the typical length scale of the mean gradient, so we may expect that it is applicable here. Finally, notice that Equations (5) and (6) are coupled through the eddy coefficients Km
and Kh
.
2.3. Boundary Conditions
As we are interested only in the vertical profites it the suspension layer, we will have to use saltation-layer variables as a lower boundary condition. We will assume that the suspension-layer characteristics can be extended downward to the so-called focus height (f). This is the height at which the downward-extrapolated wind profiles during snowdrifting appear to intersect each other (Bagnofd, 1941; Reference Budd, Dingle, Radok and RubinBudd and others, 1966; Reference Shiotani, Arai and ŌuraShiotani and Arai, 1967; Reference RadokRadok, 1970); hence, it is the height at which the horizontal wind apparently remains constant during snowdrifting. Its presence apparently results from the complex dynamics in the saltation layer which are not very well understood at present. The focus is generally regarded as the height separating the “saltation” regime and the “suspension” regime in fully developed snowdrifting. According to Reference Pomeroy and MalePomeroy and Gray (1990), the focus height is of the order of 80% of the mean height of the saltating particle trajectories. Here, we will assume for simplicity that hf can be regarded invariant under all snowdrifting conditions. (This assumption is not consistent with Equation (2), although Equation (2) is used only to determine the saltation mass concentration; future work will include a How-dependent focus height.) Since, at the onset of snowdrifting. the logarithmic layer extends downward to the roughness height, the horizontal velocity at the fonts height during snowdrifting can be determined from

where z0m
is the intrinsic aerodynamic roughness length for momentum (i.e. the height at which the downward extrapofated wind speed equals zero in the absence of snowdrifting). We will take a value of z
0m representative for uniform, flat or slightly undulated snow surfaces, i.e.  (e.g. Reference KingKing, 1990; Reference WieringaWieringa, 1993).
The lower boundary condition of the suspended snow-mass Equation (6) is given by the relation for the saltation-mass concentration (Equation 1)) combined with the particle gamma-distribution function to obtain the saltation-mass concentration for each particle-size class. Note that the saltation-mass concentration can vary during a model run as it depends on an internal model variable (i.e. the friction velocity just above the saltation layer).
The height of the upper boundary (z = H) should be chosen so that (1) surface-layer simitarity theory is valid throughout the model domain, and (2) the largest part of the suspended snow mass is below z = H. At z = H, the turbulent flux of momentum is prescribed according to

where u*H
is the turbulent-velocity scale at z = H. In the absence of snowdrifting, application of Equation (5) with the boundary condition (14) yields the common logarithmic wind profile with  at each height.
The upper-boundary condition for snowdrift-particle mass in Equations (6) is that the upward-turbulent diffusion of snow equals the downward flux of snow by gravity in each particle-size class (i.e. zero net mass flux through z = H).
2.4. Numerical Detaits and Model Parameters
Equations (5) and (6) are solved on a finite-difference grid which is logarithmic in z in order to obtain a relatively high resolution near the surface where the vertical gradients are largest. The upper boundary (H) is set to 10 m with 40 grid-points evenly spaced in ln (z/hf).
The time differencing is simply forward in time, while the diffusion terms on the right-hand sides of Equations (5) and (6) are solved with central differences. The fluxes of momentum and suspended-particle mass are defined at points midway between the usual gridpoints. The model integrates from an initial wind-speed profile (characterized by different values ofu*H ) until a steady-state is reached. Table 1 summarizes the values of the various model parameters. With these values, the wind speed at the focus according to Equation (13) equals 3.9 m s−1.
Values of the model parameters

3. Results
We will show the results of experiments with varying initial wind-speed profiles, the steepness of which are determined by the value of u*H . Increasing values of u*H > can be associated with stronger externally forced boundary-layer winds. Figures 1–4 show the vertical profiles of horizontal wind velocity, friction velocity, Richardson number and suspended-mass concentration, respectively, for various values of u*H such that u*H > u*1 so that snowdrifting occurs.
Steady-state wind-speed profiles (thin lines) for five selected experiments represented by their initial friction velocity (u*H). >Bold lines represent the usual logarithmic wind-speed profile in the absence of snowdrift.

Vertical profile of simulated steady-state friction velocity (thin lines) for the five selected experiments. Bold lines represent the friction-velocity profiles which would be found if the stabitity effects of suspended snow are neglected.

Vertical profile of the “snowdrift” Richardson number (Equation (4)) for the five selected experiments.

Vertical profile of the suspended snow mass for the five selected experiments.

In a stable surface layer, the vertical transfer of momentum is initially reduced by the snowdrift-induced diminution of turbulent intensity. This implies that the presence of suspended snow induces a general increase in wind speeds (although near the surface a slight reduction in wind speed occurs), the largest increases occurring at higher levels (Fig. 1). In other words, the mean velocity gradient is larger for the same shear stress when snowdrifting occurs. Obviously, this behaviour is simitar to what is commonly observed in thermally stable surface layers (e.g. Reference GarrattGarratt, 1992). Figure 2 shows that u*
increases upward, which results from the fact that the density of the air—snow mixture decreases strongly with height and that the shear stress  must be constant with height in steady-state by virtue of Equation (5). The increase in u*
with height becomes stronger when the wind speed is larger and hence more snow can be kept in suspension. Also shown in Figure 2 is u*
′, which is defined as the friction velocity which would be found by an observer unaware of the stability effects induced by snowdrifting. Because of the steeper wind-speed profile in the case of snowdrifting, the observer who assumes a logarithmic wind profile finds a value of u*
′ that is larger than the true friction velocity throughout the surface layer. Obviously, if one neglects the stabitity effects caused by snowdrifting, the friction velocity would be significantly overestimated.
The vertical profiles in Richardson number are given in Figure 3. Interestingly, the suspended-snow Richardson number  takes maximum values close to the surface. This results from the fact that the turbulent snow-particle flux (which is proportional to the snowdrift mass concentration) and the associated buoyancy destruction is maximum near the surface and decreases rapidly upward. The increase in
 at higher levels can be attributed to the usual decrease in turbulent shear production with height (e.g. Reference GarrattGarratt, 1992). Interestingly, the Richardson number reaches its maximum value at nearly all heights for intermediate values of the wind-speed gradient (u*H
= 0.5−0.7 m s−1).
 tends to decrease slightly throughout the surface layer for stronger winds (or, equivalently, for larger values of u*H
). Apparently, the increase in shear production is larger than the increase in snowdrift-induced buoyancy destruction when wind speeds become stronger. This can at least partly be attributed to the fact that the increase in suspended mass with wind speed is largest at low winds by virtye of the dependence of saltation-mass concentration on u*
* (Equation (4)). The simulated values of
 obtained in these experiments compare favourably with those resulting from the suspended-sediment simulations of Reference Adams and WeatherlyAdams and Weatherly (1981). Note, however, that the increase in
 at higher levels depends strongly on the amount of suspended mass. If the simulated drift density at higher levels was smaller, the increase in
 at higher levels would be les pronounced or even absent.
The vertical distribution of suspended mass in the various experiments is shown in Figure 4. The relative increase in suspended mass with u*H is largest at higher levels, which is due to the fact that both the saltation-mass concentration and the vertical diffusivity of snow increase with wind speed. In all experiments, the suspended-mass concentration decreases by approximately two orders of magnitude with height. This decrease is smaller than that obtained from measurements over a uniform, completely snow-covered plain in Canada in winter (Reference Pomeroy and GrayPomeroy and Male, 1992). This discrepancy may be due to the fact that terminal fall velocities of especially the smallest particles are underestimated by Equation (7) (mean fall velocities range from 1.1m s−1 at the surface to 0.04–0.08 m s−1 at z = H), which leads to an overestimate of the suspended mass of the lightest particles at high levels.
Figure 5 shows the relative change in the turbulent-eddy diffusivity Km caused by snowdrifting. Clearly, it indicates that when snowdrifting occurs the eddy diffusivity of momentum decreases compared to a simitar surface layer without snowdrifting. Although the absofute values of Km become larger for increasing values of u*H , the largest reduction in Km relative to the case without snowdrifting occurs for intermediate values of u*H (by as much as 25%) The relatively strong decrease in Km near the surface results from a diminution of turbulence due to buoyancy as well as from a decrease in friction velocity (see Fig. 2), whereas at higher levels the decrease in Km is caused exclusively by the increase in Richardson number.
Vertical profile of the ratio of simulated “snowdrift” eddy diffusivity for (Km) and the “no snowdrift” eddy diffusivity for the five selected experiments.

Now it is also clear why surface-layer wind measurements indicated that the surface-roughness length appeared to increase with u* in the case of snowdrifting (e.g. Reference JoffreJoffre, 1982; Reference ChamberlainChamberlain, 1983). Not only does the wind-speed profile turn around the focus point (see Fig. 1), the stabitity-induced curvature also increases with increasing u*. When roughness lengths are determined from extrapolating downward the wind-speed profile, assuming that the log-arithmic wind profile can be extended down to the roughness height (which is not the case since the momentum balance of the saltation layer cannot be described by Equation (5)), both effects contribute to the apparent increase in z0m with u* during snowdrifting.
Needless to say, the decrease in the vertical turbulent exchange in the surface layer when snowdrifting occurs cannot be neglected in atmospheric models as well as in analysing surface-layer meteorofogical data. In the next section, we will present a simple parameterization which can be used to quantify the “pseudo”-buoyancy snow effect of suspended snow on the exchange coefficients when snowdrifting physics are not expliciny taken into account or when snowdrifting measurements are not available.
4. Parameterization
Assuming that u* is independent of height, the vertical wind-speed profile in the suspension layer can be derived analytically from the steady-state Equation (5):

Now consider Figure 6, in which the Richardson number is plotted against height for three selected experiments. Obviously,  increases roughly linearly with height for z > 0.5 m. Hence, we may approximate the vertical profile in Richardson number according to the linear relation
 in which the coefficient β may be identified with the inverse Obukhov length
 . Equation (15) can then simply be rewritten as follows:

The coefficients α and β are parameterized in terms of u*
by applying linear regressions of the simulated vertical profiles of  against height for the various experiments (represented by u*H
). Figure 7 shows the resulting dependence of α and β on u*. Clearly, α and β reach maximum values in the range of friction vetocities considered. This is a manifestation of the fact that the Richardson number takes maximum values for intermediate values of the wind-speed gradient, as explained in the previous section. The coeflicicnts α and β are accurately described by the following fourth-order polynomial fits (correlation coefficient > 0.99):


This yields the vertical wind profile relation in Equation (16), which includes the pseudo-buoyancy effects due to snowdrifting, in terms of known surface-layer quantities. The quality of the parameterization can be inferred from Figure 8, in which the simulated and parameterized wind-speed profile are depicted for three values of the initial friction vetocity. Clearly, the increase in wind speed due to the occurrence of snowdrifting seems to be parameterized reasonably well. However, ihe accuracy of the parameterization decreases significantly for large u*H . This is because the decrease in friction vetocity near the surface (see Fig. 2), which is largest for high wind speeds, is not taken into account in the parameterization. Hence, the parameterized wind-speed gradient near the surface is overestimated.
Variation of Richardson number with height for three selected experiments. The solid lines represent linear fits for z > 0.5 m.

Dependence of α and β on the friction vetocity of the initial wind profile, α and β are the coefficients of the linear fits of the Richardson number vs height (see Fig. 6).

Comparison of simulated and parameterized vertical wind-speed profiles for three selected cases. The numbers represent Ihe values of u*H (m s−1 in each case.

If the eddy diffusivities of scalars (e.g. potential temperature and specific humidity) are assumed to be identical to Km , the parameterization may also be used to quantify the snowdrift effect on the vertical scalar profiles. This parameterization provides a simple way to lake into account the buoyancy effects due toa stable snowdrift-density profile if no quantitative information about snowdrifting is available. However, one must bear in mind that the model was not tested for different values of the various model parameters (e.g. u*t ). Therefore, the parameterization presented here should be regarded as giving only a first-order estimate of the effect of suspended snow on the turbulent exchange coefficients in the atmospheric surface layer. In future studies, a more accurate parameterization will be constructed.
5. Discussion and Conclusions
In this study, we have described a model of the atmospheric surface layer that includes snowdrifting. The model calculates the vertical profiles of wind speed and suspended-snow mass in 16 size classes using first-order closure of the turbulent fluxes of momentum and suspended snow. Turbulence decreases to keep the suspended-snow particles at a certain average height against the action of gravity; hence the turbulent energy available for the vertical turbulent transport of momentum and suspended snow is reduced. Consequently, the eddy diffusivities decrease if snowdrifting occurs, causing larger vertical gradients to be necessary to maintain the same turbulent fluxes (Reference Lumley and Bradshaw.Lumley, 1978). The “pseudo”-buoyancy destruction in the case of a stably stratified air-snow mixture is conceptually equivalent to that of a thermally stable atmosphere and can therefore be described in terms of the appropriate Richardson number.
The model results clearly demonstrate the importance of snowdrifting on the vertical wind-speed profile. As a result of the stable stratification of suspended snow, the wind speeds increase throughout most of the atmospheric surface layer, especially at the highest levels. The eddy diffusivity decreases (by 10–25% ) compared to a similar case without snowdrifting. The associated Richardson number  takes large values ctose to the focus since the turbulent suspended-snow flux is largest ctose to the saltation suspension interface.
 decreases sharply to about 0.5 m, above which it increases roughly linearly with height. Note that increases in
 with height may be overestimated in this study, as the decrease in suspended-snow concentration with height is underestimated by the model. The steady-state momentum-budget equation can be solved analytically if
 is assumed to depend linearly on height, yielding a log-linear wind-speed profile. The coefficients of the linear relation between
 and height are parameterized in terms of friction velocity by calculating the model steady-state solution for various initial wind-speed profiles. This leaves an explicit log-linear vertical wind-speed profile in terms of known surface-layer quantities. It is demonstrated that the parameterized wind-speed profiles resemble fairly well the simulated ones. This simple parameterization givesa first-order estimate of the effects of snowdrifting on the vertical profiles of wind (and also scalars) and can be used when detailed information about snowdrifting quantities are lacking. One should bear in mind that the results of this study rely to some extent on a number of assumptions and empirical parameterizations. However, we are convinced that these do not influence our results in a qualitative sense.
Acknowledgements
The author expresses his thanks to the members of the Ice and Climate Group of the Institute for Marine and Atmospheric Researeh Utrecht for their comments on an earlier version of this paper. Financial support was provided by The Netherlands Antaretic Researeh Programme (GOA).



