Is Hillary Clinton able to win a third term for the Democrats in November 2016? Since 1952, Democrats and Republicans have each been successful three times in winning two consecutive terms. However, Ronald Reagan and George H.W. Bush were the only presidents to win three consecutive presidential terms for the Republicans (1981–1993).
Each electoral victory is based on a combination of several factors for which positive determinants outweigh the negative ones. In terms of positives, the current economic conjuncture is favorable to Hillary Clinton. With the country’s unemployment rate at 8.2% when Obama started his second term in January 2013, the nation’s unemployment rate has decreased to 4.7% in May 2016. In addition, she is helped by Obama’s approval rating, which is at 52% as of April 2016 (Gallup). This is still six percentage points higher than what Barack Obama had in 2012. Finally, Hillary Clinton is facing a divided opposition. Her opponent, Donald Trump, is the least-supported Republican nominee since 1980, with an average score of 44.5% among Republicans. In comparison, Mitt Romney won 50.1% of the GOP popular vote (2012), George W. Bush 65.2% (2000), Bob Dole 52.2% (1996) and Ronald Reagan 62.1% (1980).
While the planets seem aligned for Hillary Clinton, the bad news is the Democrats are running for a third consecutive term. Therefore, there is a risk of fatigue on the part of the electorate. Norpoth (Reference Norpoth2014) explains this phenomenon in terms of cycles; the risk of defeat is at its highest after two (possibly three) terms. Consequently, the competition could be more balanced than expected between the GOP and Democrats, at least with regard to the popular vote (PV).
The electoral vote (EV) has its particular logic since each state follows its own ideological pattern and has a high propensity to be either a stronghold or a swing state. In order to forecast who could be the next President of the United States, we developed a state-by-state political economy model based on local and national data, whose values were known one quarter before the election. After simulating popular votes at the state level, electoral votes (EVs) are deduced for the incumbent party and then aggregated at a national level. As a result, our methodology imitates the indirect process of the Electoral College used in the US presidential election. This state-by-state political economy model predicts that Hillary Clinton could be elected as president of the United States, despite a close race in the PV.
Our approach goes as follow. First, for each state, we calculated the probability that the Democrats will win an absolute majority of the votes. This is a departure from our previous forecast in 2012 (Jérôme and Jérôme-Speziari Reference Jerôme and Jerôme-Speziari2012). Second, to test the robustness of the aggregated forecast, we have cumulated the predicted votes whose probability was exceeding 73% to reach an absolute majority. This leads to classify the states according to whether they are weak, strong, or toss-ups for each camp.
The data used here are those available in the second quarter of 2016. Footnote 1 An optimal forecast would normally be made one quarter before the presidential election. However, the state-by-state probability of victory allows us to assume that the Democrats are leading significantly enough in terms of EVs to ensure Clinton’s success.
FORECASTING US PRESIDENTIAL ELECTIONS
According to Lewis-Beck and Stegmaier (Reference Lewis-Beck and Stegmaier2013), the 2012 US presidential elections were quite challenging for various forecasting approaches. With the increased demand in forecasts from not only campaigns but also citizens, the supply of forecasts available can be roughly classified into four specific groups: structuralists, aggregators, synthesizers Footnote 2 and judges.
Using economic and socio-political data, the seminal works in forecasting US elections (Sigelman Reference Sigelman1979; Lewis-Beck and Rice Reference Lewis-Beck and Rice1982; Rosenstone Reference Rosenstone1983 and Lewis-Beck and Rice Reference Lewis-Beck and Rice1984) were mainly structural and consequently based on a real theory of voting (Lewis-Beck Reference Lewis-Beck2005). Among them, Rosenstone (Reference Rosenstone1983), Holbrook (Reference Holbrook1991), and Campbell (Reference Campbell1992) build pooling models, whose unit of study is the state, but their approach remained an exception in the literature. State-based models are still neglected. For instance, in the last 2016 Pollyvote survey, econometric aggregated models were clearly dominant.
Our PEM uses data disaggregated below the national level and then generates sub-national predictions before aggregating them to create an overall prediction. Accordingly, our forecasting approach differs from almost all other models currently forecasting US elections.
Fundamentally structural, our political economy model (PEM) is also part of this state-based “family” Footnote 3 of forecasts, but takes into account partisan patterns at the state level, following our first political economy pooled time series models built for the 2002 French presidential elections (Jérôme and Jérôme-Speziari Reference Jérôme and Jérôme-Speziari2001; Jérôme, Jérôme-Speziari, and Lewis-Beck Reference Jérôme, Jérôme-Speziari and Lewis-Beck2003).
Our PEM uses data disaggregated below the national level and then generates sub-national predictions before aggregating them to create an overall prediction. Accordingly, our forecasting approach differs from almost all other models currently forecasting US elections. Our approach has shown its accuracy by correctly predicting the two-party result for both PV and EV in 2004, 2008, and 2012. Footnote 4
WHY FORECAST US ELECTIONS WITH POOLED TIME-SERIES MODELS?
We can expect the model to perform better insofar as pooling data clearly helps increase both the number of observations in the dataset and the degrees of freedom. A larger number of observations helps minimize biases due to aggregation effects. In addition, we expect benefits from the “properties of aggregation” in that errors can be balanced out. According to Baltagli (Reference Baltagli1995), a pooling process also allows for research into the “dynamics of change.” Indeed, purely cross-sectional or purely longitudinal methods are unable to measure or to exhibit structural effects, which are based on both time and the individual.
Furthermore, as American politician Tip O’Neill used to say, “All politics is local.” This is merely an explicit way of saying that voting behavior has a territorial component in the United States. Since the US presidential election is ultimately decided by the Electoral College vote, there is an obvious interest in predicting what could happen in “battleground” or “swing” states. If local economic and social conditions affect voters’ electoral behavior in a given state, then we can improve our predictive accuracy at the national level by using pooled time series voting models that make use of state-level data.
Sometimes in particular geographic areas, voting behavior is driven by long-term forces, but these are rarely immutable. First, some local effects depend on parameters such as changes in general economic conditions or/and changes in local economic conditions, which could lead to a significant residential mobility (see Tiebout Reference Tiebout1956 and “voting with one’s feet”). Second, some states are very stable ideologically, whereas others are highly unstable. In light of these idiosyncratic considerations, our state-by-state approach must reflect the evolution of “partisan domination” through time and space. For those purposes, we have built two partisan representation indexes reflecting states’ partisan particularities. To achieve this, we distinguish between the entire period under study (1952–2012) and the period from 1980 to 2012, because this is when significant partisan changes occurred in US politics.
From 1952 to 2012, Republicans were dominant in 12 out of 50 states (plus DC) (AK, AZ, ID, IN, KS, MT, NE, ND, OK, SD, VA, WY); this means that the Republicans have a long-term electoral base of 72 electoral votes (EVs), or 13.4% of the total EV. The exact same calculation for the Democrats Footnote 5 leads to a long-term electoral base of 42 EVs, or 8% of the total EV (HI, MD, MA, MN, RI, and DC). These “locked-in” states are considered to be electoral strongholds for each party.
However, some states are “swing states,” or states that realign over time (see Merrill, Grofman, and Brunell Reference Merrill, Grofman and Brunell2008), such that both Democrats and Republicans profit from what we call a “new domination” since 1980. For Democrats, this potential new domination can be observed in CA, CT, DE, IA, IL, ME, MI, NJ, NY, OR, PA, VT, WA, and WI, which translates into 206 EVs, or 38% of the total EVs. For Republicans, their potential new domination may appear in AL, AR, GA, KY, LA, MS, MO, NC, SC, TN, TX, and UT, which amounts to 142 EVs, or 26.4% of the total EVs. We must underline that the Republicans’ gains are mostly in the southern states (except MO and UT), where they have captured southern Democrats. Since 2012, it should be noted that GOP is becoming stronger in NC. Finally, seven states Footnote 6 remain without strong partisan domination, representing 76 EVs, or 14% of the total EVs.
STATE-BY-STATE VOTE FUNCTION AND VARIABLES
Models built on vote functions are based on a theory of governmental responsibility (Key Reference Key1966). Vote functions offer an explicative model of voters’ choices and preferences and provide a model of votes for an incumbent based on political and economic performances. Vote functions need to include “good” political and economic variables side-by-side in order to gain stability (Lewis-Beck and Stegmaier Reference Jerôme and Jerôme-Speziari2013; Nannestad and Paldam Reference Nannestad and Paldam1994). Thus, Rosenstone (Reference Rosenstone1983) argues that only such an approach can explain why citizens change their vote from one election to the other.
The structural model from which we will compute the ordinary least squares (OLS) regression estimates, along with the operationalization of the variables from 1980 to 2012 in the 50 American states plus DC (N=459), goes as follow:
INCV i,t = C + ΔU i,t-n + PJA t-n + PPI i,t-n + Politics and Institutions i,t-n + President’s local Strongholds i,t-n + Local Peculiarities i,t-n + Error
The dependent variable INCVi,t measures the vote share in the ith state (i = 1, …., 51) and for the tth time period (t = 1980, 1984, …, 2012) secured by the incumbent party. The outgoing President was a Democrat in 1980, 1996, 2000 and 2012 and Republican in 1984, 1988, 1992, 2004, and 2008.
Vote functions offer an explicative model of voters’ choices and preferences and provide a model of votes for an incumbent based on political and economic performances.
For the explanatory variables, the first variable (ΔU) is the change in the local (i.e. state-level) unemployment rate from the month after the president was elected to the month prior to the next presidential election. A positive change in state unemployment (i.e. more unemployment) should cost the incumbent some of their vote share. The second variable (PJA) is the Gallup President’s Job Approval, at a national level, six months before the election. For the outgoing candidate, the higher the president’s popularity is, the higher the electoral premium. However, the impact of popularity should not be the same and depends on whether or not the incumbent is seeking a second term. Thus, PJA2 is the president’s popularity when seeking a second term (and 0 otherwise). PJA0 is the President’s Job approval when the incumbent is not running for a second term. Following the discussion above, the third variable (PPI) takes into account the characteristics of the partisan cycle in each state. PPI is divided into two local partisan domination variables, one named PPI5212 to code states having significant partisan domination since 1952 and another one called PPI8012, or “new domination” since 1980, which includes recent southern Republican strongholds. More precisely, PPI5208 gives for each state over the 1952–2012 period the rate of success for each party when this rate exceeded 85% Footnote 7 for the Republicans and 63% for the Democrats (this variable takes a zero value otherwise). When the ideology of the state is the same as the incumbent, it carries a positive sign; otherwise, it carries a negative sign. Substantively, this means that an incumbent will be rewarded by states that are ideologically similar and punished by states that are ideologically dissimilar. The PPI8012 variable was constructed in the same way, except that the rate of success is calculated for 1980–2012.
Some other explanatory variables used to build the econometric model deal with politics and institutions (i.e. the electoral weight of independent candidates), the president’s electoral strongholds (i.e. measuring their home state advantage) and local electoral peculiarities such as scores usually deviating from the standard (Democrats in DC for instance). Unlike our 2012 forecasting model, a variable for the opposition nominee’s vote share during their party’s primaries (OPPVP) is included, asserting that the higher their score is, the more threatened the incumbent candidate could be. As mentioned above in preliminary discussion, this could be a weakness for Donald Trump in some cases. Footnote 8
Empirical Results
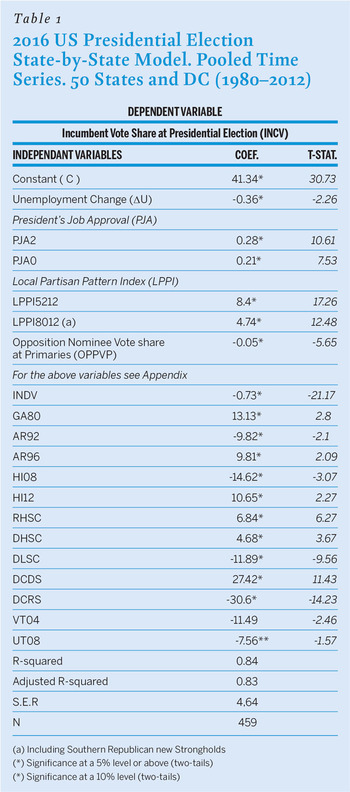
The results for our vote function are presented in table 1. With regard to the main variables, the US presidential vote function provides good statistical results. This model explains 84% of the variance and all the coefficients are statistically significant (t-ratios at 0.05, two-tailed) except UT08 t-ratio at 0.10. The standard error of regression (SER) is 4.64. This means that each estimated score in each state has to be interpreted with a ± 4.64 margin of error. Furthermore, all of the coefficients for the explanatory variables in the presidential vote function (for incumbents) are of the expected sign.
2016 US Presidential Election State-by-State Model. Pooled Time Series. 50 States and DC (1980–2012)

(a) Including Southern Republican new Strongholds
(*) Significance at a 5% level or above (two-tails)
(*) Significance at a 10% level (two-tails)
Among the variables used in the forecast, the constant provides an estimate for the incumbent’s electoral base, which is 41.34% of the long-run vote share. On average, a one-point rise in the unemployment rate costs the incumbent 0.36% of the votes in a given state. In the case of new candidate (from the incumbent president’s same party), a popularity score of 50% for the current president yields 10.5% more of the popular votes. However, in the case of a incumbent president seeking a second term, a 50% approval score yields 14% more of the popular vote.
On average, the outgoing majority gains 8.4%, depending on the party’s historical strength in a particular state (PPI5212). However, in strongholds such as these, the opposition candidate suffers a 8.4% electoral disadvantage. In “new partisan domination” states (PPI8012), the outgoing majority gains an average of 4.7% in their strongholds, while the opposition candidate suffers a 4.7% electoral loss. Finally, a vote share of 50% for the opposition party nominee during that party’s primaries (OPPVP) costs the incumbent party’s candidate 2.5% of the popular vote. For instance, a vote share of 36% for Donald Trump during the GOP primaries in Ohio only costs Hillary Clinton 1.8% of the popular vote, all else being equal.
Forecasting and Discussion
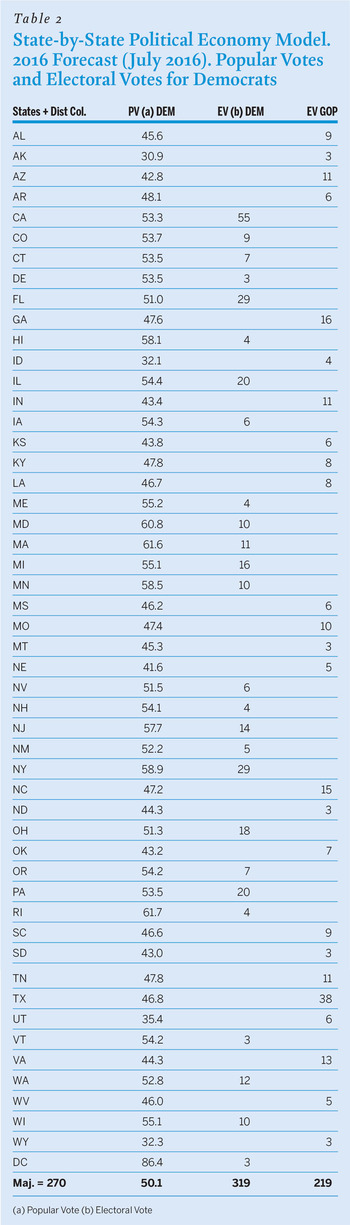
The 2016 pre-election values have been plugged into the model in order to predict the popular votes in each state. Table 2 shows the incumbent state-by-state vote share forecasts. The forecasting model (first created to predict 2004, 2008 and 2012 elections) gives a very narrow absolute majority for the Democrats with 50.1% of the popular vote (-1% compared with 2012) and 319 EVs (- 13 compared with 2012). This simulation shows a slight decrease in the popular vote (-0.2) from our previous forecast calculated in March 2016.
State-by-State Political Economy Model. 2016 Forecast (July 2016). Popular Votes and Electoral Votes for Democrats

(a) Popular Vote (b) Electoral Vote
Thus, if the elections were held in September 2016, the Democrats would obtain a majority of the popular vote in 26 states (-1 compared with 2012 and -3 compared with 2008). According to the model, the Republicans would only regain Virginia (13 EVs).
How do we explain such a result when compared to 2012? With regard to aggregated PV, the economic situation is not the same. In addition, current president’s credibility is rather high (52% were satisfied with his performance in April 2016, Gallup USA Today) when compared with his own approval rating in March 2012 (when 46% were satisfied). However, Hillary Clinton is not the outgoing president and will not profit from the maximum bonus that she could expect.
The translation into votes with PJA0 highlights an average electoral loss of 3.6 points per state compared to the exact same calculation with PJA2 Footnote 9 (credibility when the current president is not outgoing). Such a gap erodes dramatically what is gained thanks to good economic situation (measured by a favorable change in unemployment).
Otherwise, the estimated coefficients for the PPI indexes (PPI5212 and PPI8012) do not differ significantly from those of our 2012 forecast, showing a near status quo in partisan patterns since 2008. This demonstrates that Hillary Clinton’s insufficient popularity bonus prevents her to be clearly above the 50% bar.
When looking at our EV forecast, Hillary Clinton leads by 100 EVs over Donald Trump. As a consequence, how is it that the forecast is robust enough at a national level but not overall state-by-state? More specifically, are certain swing states still able to change the expected result?
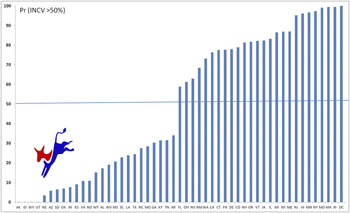
As a check, we have calculated the probability for the Democrats of attaining an absolute majority of the votes given that our model produced a -4.64 point margin of error in each state. The results are shown in figure 1.
Probability to achieve an absolute majority of the votes cast in States for Democrats

According to the probabilities, the Democrats have absolutely no chance of winning an absolute majority in 25 states, which would have netted them 219 EVs (probability below 35%). At the opposite end of the spectrum, they have a strong chance of winning in 25 states (plus DC), totaling 309 EVs (probability above 58%). This result seems to provide a sufficiently safe margin for the Democrats. Nevertheless, what would occur if we tighten the conditions by pushing probability of reaching an absolute majority up to 73%?
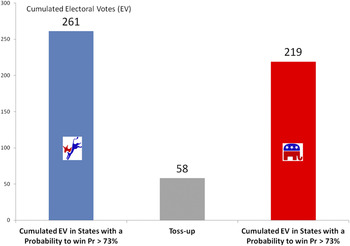
Figure 2 suggests that the Democrats could count on an electoral base of 261 EVs versus 219 for GOP. As a consequence, four states become toss-ups, representing 58 EVs (FL, OH, NM and NV). In such a situation, only FL, OH, NM and NV are the most “fragile” states for Democrats. However, at worst, Hillary Clinton would have to pick nine EVs among the four remaining states to become the 45th President of the United States.
Notwithstanding unforeseen shocks, Hillary Clinton’s chances of victory seem to be solid in terms of EVs. But one must expect a close competition in terms of PV.
Probability to achieve an absolute majority exceeding 73% of the votes cast (cumulated Electoral Votes)

The above results and our forecast clearly suggest that improvement in the economy had real local effects in numerous key states during Obama’s second term. A second parameter seems to play a noticeable role in the forecast, which is the division among the Republicans.
As we have pointed out, Donald Trump has been the least supported nominee at the GOP primaries in four decades. In the Cleveland GOP convention, Donald Trump won, but with the most delegates opposed to his nomination since 1976.
Undoubtedly, Hillary Clinton should take this opportunity to win. Notwithstanding unforeseen shocks, Hillary Clinton’s chances of victory seem to be solid in terms of EVs. But one must expect a close competition in terms of PV.
In this respect, a last unknown factor exists: are independent candidates Gary Johnson (Libertarian) and Jill Stein (Green) going to run? Our state-by-state model shows that for each one percentage point gained by an independent candidate, the incumbent loses 0.73. In July 2016, pollsters predict on average 8.5% for Johnson and 4% for Stein, meaning that the main candidates will be penalized. In the end, independent candidacies may add a little more uncertainty in determining who is going to win the popular vote but not about the identity of who will win the next presidential election in the United States.
APPENDIX: Specification of Additional Explanatory Variables
INDV: vote share for the Independent or Green candidates who had a real “nuisance” power for the incumbents (0 otherwise). [John Anderson Independent candidate in 1980, Ross Perot in 1992 and 1996, and Ralph Nader in 2000]. This variable shows that one point gain in votes for Independent/Green candidates costs 0.73% points to the incumbent (whichever party he may be from).
OPPVP : opposition nominee vote share at primaries. This variable shows that one point gain in votes for opposition Nominee costs 0.05% points to the incumbent.
Dummy variables scored 1 (0 otherwise) measuring significant home state advantage: GA80 Georgia in 1980 for Jimmy Carter, AR92 Arkansas in 1992 for Bill Clinton, AR96 Arkansas in 1996, HI08 and HI12 Hawaii for Barack Obama in 2008 and 2012.
RHSC and DHSC: dummy variables scored 1 in order to take into account states where Republicans R or Democrats D have systematically high scores (0 otherwise).
DLSC: dummy variable scored 1 in order to code states where Democrats have systematically low scores (0 otherwise). This variable is not significant for Republicans.
DCDS and DCRS: dummy variable scored 1 in District of Columbia when Democrats D or Republicans R are incumbents (0 otherwise).
UT08: in 2008 in the Republican stronghold of Utah, McCain competed against five candidates who gathered almost 24% of the total vote share. This variable is scored 1 in 2008 (0 otherwise).
VT04 is outlier: dummy variable scored 1 (0 otherwise) for Vermont in 2004.