Implications
Overfeeding of amino acids to broilers may increase nitrogen excretion and impose rearing cost resulting in environmental issues and economic losses, whereas underfeeding of nutrients such as essential amino acids (EAA) may result in poor performance and harms profitability. Therefore, precise estimation of nutrient requirements in modern poultry enterprises would be of utmost importance for producers and ecosystem. As the early growth pattern of breast muscle would affect the final performance of the bird, the optimal levels of EAA resulting from this study may improve the subsequent growth of the bird at later stages of production.
Introduction
In poultry production, the main goal of feeding program is maximizing profit through the feed formulation providing bird requirements as perfect as possible. Nowadays, the meat bird performance increasingly means optimizing eviscerated and breast meat yield rather than maximizing BW gain or minimizing feed conversion ratio (FCR). The growth and development of breast muscle is more sensitive to nutrition than management factors. It has been well documented that dietary levels of lysine (Lys) (Hickling et al., Reference Hickling, Guenter and Jackson1990; Kidd et al., Reference Kidd, Corzo, Hoehler, Kerr, Barber and Branton1997; Kerr et al., Reference Kerr, Kidd, Halpin, McWard and Quarles1999), methionine (Met) (Hickling et al., Reference Hickling, Guenter and Jackson1990; Kalinowski et al., Reference Kalinowski, Moran and Wyatt2003) and threonine (Thr) (Kidd et al., Reference Kidd, Corzo, Hoehler, Kerr, Barber and Branton1997 and Reference Kidd, Kerr and Anthony2004) greatly influence the breast meat yield. Among muscle tissues, the breast muscle seems to be most sensitive to Lys deficiency in young chicks and this deficiency may increase the fractional rate of proteolysis in this muscle than in the liver (Tesseraud et al., 1996). The reason of this specific sensitivity might be related to the effects of genetic selection on differential growth of breast muscle throughout the past decades (Tesseraud et al., 1999).
Much of previous works investigated the effects of single nutrient (e.g. amino acid) on the growth of breast muscle at a time and ignoring the interactive effects of amino acids for optimizing the product. Possibly the scanty of data for amino acid interactions on processing yields may be related to the limitation of factorial designs and intricate relationships between independent variables. In this experiment, response surface methodology (RSM) was used to address the potential interactions between the first, second and third EAA on breast mass (BM) and leg mass (LM) production in broiler chicks; and optimizing dietary levels of these amino acids for maximizing processing yields at the starter period.
Material and methods
Bird management and experimental design
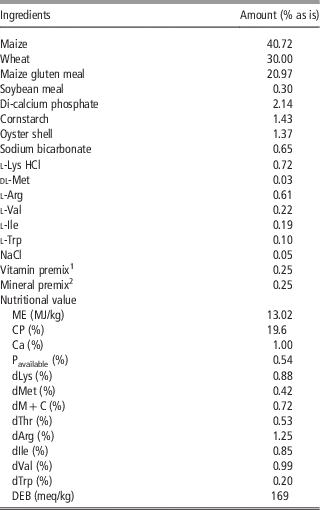
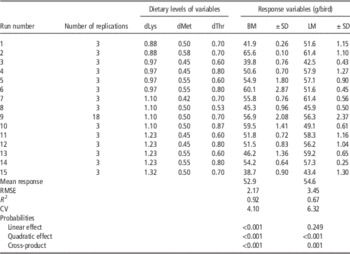
The 361-day-old male broilers (Ross 308) were distributed into 60 floor pens with similar average weights (46±3 g). A basal diet consisting of corn, wheat, soybean meal and corn gluten meal with the lowest levels of the amino acid to be studied was formulated (Table 1). Five different levels of each tested nutrient (Lys, Met and Thr) were used to produce 15 central composite design (CCD) diets (Table 2). Treatment additions of dl-Met, l-Lys HCl and l-Thr were made at the expense of cornstarch to create the experimental diets. The ingredients were analyzed for CP and amino acid contents before feed formulation (Fontaine et al., Reference Fontaine, Hörr and Schirmer2001 and Reference Fontaine, Schirmer and Hörr2002) and standardized ileal digestible amount of each EAA was estimated using calibration data set of near IR spectrophotometry in Degussa, Germany. Metabolizable energy, calcium, available phosphorus, sodium, potassium and chloride contents of feed ingredient were obtained from National Research Council (1994).
Composition of basal diet

ME=metabolizable energy; DEB=dietary electrolyte balance.
1 Vitamin premix provides per kilogram of diet: vitamin A, 4500 IU; vitamin D3, 2250 IU; vitamin E, 50 IU; thiamin HCl, 15 mg; riboflavin, 15 mg; nicotinic acid, 50 mg; folic acid, 6 mg; pyridoxine, 6 mg; biotin, 0.6 mg; vitamin B12, 0.02 mg; choline Cl, 2500 mg; d-calcium pantothenate, 20 mg; menadione sodium bisulfite, 1.5 mg; butylatedhydroxytoluene, 100 mg; glucose to make, 12 g.
2 Mineral premix provides per kilogram of diet: Mn (from MnSO4·H2O), 65 mg; Zn (from ZnO), 55 mg; Fe (from FeSO4·7H2O), 50 mg; Cu (from CuSO4·5H2O), 8 mg; I (from Ca (IO3)2·H2O), 1.8 mg; Se, 0.30 mg; Co (from Co2O3), 0.20 mg; Mo, 0.16 mg.
Experimental design used in response surface study with three independent variables and corresponding broiler response values for breast mass (BM) and leg mass (LM)

dLys=digestible lysine; dMet=digestible methionine; dThr=digestible threonine; RMSE=root mean square error.
Sample preparations
At 16 days of age, three birds of each experimental unit were randomly selected, individually identified and then slaughtered to measure carcass components including BM (boned skinless breast muscle) and LM (thigh plus drumstick portions).
Statistical analysis
In this study, three-factor five-level CCD was used (Mehri et al., Reference Mehri, Davarpanah and Mirzaei2012). In CCD platform, factorial points provide an estimation of linear main and all interaction effects; axial points enhance estimates of quadratic effects; and central points estimate the pure error in a lack of fit test (Montgomery, Reference Montgomery2008).
The mean of each pen was used as experimental unit in statistical analyses. The experimental data obtained by CCD were fitted to the second-order polynomial equation using RSREG procedure in SAS software (SAS, 2002):
 $$y=\beta _{0} {\plus}\mathop{\sum}\limits_{i=1}^k {\beta _{i} x_{i} {\plus}\mathop{\sum}\limits_{i\lt j} {\mathop{\sum}{\beta _{{ij}} x_{i} x_{j} {\plus}\mathop{\sum}\limits_{i=1}^k {\beta _{{ii}} x_{i}^{2} } } } } $$
where y is the response of interest (BM or LM), β 0 the intercept, and β i , β ii and β ij the coefficients estimated by the model. The procedure RSREG calculates the linear transformation to perform the coding of variables by subtracting average of highest and lowest values of the independent variable from the original value and dividing by half of their differences as follows:
 $${\rm Coded}\,{\rm value=(original}\,{\rm value}\,{\minus\,}M)/S$$
where M is the average of the highest and lowest values for the variable in the design and S half of their difference (Box and Draper, Reference Box and Draper2007). A ridge analysis was used to compute the optimal response for BM and LM maximization using RIDGE MAX option in SAS software (SAS, 2002). Ridge analysis can be used as a tool to help interpret an existing response surface or to indicate the direction in which further experimentation should be performed.
The absolute t-value of model parameters and eigenvalues were used to ranking independent variables according to their importance in the RSM models (Mehri et al., Reference Mehri, Davarpanah and Mirzaei2012). A more important model term has a higher absolute t-value. Thus, the input variables may be ranked in the order of their importance using those statistical parameters (SAS, 2002). In addition, the elements of the eigenvectors can provide the important information about the relationships of the predictors to the response. The larger an eigenvalue is in absolute value, the more pronounced is the curvature of the response surface in the associated direction (Box and Draper, Reference Box and Draper2007).
Results
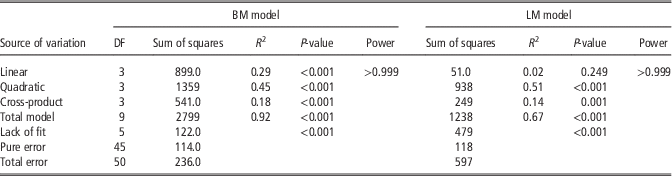
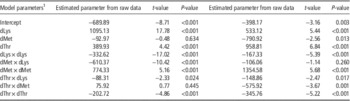
The first attempt on RSM modeling was to develop an empirical model to describe the growth of breast and leg muscles over a wide range of dietary contents of the first three EAA. ANOVA showed that linear, quadratic and interaction of EAA were statistically significant on BM and LM attributes (Table 3). As shown in Table 4, the main effect of digestible Met (dMet) and interactive effects between dMet and digestible Thr (dThr) were not significant for BM model; and on the other hand, the interaction effect of dMet and digestible Lys (dLys) was not significant for LM model. Canonical analyses indicated that the stationary points for BM and LM models were saddle points, so ridge analysis was performed to estimate the optimal values for independent variables (Box and Draper, Reference Box and Draper2007).
ANOVA on the experimental results along with contribution of model terms to the statistical fit in response surface models for breast mass (BM) and leg mass (LM)

Estimated parameters of second-order response surface model for breast mass (BM) and leg mass (LM)

1 Dietary levels of standardized ileal digestible lysine (dLys), methionine (dMet) and threonine (dThr).
The experimental design and corresponding responses to dietary inputs are given in Table 2. To develop RSM models, the RSREG procedure estimated the model parameters by least squares regression and second-order polynomial equations from raw experimental data for BM (R 2=0.92; root mean square error=2.17) and LM (R 2=0.69; root mean square error=3.45) were successfully generated as follows (SAS, 2002):
 $$\eqalignno{ {\rm BM}\,{\rm (g}/{\rm bird)}=\,& {\minus}{\rm 689}.{\rm 89}{\plus}{\rm 1}0{\rm 95}.{\rm 13}\,{\rm (dLys)}{\plus}{\rm 389}.{\rm 93}\,{\rm (dThr)}\cr {\rm } &-{\rm 332}.{\rm 62}\,{\rm (dLys}{\times}{\rm dLys)}-{\rm 61}0.{\rm 37} ({\rm dMet}{\times}{\rm dLys})\cr {\rm } &{\plus}{\rm 774}.{\rm 33}\,{\rm (dMet}{\times}{\rm dMet)}\cr {\rm } &-{\rm 88}.{\rm 31}\,{\rm (dThr}{\times}{\rm dLys)}-{\rm 2}0{\rm 2}.{\rm 72}\,{\rm (dThr}{\times}{\rm dThr)},\,{\rm and} $$
 $$\eqalignno{ {\rm LM}\,{\rm (g}/{\rm bird)}= \,& {\minus}{\rm 398}.{\rm 17}{\plus}{\rm 533}.{\rm 12}\,{\rm (dLys)}-{\rm 79}0.{\rm 92}\,{\rm (dMet)} \cr & {\plus}{\rm 958}.{\rm 81}\,{\rm (dThr)}-{\rm 167}.{\rm 33} \,{\rm (dLys}{\times}{\rm dLys)}\cr {\rm } &{\plus}{\rm 1354}.{\rm 58}\,{\rm (dMet}{\times}{\rm dMet)}-{\rm 148}.{\rm 86}\,{\rm (dThr}{\times}{\rm dLys)}\cr {\rm } &{\plus}{\minus}{\rm 575}.{\rm 92}\,{\rm (dThr}{\times}{\rm dMet)}-{\rm 345}.{\rm 76}\, ({\rm dThr}{\times}{\rm dThr}) $$
Optimization of BM and LM models
The optimization of the models was performed by ridge analysis to reach maximum BM and LM in broiler chicks. The results showed that the maximum BM may be achieved by 0.58%, 1.05% and 0.76% of dMet, dLys and dThr, respectively, in diet. The maximum LM may be obtained with 0.58%, 1.09% and 0.64% of dMet, dLys and dThr, respectively, in diet.
Sensitivity analysis of BM and LM models
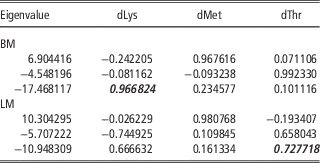
ANOVA showed that the quadratic regression had the highest contribution on the BM (partial R 2=0.45) and LM (partial R 2=0.51) responses (Table 3). The estimated model parameters along with t-value of each model components are shown in Table 4. The extent of absolute t-value (ǀt-valueǀ) for each model parameter may indicate the contribution of each term to the statistical fit. Therefore, the greater the magnitude of absolute t-value, the more significant the corresponding coefficient (Ahmadi and Golian, Reference Ahmadi and Golian2011; Mehri et al., Reference Mehri, Davarpanah and Mirzaei2012). In terms of BM, the linear (ǀt-valueǀ=17.78) and quadratic (ǀt-valueǀ=17.02) effects of dietary dLys had the largest contribution on the breast meat response in chicks, followed by interaction between dietary dLys and dMet. The canonical coefficients also confirm the results of ANOVA (Mehri et al., Reference Mehri, Davarpanah and Mirzaei2012). In Table 5, the last eigenvalue (−17.468117) was the largest in magnitude. For the corresponding eigenvector, the primary component was Lys, with a value of 0.966824. Therefore, the most important variable in the fitted model was Lys, and the greatest curvature at the stationary point resulted from moving the model in either direction determined by the Lys. The coefficient estimates for LM and corresponding absolute t-value revealed that the linear effect of dietary dThr had the largest contribution on the model, followed by quadratic effect of dMet. All quadratic terms in the BM and LM models were also found to be important (Table 4). In terms of LM, the last eigenvalue (−10.948309) was the largest in magnitude. For the corresponding eigenvector, the primary component was Thr, with a value of 0.727718. Therefore, the most important variable in the fitted model was Thr, and the greatest curvature at the stationary point resulted from moving the model in either direction determined by the Thr.
Eigenvectors of independent variables for breast mass (BM) and leg mass (LM)

dLys=digestible lysine; dMet=digestible methionine; dThr=digestible threonine.
The highest eigenvalue of the variable in the greatest eigenvector indicates the most important variable describing the most variation in the model.
Discussion
So far, most researchers used single dose–response studies to establish the nutritional requirements of EAA in poultry (Han and Baker, Reference Han and Baker1994; Baker et al., Reference Baker, Batal, Parr, Augspurger and Parsons2002; Kidd et al., Reference Kidd, Kerr and Anthony2004; Dozier et al., Reference Dozier, Corzo, Kidd, Tillman and Branton2009; Mehri et al., Reference Mehri, Nassiri-Moghaddam, Kermanshahi and Danesh-Mesgaran2010). In such experiments, the single nutrient input approach and simple regression does not completely take into account the basic knowledge behind nutrition including intricate relationships between amino acids (De Leon et al., Reference De Leon, Kidd and Corzo2010; Mehri et al., Reference Mehri, Davarpanah and Mirzaei2012). Although traditional factorial designs can be used to test interactions among dietary nutrients (Hickling et al., Reference Hickling, Guenter and Jackson1990; Kidd et al., Reference Kidd, Corzo, Hoehler, Kerr, Barber and Branton1997), such factorial designs cannot efficiently identify curvature among multiple independent variables. Therefore, optimal experimental designs should be employed to model these curvatures to define a combination of dietary amino acids describing the most desirable response in growth rate (De Leon et al., Reference De Leon, Kidd and Corzo2010). In this regard, Shearer (Reference Shearer2000) stated that three fundamental elements in dose–response experiments are responsible for large variation in estimated nutritional requirements among different studies. These factors are design of experiment, data collection and selection model for statistical analysis. Therefore, from the point of statistics, by moving from single regression to surface response models, the experimental designs such as CCD (Mehri et al., Reference Mehri, Davarpanah and Mirzaei2012) and Box–Behnken design (De Leon et al., Reference De Leon, Kidd and Corzo2010) will emerge to address multiple amino acid interactions.
The most important point revealed in this report is the different interactive effects of dLys and two other amino acids in BM and LM models. The interaction effects of dLys×dMet was significant for BM model, whereas the interaction effects of dLys×dThr was significant for LM model. Hickling et al. (Reference Hickling, Guenter and Jackson1990) and Kidd et al. (Reference Kidd, Corzo, Hoehler, Kerr, Barber and Branton1997) also found the significant effects of dLys×dMet for optimizing carcass yield. However, the significant effects of dLys×dThr for optimizing thigh meat yield has been reported (Kidd et al., Reference Kidd, Corzo, Hoehler, Kerr, Barber and Branton1997). It has been shown that high feeding dLys without considering the dietary levels of dMet and dThr might suppress the carcass yield and breast fillet yield (Kidd et al., Reference Kidd, Corzo, Hoehler, Kerr, Barber and Branton1997). The response surface analysis showed that the main effect of dMet was not significant for BM model, although the main effect of dLys is threefold higher than the main effect of dThr. It was observed that the highest factor interaction effects in this case exist between the dLys and dMet, which was in line with Hickling et al. (Reference Hickling, Guenter and Jackson1990) and Kidd et al. (Reference Kidd, Corzo, Hoehler, Kerr, Barber and Branton1997). However, in the case of LM model, the main effect of dThr was higher than the main effect of dMet (1.2-fold) and dLys (1.7-fold), and the highest factor interaction effects exist between dThr and dMet. During starter period, Labadan et al. (Reference Labadan, Hsu and Austic2001) reported that dLys requirements of starting broilers for maximum breast meat yield is 1.24% of diet. Lys is the reference amino acid in ideal protein concept and in this study, the optimal dLys was estimated at 1.05% of diet for maximum BM, which was lower than that reported by Labadan et al. (Reference Labadan, Hsu and Austic2001). The lower estimated value in this study may be related to the statistical method for data analysis and taking into account the effects of two other amino acid in the models (Pesti et al., Reference Pesti, Vedenov, Cason and Billard2009). As Leclercq (Reference Leclercq1998) stated Lys deficiency specifically reduces pectoralis major growth; these muscles having Type IIb fibers. In contrast, proportions of sartorius and anterior latissimus dorsi, which contain both Type I and IIb fibers, were less influenced by Lys. Moreover, Moran and Bilgili (Reference Moran and Bilgili1990) demonstrated that the proportions of breast and thigh increased with Lys at the expense of back both on a raw and a cooked basis. It should be noted that the Lys level of the diet may increase the breast quantity as well as breast meat quality but the Lys requirement for improving breast quality may be higher than that for breast meat yield (Berri et al., Reference Berri, Besnard and Relandeau2008). Based on sensitivity analysis in the present study, one can see that dThr had less effect on BM in comparison with dLys and dMet. Leclercq (Reference Leclercq1998) also noted that the effect of Thr deficiency on BM yield was less pronounced than that of Lys deficiency.
The resultant ideal ratios for dMet and dThr were estimated at 55% and 72% for BM; and 53% and 64% for LM (Table 6). Comparing the results of this experiment with those obtained by Mehri et al. (Reference Mehri, Davarpanah and Mirzaei2012) revealed that the ideal ratio of dMet to dLys for optimizing carcass yields (e.g. breast and leg meat yields) might be higher than that needed for growth performance (e.g. BW gain and FCR).
Optimal levels of independent variables for maximum ridge response of breast mass (BM) and leg mass (LM)

1 Dietary levels of standardized ileal digestible lysine (dLys), methionine (dMet) and threonine (dThr).
In conclusion, application of appropriate design and statistical analysis provide better insight about the combinational effects of amino acids on the bird responses. In addition, the non-linear behavior of economical traits of broiler such as breast muscle accretion could be clearly unfolded using multivariate optimization. In order to examine this procedure to study the carry-over effects of dietary amino acids on the growth of breast and leg muscles, further studies would be warranted.
Acknowledgements
The authors acknowledge the support of Mr Ali Afsar (Degussa, Germany) for providing the essential amino acids in this experiment and also thank Dr Ariane Helmbresht (Degussa, Germany) for her kind assistance during the research.