INTRODUCTION
The cestode Echinococcus multilocularis causes alveolar echinococcosis (AE), a mainly hepatic disease with an impact of 666′434 DALYs (disability-adjusted life-years) (Torgerson et al. Reference Torgerson, Keller, Magnotta and Ragland2010). AE is an emerging disease (Gottstein et al. Reference Gottstein, Stojkovic, Vuitton, Millon, Marcinkute and Deplazes2015) and is considered to be the most deadly of all helminthic infections. Echinococcus multilocularis infects natural intermediate hosts, mainly rodents, but also aberrant hosts such as primates (including humans) and dogs (Conraths and Deplazes, Reference Conraths and Deplazes2015), and thus represents a dangerous problem for human and veterinary health. Infection of natural and aberrant intermediate hosts takes place by the ingestion of E. multilocularis eggs. Upon passage through the stomach, the eggs release an oncosphere larva, which disseminates and migrates preferentially to the liver and develops into a metacestode. This disease-causing stage is characterized by numerous small parasitic vesicles in the affected organ, primarily in the liver, and vesicles proliferate and expand into the surrounding host tissue similar to malignant tumours, eventually also forming protoscolices, and metastases at more distant locations. The most common symptoms of AE include abdominal pain, jaundice, hepatomegaly, fever, anaemia, weight loss, pleural pain and finally death (Eckert and Deplazes, Reference Eckert and Deplazes2004).
Once abdominal symptoms occur in humans and companion animals, monitoring by ultrasound (US) is usually the first diagnostic step. US is also applied for screening purposes, since it is relatively inexpensive, easily available, and there is no ionizing radiation applied (Liu et al. Reference Liu, Delabrousse, Blagosklonov, Wang, Zeng, Jiang, Wang, Qin, Vuitton and Wen2014). US can be further complemented by computed tomography (CT) and magnetic resonance imaging (MRI) (Reuter et al. Reference Reuter, Nüssle, Kolokythas, Haug, Rieber, Kern and Kratzer2001). For individuals suffering from AE, complete resection of the total metacestode mass is, in theory, the best option for treatment. However, as the parasite grows infiltrative and forms metastases, total resection can be difficult to achieve, and surgery combined with chemotherapy, or chemotherapy alone, remain as the preferred options in many cases. The only chemotherapeutical treatments available today rely on albendazole (ABZ) and mebendazole, two benzimidazoles. However, these drugs act parasitostatic and prevent further parasite proliferation, but do not exert parasiticidal activity (Hemphill et al. Reference Hemphill, Stadelmann, Rufener, Spiliotis, Boubaker, Müller, Müller, Gorgas and Gottstein2014). In addition, due to the daily and life-long application in patients, their corresponding metabolites have to be monitored periodically, treatment regimens have to be adjusted periodically, and adverse effects have been reported, resulting in complete discontinuation of treatment due to severe liver toxicity in a fraction of patients. Thus, new and truly parasiticidal treatment options are urgently needed (Hemphill et al. Reference Hemphill, Stadelmann, Rufener, Spiliotis, Boubaker, Müller, Müller, Gorgas and Gottstein2014).
An advantage of E. multilocularis over other cestode models is given by the fact that rodents represent natural intermediate hosts for E. multilocularis. The secondary infection model with metacestode vesicles growing in the peritoneal cavity of mice, as well as eventually also in the liver, has been most widely used for the study of drugs against AE over the last decades. Standardization of this model was achieved by infecting animals with in vitro cultured metacestodes, and refinement of drug treatment procedures included oral application of compounds emulsified in honey as opposed to application by gavage (Küster et al. Reference Küster, Zumkehr, Hermann, Theurillat, Thormann, Gottstein and Hemphill2012). However, monitoring of intraperitoneal parasite growth in real time, without sacrificing the animal, is not possible. Quantitative assessments of parasite weight are only possibly after euthanasia of the animal, leaving no option for dosage adjustments or early discontinuation of a trial (Hemphill et al. Reference Hemphill, Stadelmann, Rufener, Spiliotis, Boubaker, Müller, Müller, Gorgas and Gottstein2014). Moreover, assessments of parasite viability based on parasite weights might be skewed due to host connective tissue encapsulating the parasite (Hemphill et al. Reference Hemphill, Stadelmann, Rufener, Spiliotis, Boubaker, Müller, Müller, Gorgas and Gottstein2014). In addition, highest care has to be taken when removing the metacestode tissue from the peritoneal cavity, in order not to rupture cysts and thereby affect the parasite weight.
US is a well-established non-invasive imaging method that enables visualization of abdominal pathologies, and has been used to assess hepatic changes in rats infected with E. multilocularis (Zeng et al. Reference Zeng, Wang, Xie, Liu and Wen2012). US allows serial examinations and has also been applied to monitor response to therapy of a variety of diseases, also in murine models. So far, there are no reports on the use of US to monitor treatment responses in the model of secondary AE. The aim of this study was to assess the usefulness of US in the evaluation of metacestode growth in the murine model, and to develop a methodology for assessing the efficacy of treatments with the two therapeutics ABZ and mefloquine (MEF) (Küster et al. Reference Küster, Stadelmann, Rufener, Risch, Müller and Hemphill2015). Furthermore, as alternative to the gold standard of post-mortem metacestode cyst weight determination, we evaluated MRI as a tool to determine parasite burden. The basic treatment regime and effects of the drugs applied within this study are not further discussed here, as the data was published and extensively discussed in (Küster et al. Reference Küster, Stadelmann, Rufener, Risch, Müller and Hemphill2015).
MATERIALS AND METHODS
Echinococcus multilocularis parasite material
Parasite maintenance and in vitro culture was performed as described previously by (Stadelmann et al. Reference Stadelmann, Aeschbacher, Huber, Spiliotis, Müller and Hemphill2014).
BALB/c infection and treatment
Fifteen female BALB/c mice (mean body weight 25 g, 9 weeks old) were housed in a temperature-controlled daylight/night (12 h/12 h) cycle room with free access to food and water. The experiment was carried out according to the Swiss Federal Animal Welfare regulations (TschV, SR 455). It was performed as described in Küster et al. (Reference Küster, Stadelmann, Rufener, Risch, Müller and Hemphill2015) and in short was as follows: all mice were intraperitoneally infected with 200 µL in vitro of cultured E. multilocularis metacestode material in PBS (ratio 1:1) and subsequently divided into three groups (I, II and III) of five animals. Six weeks post-infection, all mice were treated 5 days/week by per oral gavage of the control [100 µL honey/1% carboxymethylcellulose (CMC)] to group I, ABZ (200 mg kg−1 in 100 µL honey/1% CMC) to group II or MEF (different concentrations from 12·5 mg kg−1 to 200 mg kg−1 in honey/1% CMC) to group III. More detailed information on the treatment regime is available in (Küster et al. Reference Küster, Stadelmann, Rufener, Risch, Müller and Hemphill2015). During the course of treatment, all mice were carefully monitored for adverse side-effects and parasite growth was assessed over the time by periodic US monitoring (see below). After a treatment duration of 11 weeks, all mice were sedated by isoflurane, euthanized by CO2 and the total volume of parasite mass determined by MRI (see below). Subsequent to necropsy, the final parasite weight was determined as stated and shown in (Küster et al. Reference Küster, Stadelmann, Rufener, Risch, Müller and Hemphill2015).
Monitoring of E. multilocularis parasite growth in BALB/c mice by US
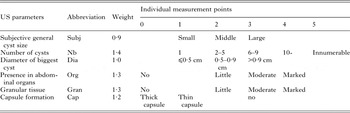
US examinations were performed using routine diagnostic US equipment (ProSound Alpha 10, Hitachi Aloka Medical). Each mouse was picked up in the palm of one hand, and a small area of the abdominal fur was shaved with an electric shaver. Contact gel was gently applied, and the abdomen was scanned with a linear transducer 7·5 – 13 Mhz. US examinations were performed prior to infection to exclude abnormalities, and 6 weeks post-infection to confirm the presence of the parasite. Serial examinations were performed on days 9, 23, 37, 57 and 78 after treatment started. US examinations were all performed by the same person, who was not aware of the daily treatment regime. In order to assess the burden of parasite growth for each mouse, the following parameters were evaluated: (i) subjective general cyst size of all cysts (small, middle and large), (ii) number of cysts, (iii) diameter of biggest cyst in cm, (iv) presence of cysts within abdominal organs, (v) presence of granular tissue and (vi) capsule formation. In order to summarize the different US parameters, a scoring sheet was developed assigning the findings of each US parameter to a score (see Table 1).
US scoring sheet

The first column shows the various parameters assessed by US examination of intraperitoneally infected and subsequently treated Balb/c mice. The second column shows respective abbreviations and the third column shows the weighting applied for each parameter for further analyses. The top line indicates the respective points that were given for each parameter. For every mouse and every time point, a total score was calculated by the sum of all the weighted individual points.
Endpoint assessment of parasite volume by MRI
After 78 days of treatment, all mice were sedated by isoflurane, euthanized by CO2 and post-mortem MRI was performed using a 1·0 Tesla magnet (Panorama HFO, Philips Medical Systems). Each mouse was positioned in sternal recumbency in a human wrist coil. To calculate the cyst volume a three-dimensional (3D) T2 weighted fat suppressed sequence (echo time: 140 ms, repetition time 4000 ms, slice thickness 1·4 mm, interslice gap 0·7 mm) in dorsal plane from nose to tail of the mouse was performed. Threshold volume segmentation was done with MIPAV (Medical Image Processing, Analysis and Visualization v7·3·0.).
Subsequent to MRI scanning, mice underwent necropsy and the parasite material was resected and weighed as stated above.
Statistical analyses
Principal component analysis (PCA) and PCA-regression (Zuur et al. Reference Zuur, Ieno and Smith2007) were applied to assess the relationship between US scoring parameters, using data from the end time point only. The weighting of each parameter was adapted according to the principal components (PCs) that separated the different treatment groups best. Then the total US score was calculated as the sum of the weighted scores of each parameter.
The evolution of the US score over time was analysed by linear mixed model (Pinheiro and Bates, Reference Pinheiro and Bates2000) using the following formula:
 $$\eqalign{y_{ij} & = \alpha + \; \beta _1 {\rm time}_{ij} + \; \beta _2 {\rm group}_{ij} + \; \beta _3 {\rm time}_{ij} \times {\rm group}_{ij} \cr & \quad + a_j + \varepsilon _{ij} }$$
where index j represents each mouse, and index i represents each measurement on a mouse. Response variable y ij is the total weighted US score of mouse j at time i. β n are the regression coefficients and α is the intercept. The variable time is the number of days post-treatment start, centred on the mean. The nominal variable group represents each treatment group. The interaction term time × group allows the effect of time to vary across treatment groups. To account for unexplained variability among mice, a random factor a j was included. A variance structure was also included to the error term ε ij , to account for heteroscedasticity. Model fit was assessed by inspection of the residuals.
Differences in total score between treatment groups were assessed by ANOVA according to Welch (i.e. not assuming homoscedasticity) for each time point and followed by pairwise t-test comparison without using pooled standard deviation (Dalgaard, Reference Dalgaard and Dalgaard2008).
The relationship between the cyst weight and cyst volume at 78 days of treatment was assessed by Pearson's correlation coefficient. Similarly, the relationship between these both measurements and the total weighted score was also assessed by correlation coefficient.
Variabilities of cyst weight, cyst volume and total score (all at 78 days of treatment) were assessed by measuring the relative standard deviation (i.e. the standard deviation divided by the group average) for each combination of measure and treatment group. Confidence intervals for the relative standard deviations were determined by bootstrapping using 10 000 replications.
All statistical analyses were performed with the R software [version 3.2.3; (R Core Team, 2015)] with the additional packages ‘nlme’ [version 3.1-125; (Pinheiro and Bates, Reference Pinheiro and Bates2000), ‘ade4’ (version 1.7-3; (Dray and Dufour, Reference Dray and Dufour2007) and ‘boot’ (version 1.3-1·8; (Canty and Ripley, Reference Canty and Ripley2016)]. The level of significance was set to P < 0·05.
RESULTS
US-based assessment of parasite growth in the live animal over time
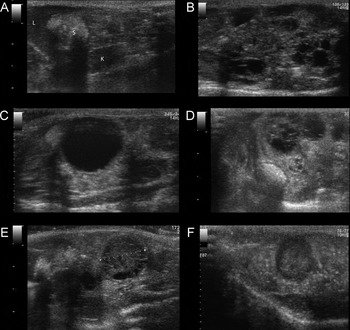
As visualized by an initial US examination, none of the mice showed any abnormalities in the peritoneal cavity. Prior to the start of treatment at 6 weeks post-inoculation, infection was confirmed in all mice by another US examination. No adverse effects were observed, with the exception of week 5, when the dosage of MEF was elevated to 200 mg kg−1 and one mouse died. Subsequent lowering of the dosage led to no further deaths or clinical side-effects (Küster et al. Reference Küster, Stadelmann, Rufener, Risch, Müller and Hemphill2015). The assessment of parasite growth by US did not change the behaviour of the mice over the course of the experiment. All mice accepted the routine assessment by US and did not show any signs of stress during the procedure. Figure 1 shows representative examples of US images.
Examples of US images of mice obtained at various timepoints. Longitudinal US images of the abdominal cavity of mouse 1 before infection (A) showing the liver (L), filled stomach (S) and right kidney (K). (B) Example of innumerable small cysts within the peritoneum (mouse 3, day 78), (C) a large cyst with typical distal acoustic enhancement and cyst wall artefact (mouse 2, day 37), (D) complex diffuse changes within the peritoneal cavity with multiple middle sized cysts and granular material (mouse 4, day 78), (E) granular material with multiple small cysts inside (indicated by dotted line, mouse 1, day 57) and (F) granular material without cyst formation and without vascularization (no Doppler signal; mouse 7, day 57).

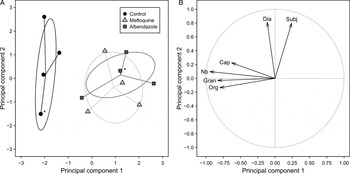
No clear pattern associated to time or treatment group was visible for any of the individual US parameters. On the other hand, PCA demonstrated the presence of a clear separation between the control group and the drug-treated mouse groups (Fig. 2A). This first PC accounted for 44·9% of the total variability and was mainly driven by the following variables: ‘number of cysts’, ‘presence in abdominal organs’, ‘granular tissue’ and ‘capsule formation’ (Fig. 2B). The second PC accounted for 23·0% of the total variability of the data and was mainly driven by the variables ‘subjective general cyst size’ and ‘diameter of biggest cyst’. No clear separation was visible between ABZ- and MEF-treated groups (Fig. 2A).
PCA of the relationship of six US parameters measured on mice infected with E. multilocularis at 78 days post treatment start. (A) Score of each mouse on the first and the second PCs. Symbols indicate different treatment groups. Asterisks mark mice with identical and therefore overlapping PC scores. (B) Correlation circle showing relationship between parameters and PCs (abbreviations see Table 1).

The first PC was the only one to discriminate between the treatment groups (Fig. 2A). Based on the loadings of the first PC, the individual parameters were weighted as follows: subjective general cyst size: 0·9, number of cysts: 1·4, diameter of biggest cyst: 1·0, presence in abdominal organs: 1·3, granular tissue: 1·3, capsule formation: 1·2 (see also Table 1).
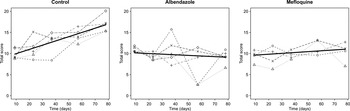
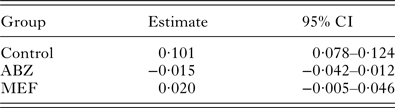
The control group showed a significant increase in total US score over time (Fig. 3, Supplementary Table 1), which was significantly higher than in the ABZ- and MEF-treated groups. The difference in the increase of the total US score over time between both treated groups was close to significance level (P = 0·059) and both did not significantly differ from 0 (Fig. 3, Table 2).
Evolution of US score in mice experimentally infected with E. multilocularis metacestodes. Each panel shows a different treatment group. Each individual mouse is represented by a different symbol and line. The time refers to the number of days after start of treatment. The solid line shows the regression line of the total US score for each treatment group as determined by linear mixed model (Pinheiro and Bates, Reference Pinheiro and Bates2000).

Daily increase of total US score for the three treatment groups

95% confidence intervals (CI) are given.
Comparison of US scores for each time point showed that until 37 days post-treatment start no significant difference was present between all treatment groups (Fig. 3). On day 57 an overall significant difference was detectable (P = 0·027), but pairwise comparison did not show a significant difference between groups, although the control group had a higher total US score than the ABZ-treated group (P = 0·056). At day 78 after start of the treatments, mice of the control group had a significantly higher total US score than mice from both, the ABZ-treated group (P ⩽ 0·001) and the MEF-treated group (P = 0·010), but US scores of both treated groups did not differ significantly from each other (P = 0·434).
Endpoint assessment of parasite growth by US and MRI and correlation to conservative parasite mass determination
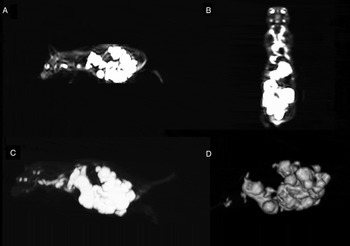
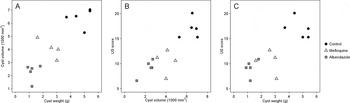
To further validate the US scoring method, we assessed parasite loads in the same mice also by MRI at 78 days post-treatment start, and also measured parasite weights post-mortem. Representative images of these assessments are given in Fig. 4. The comparison of the parasite mass weight to the final cyst volume measured by MRI showed a clear positive correlation with a Pearson correlation coefficient of r = 0·87 [95% confidence intervals (CI) 0·64–0·96; Fig. 5A]. Cyst volume determination by MRI allowed also a clear separation between the treatment groups: control animals had all larger cyst volumes than ABZ- or MEF-treated mice, and mice from the MEF-treated group all had cyst volumes larger than mice from the ABZ-treated group (Fig. 5). Except for one individual, there was also a clear separation between the groups regarding the cyst weights: All control mice had larger cyst weights than mice from treated groups. All MEF-treated mice showed higher cyst weights than ABZ-treated mice, except for the MEF-treated mouse with lowest cyst weight (1·6 g) that was slightly below the ABZ-treated mouse with the highest weight (1·8 g, Fig. 5). Differences in cyst weight and cyst volume were statistically significant between all treatment groups (Supplementary Fig. 1). The final US score also showed a significant correlation to cyst volume (r = 0·86, 95% CI 0·61–0·96, Fig. 5B) and to cyst weight (r = 0·78, 95% CI 0·43–0·93; Fig. 5C).
Post-mortem magnetic resonance images of mouse 5. Sagittal (A) and dorsal (B) slices of a 3D T2 weighted fat suppressed sequence with high signal intensity of the parasitic lesions within the abdominal cavity. (C) Maximum intensity projection of the whole mouse and volume segmentation of the parasitic lesions and (D) 3D reconstruction of the parasitic lesions for volume segmentation.

Relationship between three different methods of E. multilocularis metacestode cyst growth assessment at the endpoint of the study. (A) Relationship between parasite weight and volume (r = 0·87). (B) Relationship between parasite volume and US score (r = 0·86). (C) Relationship between parasite weight and US score (r = 0·78).

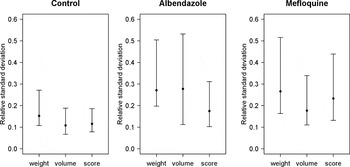
Further, the relative standard deviations were compared between all three methods of final parasite growth assessment. As shown in Fig. 6 (data in Supplementary Table 2), measurements from the control group tended to show smaller relative standard deviations, but did not differ significantly among measurements for each treatment group. The classical cyst weight method was well in the range of the non-invasive imaging methods.
Comparison of relative standard deviations between E. multilocularis metacestode measurements (cyst weight, cyst volume and US score). Error bars show the 95% CI as determined by bootstrapping with 10 000 replications.

DISCUSSION
In human patients, E. multilocularis metacestode development is routinely followed by non-invasive imaging techniques, and more elaborated scoring systems for CT and US in human patients have been published recently (Kratzer et al. Reference Kratzer, Gruener, Kaltenbach, Ansari-Bitzenberger, Kern, Fuchs, Mason, Barth, Haenle, Hillenbrand, Oeztuerk and Graeter2015; Graeter et al. Reference Graeter, Kratzer, Oeztuerk, Haenle, Mason, Hillenbrand, Kull, Barth, Kern and Gruener2016). Ultrasonographic findings in the liver of rats infected with E. multilocularis have also been reported previously (Zeng et al. Reference Zeng, Wang, Xie, Liu and Wen2012). We used US to monitor infection and treatment response to refine the model of secondary AE in mice, which is a frequently used system for the in vivo assessment of potential new drugs against AE.
The scoring of US parameters describing metacestode development in E. multilocularis infected mice proved to be useful. We detected a difference over time between control and treatment groups applying weighted scores that can also be used in future trials. Parasite tissue in untreated mice tended to have less capsule formation, higher cyst numbers, and exhibited granular tissue in abdominal organs more often than in drug-treated mice. Significant changes of the scores were observed at 57 days after treatment start, and later. ABZ- and MEF-treated mice showed no significant variation of the total US score over time. This confirmed that in both groups the cyst burden remained constant over the treatment time, which is in accordance with the previously described parasitostatic effect of these drugs (Küster et al. Reference Küster, Stadelmann, Rufener, Risch, Müller and Hemphill2015). Due to the lack of a truly parasiticidal drug against AE to date, no other drugs were available for the assessment of the US scoring over time with an expected negative slope. The analysis of metacestode growth by US assumed a linear evolution of the total US score over time, which is in contrast to the typically described sigmoid curve of AE growth (Baron et al. Reference Baron, Rau and Tanner1974). The reason for this discrepancy is that the time-window observed within this study excluded the initial lag phase, as well as the diminished parasite growth phase, typically present in a sigmoid growth curve. The lack of pattern in the residuals confirms that the linear approximation was appropriate. A further reason might be that subtle or early changes were below the detection limit of the 11 MHz linear probe applied in this study. The spatial resolution of US is determined by frequency and wavelength, and the higher the frequency is, the higher the axial and lateral resolution will be. For mice, US probes with frequencies up to 40 MHz are frequently used, which could improve visualization of small structures. However, the disadvantages of high-frequency machines compared with conventional diagnostic US systems are artefacts caused by incompletely removed hair, the need of general anaesthesia and higher costs of the apparatuses.
To date, the standard readout method for assessment of drug efficacy against E. multilocularis infection is parasite weight determination subsequent to cyst resection at the endpoint of secondary AE infection in mice. Nevertheless, also this method has pitfalls: (i) necropsy can change parasite mass due to cyst rupture and release of vesicle fluid; (ii) growth of the parasite in and around neighbouring tissues and organs renders a perfect resection of the total parasite mass difficult, and it thus could include also contaminating host tissue. One mouse of the MEF-group showed lower cyst weight than one of the ABZ-treated mice, even though it exhibited higher cyst volume by MRI than all ABZ-treated mice. This might well be due to the problems outlined above. Thus, measuring the total parasite weight, which is so far the only method used to assess metacestode growth, harbours a variety of pitfalls, and it has not been validated yet. Therefore, we also employed final US score assessments, as well as MRI measurements of the final metacestode volume. Overall, a positive correlation between all three methods was observed. One difference between the three methods concerns the ABZ- and the MEF-treated groups: whereas US scoring did not detect significant differences between these two groups, both the measurements of parasite weights and assessment of cyst volume by MRI showed a small, but significant difference between these groups. An explanation for the failure of US scoring to detect this difference could be the fact that the total US score also took into account other parameters: Whereas MRI and cyst weight determination reflect cyst size and number, US scoring also includes other factors such as the presence of granular tissue and cysts in abdominal organs.
Taken together, we showed that US monitoring of E. multilocularis infected mice is a valuable non-invasive tool to follow the course of infection and evaluate the effects of anti-parasitic drugs against secondary AE in mice. US monitoring allows the use of smaller animal groups and adjustment of treatment dosage over the course of a therapeutic trial, and could make a valuable contribution to the 3Rs, especially for reduction of animal numbers and refinement of in vivo trials. MRI is the most precise and objective method for parasite volume assessment, but it is by far also the most expensive one and requires general anaesthesia of live animals. Despite US being limited concerning quantitative assessments, it is non-invasive, versatile, safer and economically more feasible as compared with MRI. Endpoint assessment by necropsy and subsequent parasite weight measurement was shown to be well comparable with other methods, in contrary to previous statements on the high variability of this technique (Hemphill et al. Reference Hemphill, Stadelmann, Rufener, Spiliotis, Boubaker, Müller, Müller, Gorgas and Gottstein2014). We therefore recommend the inclusion of final parasite weight measurements in any further drug trials, preferentially in combination with US monitoring.
SUPPLEMENTARY MATERIAL
To view supplementary material for this article, please visit https://doi.org/10.1017/S0031182017000051.
ACKNOWLEDGEMENT
We thank Myriam Siffert from the Institute of Animal Pathology, University of Berne, Switzerland, for responsibly taking care of the animals.
FINANCIAL SUPPORT
The authors acknowledge the financial support provided by the Swiss National Science Foundation (grant no. 31003A-125990; URL: www.snf.ch), the Fondation Sana (URL: www.fondation-sana.ch) and the State Secretariate for Education, Research and Innovation (SBFI; URL: www.sbfi.admin.ch) through COST CM1307.