


1. Introduction
Understanding the dynamical features and thermal regimes of the Antarctic ice sheet is crucial both for ice-core interpretation and for determining the stability of ice sheets. East Dronning Maud Land is an interesting region in both respects. A deep ice core was drilled recently at Dome Fuji (e.g. Dome-F Deep Coring Group, 1998) and is expected to reach the bedrock in the near future. Both for extracting the ice core and for the interpretation of the core data, it is important to estimate the basal temperature at Dome Fuji (e.g. melting or freezing at present and in the past during glacial cycles). In addition, a substantial thinning of the ice surface has been observed on Shirase Glacier (e.g. Reference NaruseNaruse, 1979). Reference MaeMae (1979) argues that the thinning in this area is caused by basal sliding. The basal thermal feature is an important aspect for dynamics in this region. The main objective of this paper is to understand the temporal/spatial variation of ice-sheet temperature over east Dronning Maud Land, especially at the base of Dome Fuji.
While a number of numerical studies have been made of the Antarctic ice sheet using a three-dimensional ice-sheet model (e.g. Reference Ritz, Rommelaere and DumasRitz and others, 2001), few of them have focused on east Dronning Maud Land. Furthermore their choices of uncertain parameters are not constrained by the observed surface topography over east Dronning Maud Land and temperature profiles. Reference Pattyn and DecleirPattyn and Decleir (1995) applied a two-dimensional ice-sheet model including longitudinal stress calculation, which focuses on the dynamics of the Shirase drainage basin. However, they had to assume the change in width of the flow band along the flowline, in order to take into account the horizontal convergence/divergence of the ice flow. Reference Paschke and LangePaschke and Lange (2003) applied a three-dimensional ice-sheet model (including computation of normal deviatoric stress gradient) coupled with an ice-shelf model, which focuses on Nivilsen and its drainage area (69–75˚ S, 9–14˚ E), in east Dronning Maud Land. Although they present results on a small-scale grid (1.25 × 1.25 km), they only show steady-state results under fixed topography.
In the present study, we report thermal features of Dome Fuji and east Dronning Maud Land simulated by a three-dimensional ice-sheet model, whose result is constrained by measurement of the present surface elevation and temperature profile. Several transient experiments forced by glacial/interglacial environment changes are examined in order to discuss the sensitivity of the temperature distribution to uncertain parameters such as geothermal heat flux.
2. Model Description and Experiment Design
The numerical ice-sheet model and boundary conditions used in the present paper are the same as in Reference SaitoSaito (2002). It is a time-dependent, three-dimensional model including thermodynamics. The model inputs are surface mass balance, surface temperature and geothermal heat flux. The model outputs are ice thickness and (three-dimensional) temperature distribution. Glen’s flow law with exponent n = 3 (Reference PatersonPaterson, 1994) is assumed for the stress–strain relationship. The shallow-ice approximation is applied (Reference HutterHutter, 1983). After the approximation, the horizontal velocity vector  can be calculated using surface elevation h and bedrock topography b:

where g = 9.81m s–1 is the acceleration of gravity, ρI = 910 kg m–3 is the density of ice, and  is basal sliding velocity. The rate factor A(T), through which the velocity and temperature fields are coupled, follows Reference HuybrechtsHuybrechts (1992) and Reference PatersonPaterson (1994). Enhancement factor m in Equation 1, which controls the softness of ice, implicitly reflects the effect of impurity and/or anisotropy of ice. It is used as a tuning parameter to improve the agreement between measured and modelled topography. For instance, Reference Huybrechts and de WoldeHuybrechts and de Wolde (1999) adopt 4.5, and Reference Ritz, Rommelaere and DumasRitz and others (2001) adopt 3. These parameters are selected to achieve a good fit for overall topography and volume. Basal sliding is assumed to occur only when the basal ice is at the pressure-melting point. In this paper, a Weertman type (Reference WeertmanWeertman, 1964) is used:

where Z. is the height above buoyancy and the coefficient As is set at 1.8 × 10⁻¹⁰ m7 a–1 N–3 in the present paper.
The evolution of ice-thickness distribution is determined by the continuity equation for the local ice thickness with a prescribed surface accumulation function as a boundary condition:

where H is ice thickness and Ms is surface mass balance.
Temperature distribution is calculated from the thermodynamic equation under prescribed surface temperature function and geothermal heat flux as boundary conditions:

where k I=2.1Wm–1 K–1 and c p = 2009 J kg K–1 are thermal conductivity and specific heat capacity of ice, respectively, and Φ and L are strain-heating and phase-change terms, respectively. The prescribed temperature distribution is employed at the surface of the ice. At the bottom of ice, on the other hand, the mixed boundary conditions are employed:

The geothermal heat flux  is taken as constant. Changes in the glacier bed elevation are calculated by an equation expressing local isostatic rebound:

where ρM = 3300 kgm–3 is the density of mantle, and e is the prescribed equilibrium elevation of bedrock with no ice loading, which is obtained by the simple assumption that the present condition is in equilibrium. The time constant for isostatic rebound, τb, is set at 3000 years in the present paper (Reference Turcotte and SchubertTurcotte and Schubert, 1982).
Surface mass balance is calculated only by accumulation rate. It is expressed as the product of a reference value and a temperature-dependent factor. The temperature dependence of accumulation rate follows Reference Huybrechts and OerlemansHuybrechts and Oerlemans (1990). The present reference accumulation follows the data compiled by Huybrechts and others (2000) with modification at Dome Fuji to 2.75 cm a–1, according to Reference Ritz, Rommelaere and DumasSatow and others (1999).
Surface annual temperature Ts is parameterized as a function of latitude and surface elevation (Reference Fortuin and OerlemansFortuin and Oerlemans, 1990):

where s is surface elevation and . is latitude (in ˚ S). The offset B3 is chosen to fit the present condition. Background temperature (ΔTs in Equation 1) and sea-level shift over 220 kyr follow the configuration of Reference Huybrechts and de WoldeHuybrechts (1998). The coefficients Bn in Equation 1 follow those presented in Reference Pattyn and DecleirPattyn and Decleir (1995), which are based on the observation over Shirase drainage basin by Reference PetitSatow and Kikuchi (1995).


The units of coefficients B 1, B 2 and B 3 are °C m–1, °C degree–1 and °C, respectively. Given the observed surface elevation and location of Dome Fuji, the calculated surface temperature differs only by 1°C and shows good agreement with the observed value.
There are large uncertainties in the choice of ice enhancement factor and geothermal heat flux. In the present paper, three experiments, C, E and G, are presented. The control experiment C applies enhancement factor 1.3 and geothermal heat flux 54.6 mWm–2. Experiment E applies a different enhancement factor, m = 3, and the same geothermal heat flux as the control. Experiment G applies enhancement factor 3 and geothermal heat flux 46 mWm–2. The higher geothermal heat flux of experiments C and E is used in several modelling studies of the Antarctic ice sheet (Reference Pattyn and DecleirPattyn and Decleir, 1995; Reference Huybrechts and de WoldeHuybrechts and de Wolde, 1999; Reference Ritz, Rommelaere and DumasRitz and others, 2001), following Reference Sclater, Jaupart and GalsonSclater and others (1980). Enhancement factor 3 is used by Reference Ritz, Rommelaere and DumasRitz and others (2001), who focus on East Antarctica.
All of them are transient experiments, forced by glacial/interglacial change in background temperature and sea level through 220 kyr. Forcings follow the configuration of Reference HuybrechtsHuybrechts (1998, Reference Huybrechts2002): Temperature forcing is based on Vostok surface temperature change (Reference PaynePetit and others, 1999). Sea-level forcing is based on the SPECMAP stack (Reference Imbrie, Berger, Imbrie, Hays, Kukla and SaltzmanImbrie and others, 1984). The initial condition itself is the final state of the transient experiment beginning from the corresponding steady-state result (as in Reference Ritz, Rommelaere and DumasRitz and others, 2001). All experiments are simulated for 660 kyr in total.
The boundary conditions and parameters other than geothermal heat flux and parameterization of surface temperature are fixed in all three experiments. The model domain spans 5600 × 5600 km, centered at the South Pole. The horizontal resolution is 40 km. The bedrock topography is based on the BEDMAP database (Reference Lythe and VaughanLythe and others, 2000). Different time-steps are used for solving dynamic evolution (Δt = 4.0 years) and thermodynamic evolution (Δt = 20.0 years).
3. Results and Discussion
Figure 1 shows the simulated surface topography over east Dronning Maud Land obtained by the control experiment C at final state (present). Elevation distribution is well simulated over a large area within +100 m. The simulated elevation at Dome Fuji is 3802 m, which is very close to the present observed value (3810 m). However, the elevation of other interior parts of East Antarctica such as Vostok and Dome C is overestimated by around 100 m (not shown). This discrepancy may be due to an incorrect uniform enhancement factor or to uncertainties in the bedrock topography data.
Simulated present surface topography of the result of experiment C. Only the east Dronning Maud Land area is shown. (a) Simulated surface topography. Contour intervals are 200 m (thin line) and 1000 m. The cross symbols, from inland to margin, correspond to SSE150, Dome Fuji, MD364, Mizuho and S16, respectively, as presented in Reference Fujita, Maeno, Furukawa and MatsuokaFujita and others (2002). The circle corresponds to the position of Shirase Glacier. (b) Difference between simulated and measured surface topography. Contour intervals are 100 m (thin line) and 200 m. Dashed lines indicate negative. Shaded region indicates that the difference is >300 m. The axes give the horizontal distance (km) from the South Pole. The cross symbol corresponds to Dome Fuji. Squares are the sequence of model grids used in Figure 5.
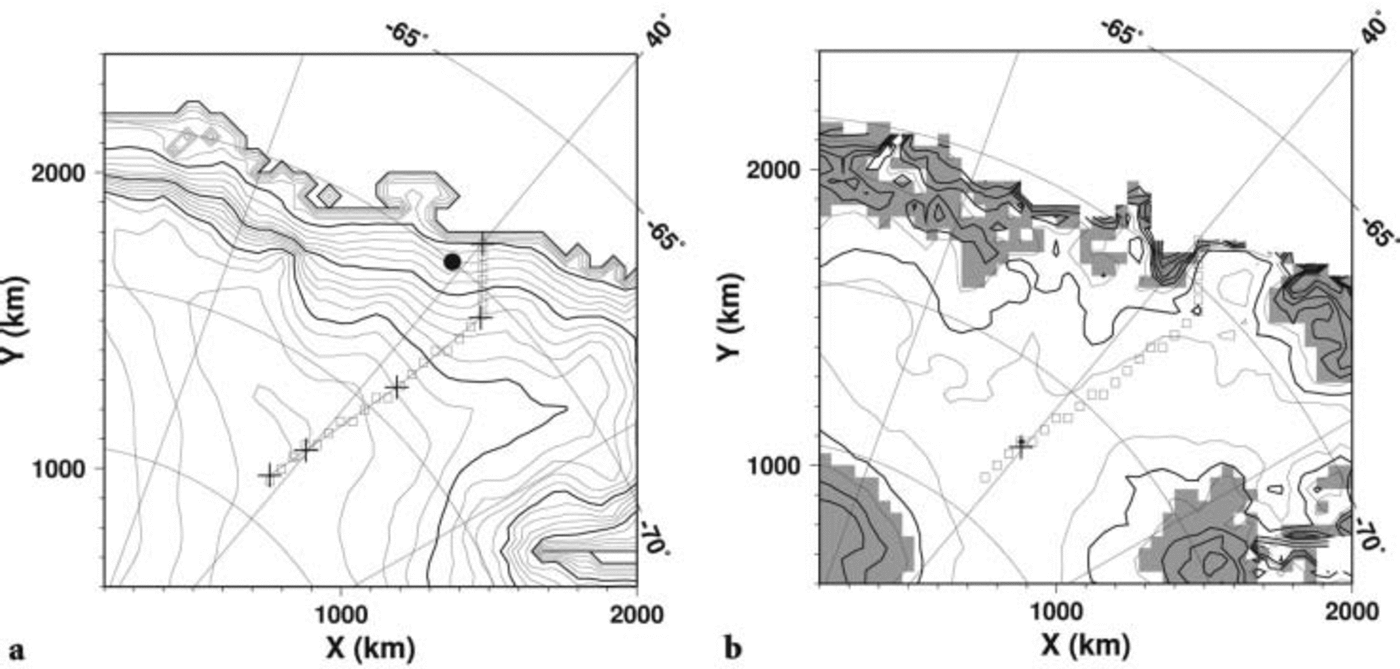
In the sensitivity experiment, E, using a larger enhancement factor 3, the elevation distribution is well simulated within ±100m over a large area of east Dronning Maud Land. The interior part of East Antarctica, especially around Vostok, is also well simulated, within around 10m difference (not shown). However, the simulated elevation at Dome Fuji is 3660 m, which is 150m less than observed. This paper focuses especially on the temperature profile at Dome Fuji. Since simulated thickness (elevation) affects not only the surface temperature, but also the pressure-melting point at the base, the authors regard experiment C as the best simulation.
The simulated surface topography also shows discrepancies within the coastal region, where elevation is overestimated by >300 m. This can be attributed to the coarse grid resolution of the present paper. Reference SaitoSaito (2002) presents a numerical experiment with a 20 km grid resolution model, and shows that the overestimation of the coastal region is reduced by around 100 m while the elevation of the interior is hardly affected. Thus the result of the present paper is considered to be less affected by a refinement to 20 km resolution, for example, especially in the interior part.
Figure 2 shows vertical profiles of temperature at Dome Fuji obtained by the three experiments, together with borehole temperature measurements (error bar) presented by Reference Hondoh, Shoji, Watanabe, Salamatin and LipenkovHondoh and others (2002). The result shows that the vertical advection dominates the temperature profile from the surface to 1000m depth, and that the geothermal heat flux dominates it from the depth to the bottom. The simulated bottom temperature obtained by the control experiment C is –2.6°C, which is at the pressure-melting point. Note that a pressure-melting point at the base of an ice sheet becomes <0°C due to the overburden pressure of 3 km thick ice. Comparison between the borehole temperature gradient and the simulated gradient suggests that the geothermal heat flux used in experiment C (54.6mWm–2) is slightly overestimated. However, the result of experiment C shows good agreement with the measured temperature. On the other hand, the result obtained by experiment G (with geothermal heat flux 46 mWm–2) is not as good, in spite of well-simulated elevation at Dome Fuji.
Vertical profile of simulated present temperature at Dome Fuji grid. Borehole temperature measurement (presented in Reference Hondoh, Shoji, Watanabe, Salamatin and LipenkovHondoh and others, 2002) at Dome Fuji is also shown by three error bars.
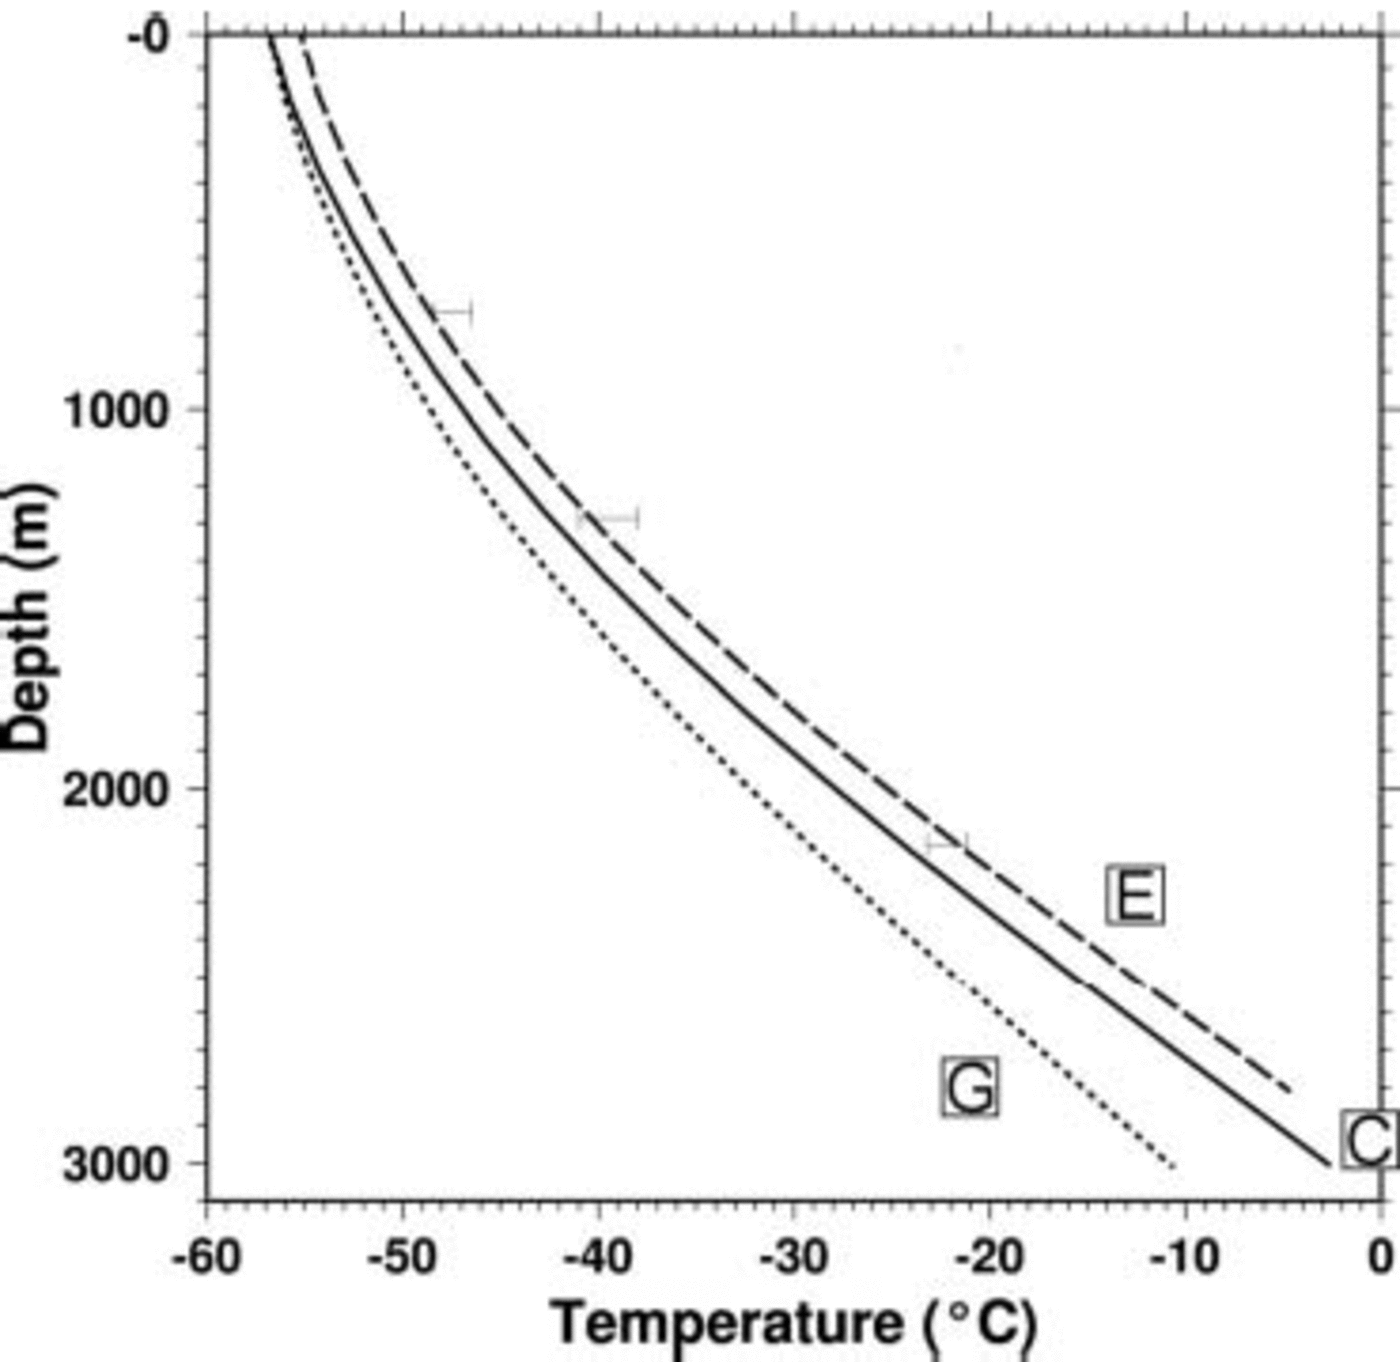
Since the present ice-sheet model lacks the effect of longitudinal stress gradient, a ‘hot spot’ below the divide (Reference Dahl-JensenDahl-Jensen, 1989) cannot be expressed. The difference in temperature between a hot spot and the surrounding area is expected to be of the order of 1°C (Reference Saito, Abe-Ouchi and BlatterSaito and others, 2003). Thus the bottom of Dome Fuji may well be at the pressure-melting point.
Figure 3 shows the distribution of the pressure-melting area at the base over east Dronning Maud Land obtained by experiments C and G. The result of experiment C shows that the region where bedrock is low, including Shirase Glacier, is melting. Although Shirase Glacier cannot be well reproduced by a shallow-ice model, relatively higher velocity occurs there. This leads to large strain heating, which results in basal melting. In addition, the result is consistent with Reference Paschke and LangePaschke and Lange (2003) around their study area (70˚ S, 11˚ E), which shows basal melting conditions. The result of experiment G shows that the basal melting area, especially inland, is much reduced according to lower geothermal heat flux, but that the base of Shirase Glacier is melting even if lower geothermal heat flux is applied.
Simulated present basal-melting area from the results of experiments C and G. Shaded area indicates that the base is at pressure-melting point. Only the east Dronning Maud Land area is shown. The axes give the horizontal distance (km) from the South Pole. Squares are the sequence of model grids used in cross-section figures. The cross symbol corresponds to Dome Fuji.

In Figure 4 the change in simulated surface (upper) and basal (lower) temperature at Dome Fuji throughout the glacial/interglacial cycles is shown. Only the result of experiment C is shown for the surface temperature. The variations of simulated surface temperature obtained by experiments E and G are the same, but with different offset due to different elevation. In the control experiment C, the ice base at Dome Fuji keeps melting throughout the experiment period. In the other two experiments, the amplitudes of basal temperature are at most about 1 K. The results show that the amplitude of basal temperature throughout the ice-age cycles is not strongly dependent on the uncertain parameters. Basal temperature at present is at the lower phase through 100 kyr. The phase of basal temperature is opposite to that of surface temperature variation. The basal temperature at present is at the lower phase during a glacial/interglacial cycle, due to the slow response time of thermodynamics.
Upper: time series of simulated surface temperature at Dome Fuji grid obtained by experiment C. Lower: time series of simulated basal temperature, relative to pressure-melting point, at Dome Fuji grid obtained by experiments C, E and G. In experiment C, basal temperature at Dome Fuji reaches pressure-melting point through the simulated period. Horizontal axis is the lapsed time in kyr, and 0 kyr corresponds to the present.

Figure 5 is the present modelled temperature distribution. The vertical cross-section along the line indicated by the sequence of squares in Figure 1 is shown. The sampling line roughly corresponds to the traverse route shown in Reference Fujita, Maeno, Furukawa and MatsuokaFujita and others (2002), which passes Dome Fuji and Mizuho and avoids the main flow of Shirase Glacier. The results show a qualitatively similar distribution of temperature. Isolines shift almost according to bedrock undulation. The lower layer of about 1000ma.s.l., temperature change in the vertical direction is almost linear due to diffusion. Horizontal advection of cold ice becomes larger from 600 km distance.
Cross-section of present temperature distribution obtained by experiments C and G. Contour intervals are 5 K (thin lines) and 10 K (thick lines). Samples are along the squares in Figure 1. Circles on the base indicate that the corresponding grid is at pressure-melting point at the base. Horizontal axis is the distance from the Dome Fuji gridpoint.

The result of experiment C shows that basal melting may occur in the region where the surface elevation is <2800 m, which is consistent with the measurement by Reference MaeMae (1979). On the other hand, with low geothermal heat flux, few gridpoints show pressure-melting. In this lower region, the basal frictional heating significantly affects the basal thermal regime. There are also several gridpoints showing pressure-melting conditions where the surface elevation is >3000 m. Compared to the lower region, the vertical temperature gradient at the base is smaller in this higher region, which means that the basal frictional heating has a relatively minor effect at the base. Instead, geothermal heat flux or larger ice loading is thought to control the basal melting in this region through heat conduction.
Several previous studies have applied different choices for uncertain parameters. Reference Ritz, Rommelaere and DumasRitz and others (2001) focus mainly on Vostok but also present simulated elevation at Dome Fuji. They apply enhancement factor 3 and geothermal heat flux 55 mWm–2, which are almost the same settings as for experiment E in the present paper. The surface elevation at Dome Fuji simulated by Reference Ritz, Rommelaere and DumasRitz and others (2001), however, is 60 m lower than observed. This is because their present-day accumulation value at Dome Fuji is 3.9 cma–1, which is larger than the value used in the present study (2.75cma–1). Reference Huybrechts and de WoldeHuybrechts and de Wolde (1999) and Reference HuybrechtsHuybrechts (2002) use a similar geothermal heat flux (~56mWm–2) and also a larger enhancement factor (4.5) than the present paper. The West Antarctic ice sheet and the area around Vostok is well represented by their choice, while the surface elevation around Dome Fuji is underestimated by about 200 m due to the large enhancement factor. Reference Pattyn and DecleirPattyn and Decleir (1995) apply a two-dimensional ice-sheet model including longitudinal stress calculation over the Shirase drainage basin. Almost the same geothermal heat flux is used as in the present study, and the simulated surface elevation is close to the measured value. This is because a small enhancement factor of 0.6 is adopted to obtain a close fit to the measured value. However, if we select a small enhancement factor as above in order to obtain a good representation of the surface elevation at Dome Fuji, the other region will be significantly overestimated. We believe that one of the reasons for this is uncertainty in the bedrock topography data on east Dronning Maud Land. Since the ice velocity depends on the ice thickness in the fourth power under the shallow-ice approximation, a small error in bedrock topography greatly affects the modelled results. Reference SaitoSaito (2002) performed a sensitivity study on bedrock topography, using Reference DrewryDrewry’s (1983) bedrock topography map and Reference Lythe and VaughanLythe and others (2000), and showed that the simulated thickness and position of Dome Fuji are affected by the difference in bedrock boundary conditions. Investigation for bedrock topography on east Dronning Maud Land is also needed.
4. Conclusion and Prospect
In the present study, the temperature distribution over east Dronning Maud Land simulated by a three-dimensional shallow ice model is reported. If the geothermal heat flux is 54.6 mWm–2 as applied in several modelling studies of the Antarctic ice sheet (Reference Budd, Coutts and WarnerBudd and others, 1998; Reference Huybrechts, Steinhage, Wilhelms and BamberHuybrechts and de Wolde, 1999; Reference PetitPayne, 1999; Reference Ritz, Rommelaere and DumasRitz and others, 2001), the bottom of Dome Fuji may be at pressure melting, and the vertical profile of temperature at Dome Fuji is close to the borehole temperature. This result is consistent with Reference Hondoh, Shoji, Watanabe, Salamatin and LipenkovHondoh and others (2002), and closer to the pressure-melting point than the result by Reference Pattyn and DecleirPattyn and Decleir (1995). Sensitivity studies are examined for both the enhancement factor and the geothermal heat flux. In addition, the vertical profile of temperature at Dome Fuji is consistent with the borehole temperature. The amplitude of basal temperature through glacial/interglacial cycles is no more than 1 K and is not affected by boundary conditions. Several studies are planned for the future. Extensive fieldwork by radar-echo sounding has been performed on east Dronning Maud Land (Reference FujitaFujita and others, 1999, 2002; Reference Matsuoka, Maeno, Uratsuka, Fujita, Furukawa and WatanabeMatsuoka and others, 2002). Comparison between observed and modelled features is expected to help understanding of the internal structure over east Dronning Maud Land. The present study is based on the shallow-ice approximation, which breaks down near ice divides. Nesting of a higher-order mechanics model, developed in Reference Saito, Abe-Ouchi and BlatterSaito and others (2003), into a shallow-ice model is being constructed. More detailed discussion on vertical thermal structure at Dome Fuji is expected to result from the model.
Acknowledgements
The authors thank B. Paschke and an anonymous referee for their valuable comments on the manuscript.



