Implications
This experiment aimed to evaluate the impact of diet characteristics on vitamin B12 concentration in milk of cows. Results suggest that, among others, fiber was positively and starch in diet was negatively related to vitamin B12 concentration in milk. However, nutrition explained a small part of the vitamin variation in milk among cows. Most of the variation was related to milk yield and milk fat and protein concentrations. In summary, those results highlight that nutrition could help optimizing vitamin B12 concentration in milk, but only to a limited extent.
Introduction
In human nutrition, vitamin B12 is required to prevent megaloblastic anemia and neuropathy (Truswell, Reference Truswell2007). As vitamin B12 is solely synthesized by bacteria (Martens et al., Reference Martens, Barg, Warren and Jahn2002), ruminant products, especially dairy products, are an excellent source of this vitamin due to bacteria dwelling in the rumen. Therefore, plant products do not naturally contain vitamin B12. About 5% of Canadians are vitamin B12 deficient (MacFarlane et al., Reference MacFarlane, Greene-Finestone and Shi2011) as similarly reported in the US population (Allen, Reference Allen2009). In Venezuela, vitamin B12 deficiency is more frequent and averaged 11.4% and 61.3% for children from 0 to 7 years and for pregnant women, respectively (Garcia-Casal et al., Reference Garcia-Casal, Osorio, Landaeta, Leets, Matus, Fazzino and Marcos2005), whereas the frequency is 32.4% for adolescents in India (Chakraborty et al., Reference Chakraborty, Chopra, Mani, Giri, Banerjee, Sahni, Siddhu, Tandon and Bharadwaj2018). It has been showed that plasma concentration of vitamin B12 was associated with vitamin intake in humans and that dairy product and fish consumption, and use of supplement could help avoiding low plasma vitamin B12 concentration (Vogiatzoglou et al., Reference Vogiatzoglou, Smith, Nurk, Berstad, Drevon, Ueland, Vollset, Tell and Refsum2009). However, vitamin B12 in cow milk is more efficiently absorbed than in fish products (Vogiatzoglou et al., Reference Vogiatzoglou, Smith, Nurk, Berstad, Drevon, Ueland, Vollset, Tell and Refsum2009) and its synthetic form found in supplements (Matte et al., Reference Matte, Guay and Girard2012). In Spain, Durá-Travé and Gallinas-Victoriano (Reference Durá-Travé and Gallinas-Victoriano2014) observed that 69.5% and 60.4% of daily vitamin B12 requirements were fulfilled by dairy product consumption in children and adolescents, respectively.
According to recent studies, vitamin B12 concentration of cow milk varies greatly among individuals (Rutten et al., Reference Rutten, Bouwman, Sprong, van Arendonk and Visker2013; Duplessis et al., Reference Duplessis, Mann, Nydam, Girard, Pellerin and Overton2015 and Reference Duplessis, Pellerin, Cue and Girard2016). Milk concentration of vitamin B12 of 399 early lactating cows varied from 1213 to 6755 pg/ml (Duplessis et al., Reference Duplessis, Pellerin, Cue and Girard2016). Taking account of the dietary reference intake (National Academy of Sciences, 1998), one 250 ml glass of milk from these cows could provide between 13% and 70% of the recommended dietary allowance (RDA) of vitamin B12 for a human above 13 years old. This variation could be explained by genetic of animals and feeding management (Rutten et al., Reference Rutten, Bouwman, Sprong, van Arendonk and Visker2013; Duplessis et al., Reference Duplessis, Pellerin, Cue and Girard2016).
Apparent ruminal synthesis (ARS) of vitamin B12 increased when cows received a high-fiber diet compared with a high-starch diet (Beaudet et al., Reference Beaudet, Gervais, Graulet, Nozière, Doreau, Fanchone, Castagnino and Girard2016). Moreover, ARS of vitamin B12 was positively correlated with nutrient intake and the amounts of NDF and starch ingested (Castagnino et al., Reference Castagnino, Seck, Beaudet, Kammes, Voelker Linton, Allen, Gervais, Chouinard and Girard2016b; Seck et al., Reference Seck, Linton, Allen, Castagnino, Chouinard and Girard2017). These recent studies showed that diet could have an impact on ARS of vitamin B12. In line with those results, Duplessis et al. (Reference Duplessis, Pellerin, Cue and Girard2016) observed that vitamin B12 concentration in milk of cows in early lactation could be modified by diet composition.
Offering a naturally stable vitamin B12 concentration in milk could enhance the population perception regarding milk consumption and then decrease vitamin B12 deficiency around the world. To achieve this, we need to better understand what causes the huge variation of this B vitamin concentration in milk. As nutrition has an impact on the ARS of vitamin B12 and a part of this synthesized vitamin will be secreted in milk, it was hypothesized that diet composition could have an impact on vitamin B12 concentration in milk. Thus, the purpose of this study was to identify diet and nutrient composition characteristics affecting milk vitamin B12 concentration of cows. Moreover, characteristics of cows such as days in milk (DIM), parity, milk yield and composition were also evaluated in the model.
Material and methods
Data collection
All procedures of this study were previously approved by the Animal Care Committee from Université Laval, Québec, Canada following the guidelines of the Canadian Council on Animal Care (2009).
A total of 100 commercial dairy herds located in the province of Québec, Canada were enrolled in the study as previously described (Fadul-Pacheco et al., Reference Fadul-Pacheco, Pellerin, Chouinard, Wattiaux, Duplessis and Charbonneau2017). To participate, dairy herds had to have Holstein cows as main breed, to milk cow twice daily, to record milk production through the dairy herd improvement agency (Valacta, Dairy Production Center of Expertise, Québec and Atlantic Provinces, Sainte-Anne-de-Bellevue, QC, Canada) and to use the regular a.m. to p.m. milk testing scheme. The latter consists of recording milk yield and collecting milk samples for two consecutive milkings. Moreover, diets had to be calculated according to cow requirements based on a recognized software model; most diets were computed based on the equations of the National Research Council (NRC, 2001). Producers that met the above conditions were phone contacted and participation was on a voluntary basis. Between October 2014 and June 2015, each participating herd was visited once for three consecutive milkings (morning and evening milkings of the 1st day and morning milking of the 2nd day of the visit) to cover 24-h production and feed distribution periods. Cows were housed in tie-stall (n = 98) and free-stall barns (n = 2). Herd size ranged from 16 to 113 lactating dairy cows. Total mixed ration (TMR) was used in 31 herds, whereas automatic component feeding system (AFS) was used in 49 herds and manual component feeding (MCF) in 20 herds. These last two feeding managements consist of offering customized quantity of component ingredients per cow based on their requirements.
During the 1st morning milking of the visit, samples of each ingredient fed to dairy cows were collected and the quantity given was recorded throughout the day as previously described by Fadul-Pacheco et al. (Reference Fadul-Pacheco, Pellerin, Chouinard, Wattiaux, Duplessis and Charbonneau2017). Briefly, regarding TMR management, quantities offered of each ingredient per feeding group of cows were recorded from the scale of the mixer and a validation was made by weighing the quantity of TMR fed to at least 10 cows per group. Concerning AFS and MCF, forages offered were measured per feeding group as explained below but component feeds were recorded individually as follows: (1) for AFS, concentrate offered daily was taken directly from the computer programming. The accuracy of AFS was validated by comparing the actual weight of a feed given by the AFS and the programmed quantity and; (2) regarding MCF, concentrate quantities fed per cow were weighed before offering it. When applicable, an electronic scale (OCSB3 Compact Crane Scale; Anyload Transducer Co. Ltd, Burnaby, BC, Canada) was used to weigh hay or silage bales. When chopped mixed or corn silage were offered using a cart, quantities given to 10 cows per feeding group were weighed. Feed samples were stored at −20°C until analysis.
Separate milk samples using calibrated in-line milk meters were collected and milk yields were recorded during the evening milking of the 1st day and the morning milking of the 2nd day of the visit. For each milk sample collection, one sample was stored at −20°C until vitamin B12 concentration analysis was performed and another one was preserved with bronopol and sent immediately to the Valacta laboratory for milk component analyses. Body weight was estimated for each individual using a tape measuring heart girth circumference (Yan et al., Reference Yan, Mayne, Patterson and Agnew2009). Information on parity of cows, DIM, number of lactating cows per herd, and average milk production per cow on a 305-day basis was obtained from Valacta.
Analyses
Milk
Milk fat, protein and lactose concentrations from evening and morning samples were separately analyzed by mid-IR with MilkoScanTM FT 6000 (Foss, Hillerød, Denmark) in the laboratory of Valacta. Milk concentration of vitamin B12 in evening and morning milking samples was separately analyzed in duplicate by radioassay as previously described by Duplessis et al. (Reference Duplessis, Mann, Nydam, Girard, Pellerin and Overton2015) using a commercial kit (SimulTrac B12/Folate-S; MP Biomedicals, Solon, OH, USA). The interassay CV was 3.1%.
Feed
Feed samples were oven dried at 55°C for 48 h for dry matter (DM) determination and ground through a 1-mm sieve, and analyzed by wet chemistry (SGS Agrifood Laboratories, Guelph, ON, Canada) for CP, ADF, NDF, lignin, starch, fat and Co concentrations. Rumen undegradable protein (RUP), net energy of lactation (NEL) and non-fiber carbohydrates (NFC) were calculated according to the NRC (2001).
Calculations
Percentages of corn silage, chopped or baled mixed silage (grass, legume or both), hay, concentrate, corn, other cereals (i.e. oat, barley, wheat and mixed cereals), soy products, commercial protein supplement, commercial energy supplement, fat supplement, and commercial vitamin and mineral supplements in the diet were calculated with the daily quantity given of each ingredient divided by the total ration offered on a DM basis using Proc SQL of SAS (version 9.4; SAS Institute, 2012). To be classified as hay and commercial protein supplement, the ingredients had to have a DM greater than 70% and a CP greater than 30% of DM, respectively. If a commercial supplement did not correspond to the previous definition of commercial protein supplement and had at least 30% of NFC, it was considered as commercial energy supplement. For each herd, it was possible to calculate the nutrient composition of the diet using the results of the ingredient chemical analyses multiplied by the percentage of each ingredient in the diet on a DM basis.
Daily vitamin B12 concentration (pg/ml) in milk was calculated using evening and morning vitamin B12 concentrations weighted with respective milk yield, then divided by daily milk yield. The same calculation was used for daily milk fat, protein and lactose concentrations.
Statistical analyses
Proc UNIVARIATE of SAS was used in order to obtain descriptive statistics of milk components and milk yield, ingredients and composition of the diet and cow characteristics.
In order to address the objective of this experiment, 29 independent continuous variables related to dietary composition (i.e. NEL (Mcal/kg of DM), CP, RUP, starch, ADF, NDF, NDF from forage, lignin, NFC, fat (% of DM), Co (mg/kg of DM)), diet ingredients (corn silage, chopped or baled mixed silage, hay, concentrate, corn, other cereals, soy products, commercial protein supplement, commercial energy supplement and fat supplement (% of DM)) and cows (estimated cow BW (kg), DIM, expDIM (calculated as e −0.05*DIM to take into account the moment of peak or nadir production (Wilmink, Reference Wilmink1987)), milk production (kg/day) and composition (%)) were collected. Proc CORR of SAS was carried out to evaluate Spearman correlation coefficients among independent continuous variables and Proc REG of SAS was performed to study variance inflation factor (VIF) as described by Kaps and Lamberson (Reference Kaps and Lamberson2017). A Spearman correlation coefficient >0.6 and VIF >10 suggest multicollinearity. Among others, NDF, ADF, NFC, starch, NEL were highly correlated and NDF had a VIF = 74, suggesting multicollinearity. Hence, a principal component analysis (PCA) was chosen to overcome this problem. The purpose of a PCA is to reduce the dimensionality of interdependent variables while accounting for most of the variation of those variables (Jolliffe, Reference Jolliffe2002). Proc PRINCOMP of SAS was applied to the standardized independent continuous variables to determine the number of principal components (PC) to retain in the model based on an eigenvalue >1. Then, Proc FACTOR was performed using the number of PC previously determined. A VARIMAX rotation was applied to the retained PC in order to facilitate their interpretation and identifying which variables have the largest contribution to a particular PC. Indeed, the variable was associated with a PC when the largest rotated pattern coefficient among the PC was obtained.
Proc MIXED of SAS was used to study the relationship between daily vitamin B12 concentration and PC using the following multivariable model:
Y ij = b 0 + b 1x 1ij + b 2x 2ij + b 3PC1ij + b 4PC2ij + … + b nPCn ij + v i + ε ij in which Y ij is the daily vitamin B 12 concentration in milk of the jth cow of the ith herd, b 0 the fixed intercept; b 1 and b 2 the regression coefficients for parity and feeding system, and x 1ij and x 2ij the category for parity (i.e. first, second or third lactations) and feeding system (i.e. TMR, AFS or MCF) of the jth cow of the ith herd, respectively; b 3 the regression coefficient of PC1 and PC1 the score of the first PC of the jth cow of the ith herd and so forth; v i the random intercept of the ith herd; and ij the Gaussian error term. INFLUENCE option was used to get Cook’s distance in order to identify influential data for their suppression. A total of 136 out of 4340 data were deleted according to the method proposed by Kaps and Lamberson (Reference Kaps and Lamberson2017). Residuals were visually assessed for normality and homoscedasticity. Linearity between predictors and the dependent variable (daily vitamin B12 concentration in milk) was visually assessed with Proc GPLOT of SAS. A Tukey’s honest significant difference test was performed when results from categorical variables reached significance. Results were considered significant when P⩽0.05. Prediction values from the mixed multivariable model were obtained from the option OUTP of Proc MIXED and then Proc REG of SAS was used to compute the pseudo-R 2 between predicted and observed values of daily vitamin B12 concentration in milk.
Results
Descriptive statistics
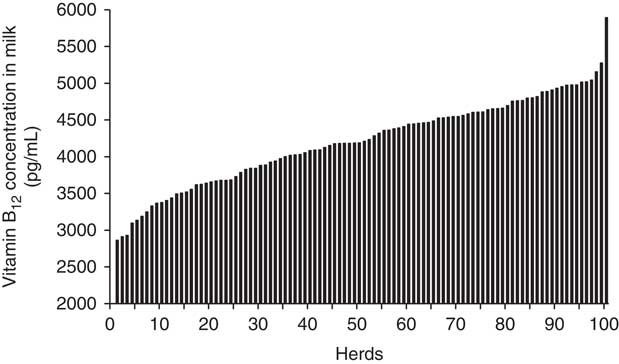
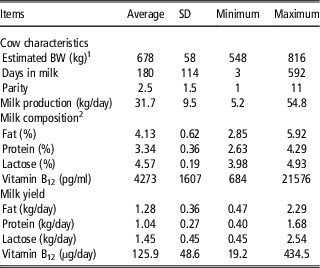
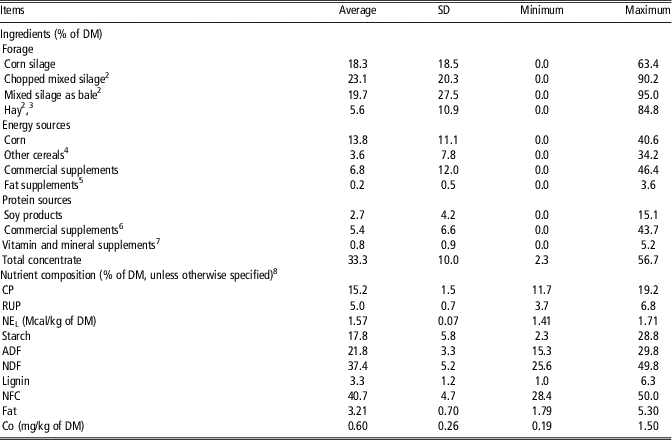
Within the 100 participating dairy herds, 4340 Holstein cows (1484 first, 1093 second and 1763 third and more parity cows) between 3 and 592 DIM were milk sampled. Milk production on a 305-day basis averaged 9814 kg (SD: 1948; min to max: 2138 to 19625) per cow. Cow characteristics and milk production are shown in Table 1. On average, cows participating at this study weighed 678 kg, were at 180 DIM and had 2.5 lactations. Vitamin B12 concentration in milk from evening and morning milkings averaged 4286 (SD: 1784; min to max: 822 to 25 050) and 4284 (SD: 1638; min to max: 575 to 17 898) pg/ml, respectively. Regarding variation among herds, averaged daily vitamin B12 concentration in milk ranged from 2861 to 5892 pg/ml (Figure 1). The forage part of the diets was mainly composed of either chopped mixed silage plus corn silage or mixed silage as bale alone (Table 2). A typical diet averaged 15.2% of CP, 1.57 Mcal/kg of NEL and 37.4% of NDF on a DM basis.
Daily vitamin B12 concentration in milk among dairy cow herds.

Average, SD, minimum and maximum of milk production and composition and characteristics of dairy cows involved in this experiment

1 Estimated using heart girth circumference according to Yan et al. (Reference Yan, Mayne, Patterson and Agnew2009).
2 Daily concentrations were computed from evening and morning samples weighted with respective milk yield.
Average, SD, minimum and maximum of ingredients and nutrient composition of diets given to dairy cows1

DM = dry matter; RUP = rumen undegradable protein; NEL = net energy of lactation; NFC = non-fiber carbohydrate.
1 Calculated to meet requirements of dairy cows varying in lactation stages.
2 Grass, legume or both forages included.
3 Defined as >70% of DM.
4 Oat, barley, wheat and mixed cereals included.
5 Rumen inert fat either by supplying prilled hydrogenated or Ca soap fatty acids.
6 Defined as CP >30% of DM.
7 Commercial blend. For some herds, vitamins and minerals were included in commercial energy or protein supplements.
8 Nutrient composition of commercial energy supplement (% of DM unless specified): 20.1±9.2% CP, 9.9±7.1% ADF, 23.5±9.1% NDF, 46.1±13.5% NFC, 1.73±0.13 Mcal NEL/kg of DM, 23.0±15.8% starch and 1.40±1.04 mg/kg of Co and nutrient composition of commercial protein supplement (% of DM unless specified): 37.0±8.0% CP, 9.0±3.7% ADF, 19.6±6.3% NDF, 29.9±9.1% NFC, 1.76±0.06 Mcal NEL/kg of DM, 6.5±7.6% starch and 1.95±1.15 mg/kg of Co.
Principal component analysis
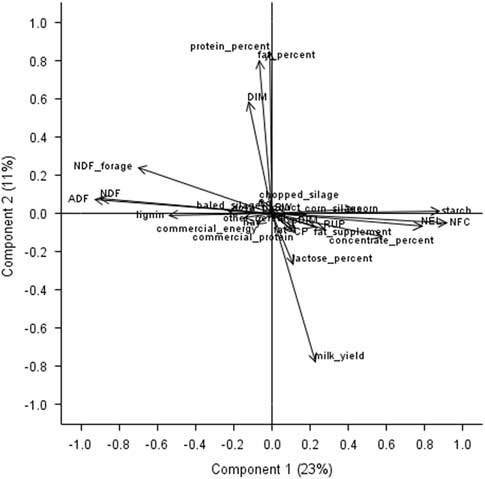
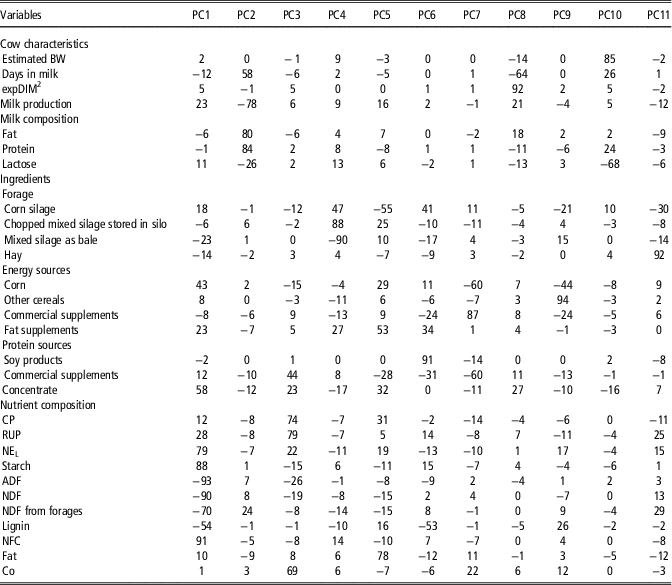
Eigenvalues were lower than 1 after 11 PC. Hence, 11 PC explaining 79% of the total variation were retained for further analysis. The first and the second PC explained for 23% and 11% of the total variance, respectively (Figure 2). The first PC was negatively associated with fiber (lignin, NDF from forage, NDF and ADF) and positively with energy (NFC, starch, NEL, percentage of concentrate) of the diet. The second PC was related to milk production (positively to milk protein and fat concentrations and negatively to milk yield), the third PC positively to protein concentration of the diet (including CP and RUP) and Co concentration, the fourth PC positively to chopped and negatively to baled mixed silages, the fifth PC positively to fat (including fat and commercial fat product percentages in the diet) and negatively to corn silage concentrations, the sixth PC positively to soy product percentage in the diet, the seventh PC positively to percentage of commercial energy supplement and negatively to percentages of commercial protein supplement and corn in the diet, the eighth PC negatively to DIM and positively to expDIM, the ninth PC positively to the percentage of other cereals in the diet, the tenth PC positively to BW and negatively to milk lactose concentration and the eleventh PC positively to the percentage of hay in the diet. Hence, the PCA allowed reducing the number of variables to include in the mixed multivariable regression analysis. Rotated pattern coefficients shown in Table 3 represent the relative contribution of each variable to each PC. Therefore, variables with the largest pattern coefficient contribute to the largest variation of the PC.
Plot of principal components 1 and 2 (explained variance by each component in parentheses) of the independent continuous variables after the rotation. DIM = days in milk; RUP = rumen undegradable protein; NEL = net energy of lactation; NFC = non-fiber carbohydrate.

Rotated pattern coefficients1 of the principal component (PC) analysis

DIM = days in milk; RUP = rumen undegradable protein; NEL = net energy of lactation; NFC = non-fiber carbohydrate.
1 Multiplied by 100 and rounded to the closest integer.
2 Calculated as e −0.05*DIM.
Relationship between daily vitamin B12 concentration and independent variables
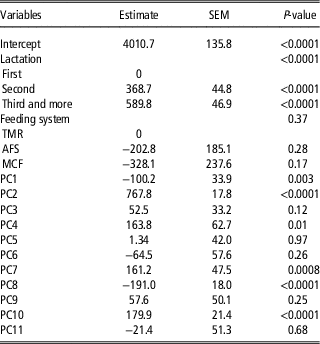
Daily vitamin B12 concentration in milk differed according to parity (P < 0.0001; Table 4). First parity cows (3809 pg/ml (SE: 80; 95% confidence interval (CI): 3651 to 3967)) had lower vitamin B12 concentration in milk than second and more lactations (P < 0.0001) and second parity cows (4178 pg/ml (SE: 79; 95% CI: 4022 to 4334) ) had lower concentration of this vitamin in milk than third and more lactations (4399 pg/ml (SE: 77; 95% CI: 4246 to 4551); P < 0.0001). Feeding system was not related with vitamin B12 concentration in milk (P = 0.37).
Multivariable model describing the relationships between daily vitamin B12 concentration in milk of dairy cows and number of lactation, feeding system and principal components (PC)

TMR = total mixed ration; AFS = automatic component feeding system; MCF = manual component feeding.
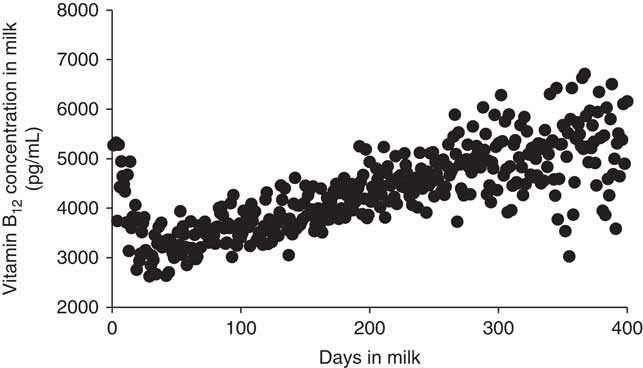
Six PC had a significant relationship with daily vitamin B12 concentration in milk (P⩽0.01; Table 4). The most important PC in the model was related to milk yield and components (PC2) as shown by the highest estimate value (Table 4). For instance, an animal with low milk production and milk lactose concentration coupled with high milk fat and protein concentrations will produce milk with higher vitamin B12 concentration than a cow with high milk yield and milk lactose concentration along with low milk fat and protein concentrations. According to the current results, increasing the percentages of baled mixed silage (PC4), corn and commercial protein supplement (PC7) in the diet decreased the concentration of vitamin B12 in milk. The opposite was observed regarding the percentages of chopped mixed silage (PC4) and commercial energy supplement (PC7) in the ration. Regarding PC1, the higher concentration of fiber and the lower concentration of energy in the diet were associated with the greater vitamin B12 concentration in milk. Milk vitamin B12 concentration decreased until 50 to 55 DIM and then increased as lactation progressed as suggested by the PC8 results (Figure 3). Milk vitamin B12 concentration was positively associated with BW (PC10). The model explained 52% of the variability of daily vitamin B12 concentration in milk (pseudo-R 2 of 52%). When including only PC2 in the mixed model, which is related to milk production, the pseudo-R 2 reached 46%.
Average daily vitamin B12 concentration in milk of cows by days in milk.

Discussion
Dairy herds in the current study produced about 500 kg of milk per cow above the average milk production in Quebec, Canada for 2015 (Valacta, 2016). According to the nutritional tables of the National Academy of Sciences (1998), one 250-ml glass of milk from herds in the current study could provide between 28% and 61% of RDA of vitamin B12 for a human over 13 years old, which is greater than results obtained from Duplessis et al. (Reference Duplessis, Pellerin, Cue and Girard2016) involving cows in early lactation. This result could be explained by the negative effect of DIM in early lactation on vitamin B12 concentration as supported by the PC8. According to the United States Department of Agriculture (2012), a 250 ml glass of milk should supply 46% of RDA of vitamin B12; 50% of participating herds did not reach this threshold. Milk concentration of vitamin B12 was greater as the number of parities increased. This result is conflicting with those from Akins et al. (Reference Akins, Bertics, Socha and Shaver2013) and Duplessis et al. (Reference Duplessis, Pellerin, Cue and Girard2016) who reported no parity effect on vitamin B12 concentration in milk for cows at about 150 and 55 DIM, respectively. Nevertheless, Girard and Matte (Reference Girard and Matte1999) noted that serum concentration of vitamin B12 of multiparous cows was greater than in serum of primiparous cows. In line with results regarding parity, vitamin B12 concentration in milk was positively associated with estimated BW. As vitamin B12 is involved in cell division (McDowell, Reference McDowell2000), it could be hypothesized that younger animals require more of the vitamin for their growth, leading to lower vitamin B12 concentration in milk.
To our knowledge, this is the first experiment involving a large number of cows varying in lactation stage studying the impact of ingredients and nutrient composition on milk concentration of vitamin B12. Analysis made in this paper relied on quantities of each ingredient actually given the day of the visit compared with analysis based on diet formulation printouts in our previous study (Duplessis et al., Reference Duplessis, Pellerin, Cue and Girard2016). Therefore, data collected in the current study are more representative of what the cows actually ate the day of the visit. Studies evaluating the impact of cow nutrition on milk concentration of vitamin B12 are scarce in the literature. Miller et al. (Reference Miller, Wentworth and McCullough1966) subjectively evaluated the effect of forage quality on vitamin B12 concentration in milk and did not find any consistent trend. It has been showed by Chassaing et al. (Reference Chassaing, Graulet, Agabriel, Martin and Girard2011) that the highest vitamin B12 concentration in milk was observed with diets based on corn silage. In opposition, in the current study, the PC including the percentage of corn silage in the diet was not significant. Duplessis et al. (Reference Duplessis, Pellerin, Cue and Girard2016) observed that the milk concentration of vitamin B12 of early lactation cows was positively related with ADF and negatively related with CP concentration of the diet as formulated by the farm nutritionists. In the current study, PC including the percentage of ADF in the diet was also positively associated with daily vitamin B12 concentration in milk, but no effect on CP concentration was noted. However, daily vitamin B12 concentration in milk was negatively related with commercial protein supplement.
Surprisingly, Co concentration in the diet did not have an impact on the vitamin B12 concentration in milk. It is well known that one atom of Co is required by bacteria to synthesize a molecule of vitamin B12 (Martens et al., Reference Martens, Barg, Warren and Jahn2002). However, as diets of participating dairy herds were above the NRC (2001) requirement of 0.11 mg/kg of Co on a DM basis, it could be hypothesized that Co was not a limiting factor for vitamin B12 synthesis in the rumen.
Recent studies have been conducted to analyze the effect of the diet on ARS of vitamin B12 (Beaudet et al., Reference Beaudet, Gervais, Graulet, Nozière, Doreau, Fanchone, Castagnino and Girard2016; Castagnino et al., Reference Castagnino, Kammes, Allen, Gervais, Chouinard and Girard2017; Seck et al., Reference Seck, Linton, Allen, Castagnino, Chouinard and Girard2017). As vitamin B12 is solely synthesized by bacteria, it could reasonably be hypothesized that the influence of cow nutrition on ARS of this vitamin would have an impact on the vitamin secreted in milk. Results from Beaudet et al. (Reference Beaudet, Gervais, Graulet, Nozière, Doreau, Fanchone, Castagnino and Girard2016) in which ARS of vitamin B12 was three-fold higher with a diet containing about 48.8% of NDF compared with a diet having a NDF concentration of about 36.2% (DM basis) are similar to those obtained in the present trial regarding milk concentration. Moreover, Schwab et al. (Reference Schwab, Schwab, Shaver, Girard, Putnam and Whitehouse2006), Castagnino et al. (Reference Castagnino, Kammes, Allen, Gervais, Chouinard and Girard2016a) and Seck et al. (Reference Seck, Linton, Allen, Castagnino, Chouinard and Girard2017) found a positive correlation between ARS of vitamin B12 and dietary NDF concentration. Conflicting results regarding the relationship between dietary starch and ARS of vitamin B12 could be observed in the literature. Indeed, Schwab et al. (Reference Schwab, Schwab, Shaver, Girard, Putnam and Whitehouse2006) and Beaudet et al. (Reference Beaudet, Gervais, Graulet, Nozière, Doreau, Fanchone, Castagnino and Girard2016) reported a negative relationship as in the present trial involving milk and Castagnino et al. (Reference Castagnino, Kammes, Allen, Gervais, Chouinard and Girard2017) and Seck et al. (Reference Seck, Linton, Allen, Castagnino, Chouinard and Girard2017) obtained a positive relationship. High-starch diets of the two former studies included corn and barley, whereas low-starch diets did not. In comparison, all diets of the two latter studies included corn as a starch source differing by its level of inclusion. Ranges of starch and corn percentages in diets of the current experiment were closer to those from Schwab et al. (Reference Schwab, Schwab, Shaver, Girard, Putnam and Whitehouse2006) and Beaudet et al. (Reference Beaudet, Gervais, Graulet, Nozière, Doreau, Fanchone, Castagnino and Girard2016) than to those from Castagnino et al. (Reference Castagnino, Kammes, Allen, Gervais, Chouinard and Girard2017) and Seck et al. (Reference Seck, Linton, Allen, Castagnino, Chouinard and Girard2017). Schwab et al. (Reference Schwab, Schwab, Shaver, Girard, Putnam and Whitehouse2006) reported a negative relationship between dietary NFC and ARS of vitamin B12 which is in line with the current study. Ruminal concentration of vitamin B12 was greater when dairy cows received a high forage to concentrate ratio diet (60 : 40) than a low forage to concentration ratio diet (40 : 60) (Santschi et al., Reference Santschi, Chiquette, Berthiaume, Martineau, Matte, Mustafa and Girard2005). Accordingly, vitamin B12 concentration in milk was negatively related with the percentage of concentrate in the diet in the current experiment. Under the present state of knowledge, it is not possible to establish a link between those results and the ruminal microbiota as ruminal bacteria synthetizing vitamin B12 are not well known. However, Dryden et al. (Reference Dryden, Hartman, Bryant, Robinson and Moore1962) identified four ruminal bacteria strains producing the vitamin whose Selenomonas ruminantium which could be involved in ruminal fiber degradation (Sawanon et al., Reference Sawanon, Koike and Kobayashi2011). That could explain why vitamin B12 concentration in milk was positively related with fiber concentration of the diet.
To our knowledge, the impact of offering chopped or baled mixed silage, commercial protein and energy supplements on vitamin B12 concentration in milk or vitamin B12 ARS has never been studied before. Even though silage particle length was not recorded, it is likely that particle length of baled mixed silage was longer than chopped mixed silage. As vitamin B12 concentration in milk was higher when chopped silage was offered compared with baled silage, it suggests that the physical form of the silage could have an impact on vitamin B12 concentration in milk. However, Castagnino et al. (Reference Castagnino, Kammes, Allen, Gervais, Chouinard and Girard2016a) did not note a difference in ARS of vitamin B12 between long or short particle length forages fed to dairy cows (theoretical particle length of silages: 19 and 10 mm for long and short particles, respectively). The negative impact of the inclusion of corn in the diet on vitamin B12 concentration in milk is in accordance with the negative impact of starch as previously reported by Schwab et al. (Reference Schwab, Schwab, Shaver, Girard, Putnam and Whitehouse2006) and Beaudet et al. (Reference Beaudet, Gervais, Graulet, Nozière, Doreau, Fanchone, Castagnino and Girard2016). The positive impact of commercial energy supplement on vitamin B12 concentration in milk seems conflictual with the present results. However, percentages of ADF and NDF and concentration of Co were higher by, respectively, 3.8, 2.4 and 6.1 times and percentage of starch was lower by 2.9 times in commercial energy supplement than in corn in the current experiment.
The improvement of 6% of the pseudo-R 2 when including diet characteristics in the analysis suggests that nutrition is not the main factor explaining the variation of vitamin B12 concentration in milk among cows. Indeed, 46% of the model was explained by milk fat and protein concentrations and milk yield. From current results, it could be concluded that vitamin B12 concentration in milk followed a similar lactation curve compared with milk fat and protein concentrations, that is, milk vitamin B12 concentration decreased in early lactation until a nadir around 50 to 55 DIM and then increased thereafter. Accordingly, Duplessis et al. (Reference Duplessis, Cue, Santschi, Lefebvre and Girard2018) found a negative relationship between DIM and vitamin B12 concentration in milk of cows from 3 to 40 DIM. Results from Rutten et al. (Reference Rutten, Bouwman, Sprong, van Arendonk and Visker2013) and Duplessis et al. (Reference Duplessis, Pellerin, Cue and Girard2016) suggested that part of the variation could be explained by genetic. It could then be hypothesized that a part of the unexplained variation of vitamin B12 concentration in milk could be due to the genotype of the animal. Moreover, the host specificity of the ruminal microbiota cannot be ruled out as a causal factor for the inter-animal differences, even among cows kept under similar feeding and management practices (Weimer, Reference Weimer2015). Hence, differences in ruminal bacterial species composition among cows could possibly affect the amount of vitamin B12 available for the animal.
Conclusion
Vitamin B12 concentration in milk varied widely among herds, from 2861 to 5892 pg/ml. Third and greater lactations had higher vitamin B12 concentration in milk than first and second parity cows. Dietary factors associated with vitamin B12 concentration in milk explained only a limited part of the variation. Fiber concentrations of the diet, such as ADF and NDF, and energy-related compounds, such as NFC and starch, were, respectively, positively and negatively associated with vitamin B12 concentration in milk. The most important PC explaining the variation in concentration of vitamin B12 in milk was related to milk production and milk fat and protein concentrations. These results highlight that vitamin B12 concentration in milk could be modified by feeding management but only to a limited extent. The major part of the variation seems to be related to individual attributes of the cow itself. It is noteworthy that the present results are only valid under the current conditions, that is, diets which are not Co limiting and balanced according to the cow requirements. Future research should focus on the impact of rumen microbiota on vitamin B12 concentration in milk.
Acknowledgments
The authors acknowledge the invaluable participation of the dairy producers in this experiment. The authors appreciate the help of Valérie Audet and Isabelle Duval (Université Laval, Québec, QC, Canada) for data collection, Hélène Crépeau and Laurence Desbois-Bédard (Université Laval, Québec, QC, Canada) for statistical help, Valérie Beaudet, Jasmin Brochu and Liette Veilleux (Agriculture et Agroalimentaire Canada, Sherbrooke, QC, Canada) for laboratory analyses and Valacta (Sainte-Anne-de-Bellevue, QC, Canada). This experiment was funded through the Programme de recherche en partenariat sur la préservation et l’amélioration de la valeur nutritive des aliments en lien avec la santé Fondation des maladies du cœur et de l’AVC et Visez santé (FMC), Ministère de l’Agriculture, des Pêcheries et de l’Alimentation du Québec (MAPAQ), Ministère de la Santé et des Services Sociaux (MSSS), Fonds de recherche du Québec – Nature et technologies (FRQNT) et le Fonds de recherche du Québec – Santé (FRQS). Moreover, through the Dairy Research Cluster Initiative (Dairy Farmers of Canada, Agriculture and Agri-Food Canada, Canadian Dairy Network and Canadian Dairy Commission (Ottawa, ON, Canada)).
Declaration of interest
None.
Ethics statement
None.
Software and data repository resources
None of the data were deposited in an official repository.