Implications
Holstein-Friesian steers require more energy from feed for maintenance than beef cattle breeds; therefore, the cost to produce highly marbled beef is much higher. Haylage feeding is practically known to have cheaper cost than concentrate in finishing dairy steers. However, animal performance is poorer than those fed with concentrate. Due to the establishment of a niche market for n-3-enriched foods, adding value is necessary by improving carcass weight of haylage-fed steers. Mixing existing pasture with flaxseed oil-supplemented pellets represents an alternative way to produce lean meat with a balanced n-6 to n-3 fatty acids ratio from dairy steers.
Introduction
Several health problems may arise when n-3 fatty acids (FAs) are imbalanced with respect to n-6 FAs; a higher intake of n-6 FAs in the Western diet is associated with autoimmune and cardiovascular disorders (Simopoulos, Reference Simopoulos2004). Human metabolic pathways can only desaturate and elongate dietary α-linolenic acid (ALA, 18 : 3n-3) into long-chain n-3 FAs with low efficiency (Plourde and Cunnane, Reference Plourde and Cunnane2007). Therefore, EPA (20 : 5n-3) and docosahexaenoic acid (DHA, 22 : 6n-3) are considered essential for the human body. Although long-chain n-3 FAs are mostly derived from marine products, meat from grass-fed ruminants can also contribute to the dietary intake of these FAs in areas where the intake of ruminant meat is higher than that of marine products. The consumption of beef from grass-fed cattle contributes to human daily needs for ALA and long-chain n-3 FAs, such as EPA and DHA (Givens et al., Reference Givens, Khem and Gibs2006). In Western countries, increased daily intake of EPA and DHA (up to 500 mg) is recommended to lower blood triacylglycerol levels and the risks of heart attack, depression and arthritis (Harris, Reference Harris2007).
Animal products have been often associated with cardiovascular disease due to their saturated fatty acid (SFA) contents when it is consumed in excess of need. Saturated fatty acids such as palmitic (C16 : 0) and myristic (C14 : 0) acids are major factors that elevate cholesterol levels and that favor the accumulation of low-density lipoproteins (LDLs), in contrast with dietary stearic (C18 : 0) and oleic (C18 : 1n-9) acids (Bonanome and Grundy, Reference Bonanome and Grundy1988; Zock et al., Reference Zock, de Vries and Katan1994). In ruminants, high levels of SFA are resulted from the biohydrogenation of dietary fats in the rumen. Previous studies have shown that grass intake can decrease the deposition of palmitic acid in the muscle of bovines and can increase n-3 FA levels (Leheska et al., Reference Leheska, Thompson, Howe, Hentges, Boyce, Brooks, Shriver, Hoover and Miller2008, Duckett et al., Reference Duckett, Neel, Lewis, Fontenot and Clapham2013).
In addition to milk, the dairy industry produces beef (from young males, steers or culled cows) as a secondary product. Holstein-Friesian cattle comprise the main milk cow breed globally. This breed is different from beef-producing cattle in terms of dietary energy utilization because it requires more energy than other breeds for maintenance alone (Gareett, Reference Gareett1971). Thus, in this breed, the production efficiency of high-quality beef by finishing on pasture is very low. Extensive systems or grass feeding for finishing the cattle could be an alternative way to avoid high production costs. However, growth performance is not well controlled (Lozier et al., Reference Lozier, Rayburn and Shaw2005). Mixing existing pasture with high-energy n-3-enriched pellets, might improve the nutritional status of the cattle and increase carcass weight. A beneficial effect of feeding a mixed diet on the growth performance of Holstein-Friesian steers was reported by Chung et al. (Reference Chung, Jeon and Chung2016). Therefore, the objective of this study was to observe the effect of such feeding on carcass weight, meat quality and FA composition.
Material and methods
Animals and feeding management
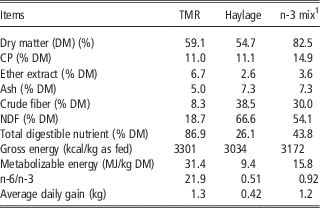
In all, 15 Holstein-Friesian steers were randomly allocated to three treatment groups comprising five animals at the age of 21 months; the animals were grown under similar conditions before the treatments, fed with ad libitum reed canary grass (Phalaris arundinacea) haylage, and animals were randomly allocated to each group pen (3×10 m) with straw bedding and free access to water. Animals were finished on three different diets for 150 days. The first group was fed with 18 kg/day of corn-based total mixed ration (TMR) per animal, representing the conventional high-cost mixed diet ($6.37/animal per day) with a high proportion of linoleic acid (C18 : 2n-6); ad libitum reed canary grass haylage, which was harvested from the area around the producer’s farm with no cost, was fed to the second group as a control (previous feeding practice); and the third group was fed with 6 kg/day of flaxseed oil-supplemented pellets and 9 kg/day of reed canary grass haylage per animal at the as-fed ratio of 40 : 60 (n-3 mix), representing the alternative feeding program ($2.92/animal per day). The nutrient composition of the experimental diets and animal growth performance are shown in Table 1, which were adapted from Chung et al. (Reference Chung, Jeon and Chung2016). The TMR (as fed) comprised corn flake (12.35%), cotton seed meal (5.70%), corn gluten meal (2.80%), oat straw (4.30%), ryegrass (6.80%), brewers’ grains (21.00%), spent mushroom substrate (13.50%), soy pulp (9.40%), mineral premix (0.4%), vitamin premix (0.15%), direct-fed microbials (5.80%) and feed base (17.80%). The n-3-enriched pellets were prepared by mixing wheat grain (19.45%), wheat bran (16.18%), soybean hull (15.00%), palm kernel (11.40%), rapeseed meal (10.44%), tapioca (8.60%), corn gluten meal (5.00%), beet pulp (6.02%), cane molasses (2.00%), flaxseed oil (3.55%), limestone (0.96%), calcium phosphate (0.10%), sodium chloride (0.30%), sodium bicarbonate (0.30%), yeast extract (0.20%) and a vitamin and mineral premix (0.50%).
Nutrient composition of experimental diets and animal growth performance

TMR=total mixed ration.
Data were adapted from Chung et al. (Reference Chung, Jeon and Chung2016).
1 n-3 mix=n-3-enriched pellet and reed canary grass at 40 : 60 as fed ratio.
Blood and meat sampling
All blood samples were collected from the jugular vein by trained veterinarians a week before slaughter using a venipuncture syringe (18G) and a 6-ml vacutainer containing ethylenediaminetetraacetic acid as an anticoagulant. Sampling was performed in the morning and no feed was available a night before. The samples were stored in an ice box during transport to the laboratory. To obtain plasma, the blood was centrifuged at 3000 g for 15 min at 4°C (1248R; LaboGene, Lynge, Denmark). The plasma was subsequently transferred to 2-ml microtubes and stored at −75°C until further analysis.
After being fed the experimental diets for 150 days, the animals (26 months old) were slaughtered at a local abattoir using standard procedures and the carcasses were chilled at 3±1°C for 24 h before deboning. The longissimus lumborum muscle of each animal was removed from the carcasses and meat-quality analyses were conducted at 48 h postmortem. The samples were vacuum-packaged and transported to the laboratory in an ice box. Half of the sample was immediately subjected to physical property analyses, and the remainder was stored at −24°C for later sensory evaluation, proximate composition, iron content and FA composition analyses.
Meat quality analyses
Surface color at 48-h postmortem was recorded by measuring the International Commission on Illumination’s system for lightness (L*), redness (a*) and yellowness (b*) using a Chroma Meter (CR-400; Konica Minolta Sensing Inc., Osaka, Japan) with a closed cone attached. The light source of illuminant C (2° observer) with 8 mm aperture was calibrated using a white plate (Y=93.6, X=0.3134, y=0.3194). Chroma (C*=(a*2×b*2)0.5) was calculated using a data processor (DP-400; Konica Minolta Sensing Inc., Osaka, Japan). Each sample was assessed at five different locations on the meat surface after blooming for 30 min in a chilling room (2±2°C).
To determine cooking loss, 2.5-cm-thick samples were cooked in polyethylene zipper bags by immersion in a water bath at 80°C for 30 min. The cooked samples were then immediately removed from the polyethylene bags, stored overnight at 2±2°C, and weighed. Cooking loss was expressed as the percentage of weight lost during heating. The cooked samples were cut into eight pieces (1×1×1 cm) for each sample and then subjected to texture profile analysis (TPA) and shear force measurement using a TA-XT2i Plus instrument (Stable Micro Systems Ltd, Surrey, UK). To measure shear force, the cut samples were placed on a table under a V blade and were cut through as the blade was moved down at a constant speed through a slit in the table (the assay parameters were as follows: pre-test speed: 2.0 mm/s; test speed: 2.0 mm/s; post-test speed: 5.0 mm/s). A cylindrical 35-mm-diameter probe was used for TPA tests in this study at a compression rate of 80%. The sample was placed under the probe that moved downwards at a constant speed of 2.0 mm/s (pre-test), 1.0 mm/s (test) and 5.0 mm/s (post-test).
The raw samples were ground using a food blender for pH determination. Ground sample, 5 g, was added to 45 ml of distilled water (triplicate samples), and the mixture was homogenized at 10 000 r.p.m. for 60 s using a homogenizer (PH91; SMT Co., Ltd, Tokyo, Japan). The pH value of the homogenized samples was recorded using a pH meter calibrated with acid (pH 4.01) and neutral (pH 7.00) technical buffer solutions (Seven Easy pH; Mettler-Toledo GmbH, Greifensee, Switzerland) at 22°C according to manufacturer’s instruction. The water-holding capacity (WHC) was measured using a centrifugation method adapted from Kristensen and Purslow (Reference Kristensen and Purslow2001). In brief, 5 g of ground sample was weighed into a graduated centrifuge tube, which was then sealed and heated for 30 min in a water bath at 80°C. The tubes were cooled under running water for another 10 min and then centrifuged at 980 g for 10 min at 24°C (1248R; Labogene, Lynge, Denmark). The supernatant was decanted and measured, and the moisture contents of the raw sample and the supernatant were determined using the Association of Official Analytical Chemists (AOAC) (1995) method.
Proximate composition was determined using AOAC official methods (AOAC, 1995). Frozen samples were thawed at 2±2°C overnight. Moisture content was determined by drying the samples in an oven at 105°C for 24 h. Crude fat content was determined by ether extraction using a Soxhlet system. Nitrogen content was determined using the Kjeltec system (2200 Kjeltec Auto Distillation Unit, Foss Tecator, Höganäs, Sweden). Crude protein was calculated as nitrogen content multiplied by 6.25. Ash content was determined by burning the samples in a muffle furnace at 550°C for 8 h within crucibles.
Heme iron content was determined using total pigment (hematin) analysis with modifications (Hornsey, Reference Hornsey1956; Clark et al., Reference Clark, Mahoney and Carpenter1997). In brief, 10 g of sample was weighed into a 50-ml centrifuge tube; the sample was then homogenized with 20 ml of acidified acetone solution comprising acetone (80%), distilled water (18%) and 11.3% hydrochloric acid in distilled water (2%) using a homogenizer (Ultra-Turrax T25 basic; Ika Werke GmbH & Co., Staufen im Breisgau, Germany) operating at 13 500 r.p.m. for 15 s. Then, 20 ml of acidified acetone solution was added. The homogenates were incubated in the dark for 1 h and then centrifuged at 2200 g for 10 min at 4°C (1248). The supernatants were then filtered through a glass microfiber filter (Whatman GF/A; GE Healthcare Life Sciences, Amersham, UK), and the absorbance was measured at 640 nm against a reagent blank using a spectrophotometer (UV-mini-1240; Shimadzu, Kyoto, Japan). The absorbance was multiplied by a factor of 6800 and divided by the sample weight to calculate the concentration of total pigment in the meat as µg hematin/g meat. Iron content was calculated using a conversion factor of 0.0882 µg iron/µg hematin.
Plasma biochemical values and fatty acid composition
Frozen plasma was thawed in a chilling room (2±2°C) for 6 h. Total cholesterol, triglyceride, LDL, high-density lipoprotein (HDL), aspartate transaminase (AST), gamma-glutamyl transpeptidase (GGT), creatine kinase (CK) and alkaline phosphatase (ALP) activities in plasma were analyzed using a chemistry analyzer (BS-400; Mindray, Shenzhen, China).
Fatty acid composition was determined using a gas chromatograph (YL6500; YL Instrument, Anyang, Korea). Plasma and meat lipids were extracted according to Folch et al. (Reference Folch, Lee and Sloane-Stanley1957) in a chloroform–methanol solution (2 : 1 v/v). Each sample was prepared in duplicate. Fatty acids were converted to methyl esters as described (with modifications) by AOAC (1995). In brief, 200 µl of lipid and 2 ml of 2 N NaOH were vortex-mixed and heated at 80°C for 60 min. The samples were cooled by immersion in cold water, vortex-mixed with 2 ml of 25% boron trifluoride in methanol, and heated again at 80°C for 60 min. After cooling for 10 min in cold water, the samples were mixed again with 3 ml of distilled water and 2 ml of hexane, vortexed, and centrifuged at 3000 r.p.m. for 10 min at 4°C (1248R); ~1.5 ml of the upper layer was collected and transferred into a 1.8-ml vial. A sample of 1 μl was injected into the column using the split mode (1 : 5). Fatty acid methyl esters were separated using a SPTM-2560 fused-silica capillary column (100 m×0.25 mm, i.d. 0.20 μm film thickness; Supelco, Inc., Bellefonte, PA, USA) with a helium flow of 1.0 ml/min. The oven temperature was increased from 130°C to 200°C at 7°C/min, held for 10 min, increased again to 250°C at 5°C/min, and finally held for 10 min. The temperatures of the injector and detector were 250°C and 275°C, respectively. Fatty acid peaks were identified and quantified by comparison with the retention time and peak area of FA standards (PUFA No. 2, 47015-U; Supelco, Inc., Bellefonte, PA, USA).
Sensory evaluation
A total of 21 semi-trained panelists, mainly college students, evaluated the sensory attributes of beef (n=5). The sensory evaluations were performed in duplicate for each sample by the sensory panelists. The sensory evaluation comprised two sessions; the attributes of the raw beef were visually evaluated, and all sensory attributes of the roasted beef were evaluated. The samples were individually labeled using three-digit random numbers and were served one at a time in a random order. The samples were rated on 9-point scales. Before presentation to the panelists, the vacuum-packaged frozen steaks (2.5 cm thick) were thawed for 12 h and exposed to air for 30 min at 2±2°C to allow complete blooming. The panelists visually evaluated color (1=extremely pale or dark; 9=extremely bright red), abnormal odor (1=extremely bland; 9=extremely intense), and overall acceptability (1=extremely unacceptable; 9=extremely acceptable) of the raw beef. To evaluate roasted beef, the steaks were roasted on an electric roasting pan (HM-2002; Dongbu Daewoo Electronics, Seoul, Korea) set at 180°C and cooked until an internal temperature of 72°C was reached. The cooked steaks were cut into 2×1×1 cm pieces, placed on aluminum plates, and served immediately to each panelist. Drinking water was provided to clean the palate and remove residual flavors. The roasted samples were evaluated for juiciness (1=extremely dry; 9=extremely juicy), tenderness (1=extremely tough; 9=extremely tender), taste (1=extremely unacceptable; 9=extremely acceptable), off-flavor (1=extremely bland; 9=extremely intense) and overall acceptability (1=extremely unacceptable; 9=extremely acceptable).
Statistical analysis
Data were analyzed using linear mixed model with the ‘lme4’ package in R-version 3.3.2 (The R-foundation for Statistical Computing, Vienna, Austria). The statistical model used was Y=μ+α+ε where Y is the dependent variable, μ the overall mean, α the effect of diet and ε the random error. Instrumental color, shear force value and sensory score of tenderness were further analyzed with carcass weight and meat pH as covariates to observe whether any treatment effects independent of these variables. For sensory evaluation score, the attributes were fitted as dependent variables with panel member as independent term. One-way ANOVA was performed to determine the overall significant differences among the estimated means. Means were compared using Duncan’s multiple range tests at P<0.05 with agricolae’ package.
Results
Carcass weight
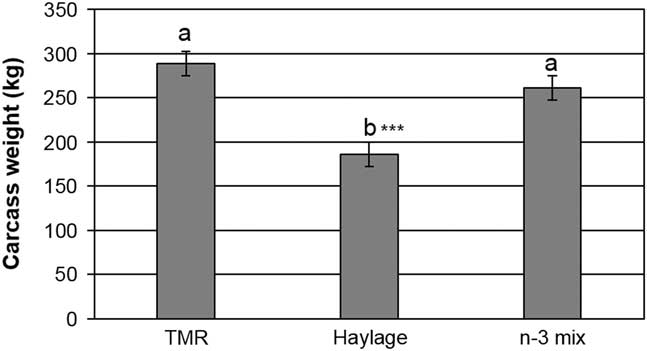
Carcass weight was lowest (P<0.001) in the haylage-fed cattle, and no significant differences were found between the n-3 mix and TMR groups (Figure 1). These results indicate that feeding flaxseed oil-supplemented pellets together with haylage with a 40 : 60 as-fed ratio led to higher growth performance than feeding ad libitum haylage (Table 1); this treatment was as effective as feeding conventional TMR. However, all carcass were under grade for both yield and quality grade according to Korea Institute for Animal Products Quality Evaluation (2011), except one carcass from TMR group received quality grade 3 with back fat thickness of 2 mm, rib eye area of 57 cm2, marbling score of 1 out of 9, meat color of 5 out of 7 and fat color of 2 out of 7.
Carcass weight of Holstein-Friesian steers finished on total mixed ration (TMR), reed canary grass haylage or an n-3-enriched diet (n-3 mix).a,b Means differ significantly between different diets (P<0.001).

Plasma biochemical values
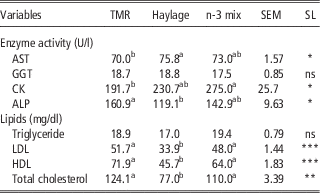
Table 2 shows the plasma biochemical parameters, including metabolism-related enzyme activity and lipid profiles. Regarding plasma enzyme activities, no significant differences were found for GGT activity, although AST, CK and ALP activities differed significantly among the diet groups (P<0.05). Feeding TMR to dairy steers resulted in higher ALP activity but lower AST and CK activities compared with the other treatments. Plasma AST activity was highest in the haylage group, and plasma CK activity was highest in the n-3 mix group. Feeding haylage alone led to lower plasma levels of total cholesterol (including HDL and LDL levels) (P<0.001) compared with feeding TMR or the n-3 mix. However, the diets did not affect plasma triglyceride levels.
Plasma enzyme activity, lipid levels and fatty acid composition of Holstein-Frisian steers finished on total mixed ration (TMR), ad libitum haylage or n-3-enriched diet (n-3 mix)

SL=significance level; AST=aspartate aminotransferase; GGT=γ-glutamyl transpeptidase; ns=not significant; CK=creatine kinase; ALP=alkaline phosphatase; LDL=low-density lipoprotein; HDL=high-density lipoprotein.
a,b,cMeans differ significantly between different diets.
*P<0.05, **P<0.01, ***P<0.001, P>0.05 (ns).
Meat physicochemical attributes
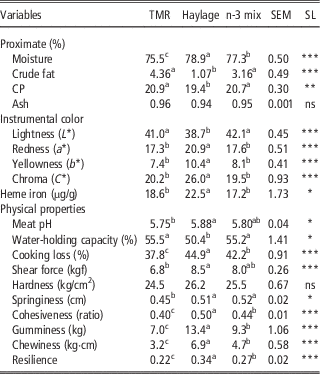
The effects of the diets on meat proximate composition and physical properties are shown in Table 3. Diets did not affect beef ash content. Haylage-fed beef had the highest moisture content, followed by the n-3 mix-fed and TMR-fed beef (P<0.001). No differences in crude fat and CP content were found between the beef of TMR-fed and n-3 mix-fed cattle; however, these variables were lowest in haylage-fed beef.
Meat quality properties of Holstein-Frisian steers finished on total mixed ration (TMR), ad libitum haylage or n-3-enriched diet (n-3 mix)

SL=significance level; ns=not significant.
a,b,cMeans differ significantly between different diets.
*P<0.05, **P<0.01, ***P<0.001, P>0.05 (ns).
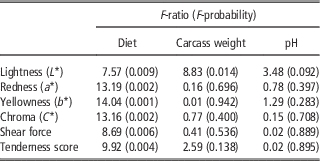
Diet influenced instrumentally measured lightness, redness, yellowness and chroma or color intensity (P<0.001). Haylage-fed beef was darker, exhibiting deeper red and yellow colors than the other samples; no significant differences in color were found between the TMR-fed and n-3 mix-fed beef. Diet and carcass weight were found having significant effects on lightness (Table 4). This indicates that low energy supplied by the haylage and low carcass weight impacted L* value. Heme iron content was higher in haylage-fed beef than the other samples (P<0.05), and heme iron content did not differ between the TMR-fed and n-3 mix-fed beef.
Effect of diet, meat pH and carcass weight on instrumental color attributes, shear force value and tenderness score

Treatments affected meat pH (P<0.05), WHC (P<0.05), cooking loss (P<0.001), shear force or tenderness (P<0.001), texture profile including springiness (P<0.05), cohesiveness, gumminess, chewiness and resilience (P<0.001) without any impact on hardness. Haylage-fed beef tended to higher meat pH, lower WHC, and higher cooking loss than beef from the TMR- and n-3 mix-fed groups. Cooked beef of the TMR-fed cattle was more tender (lower shear force) and less cohesive, gummy, chewy and resilient than the other groups.
Plasma and meat fatty acid composition
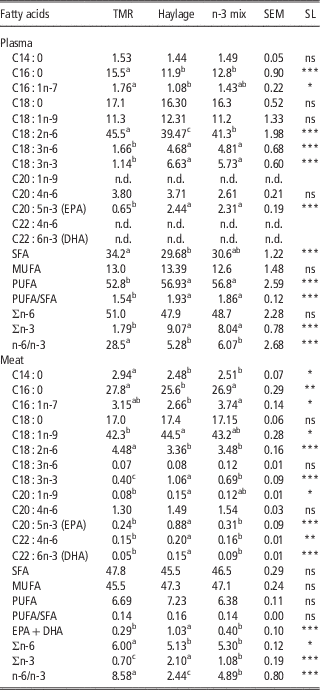
Although the differences between the treatments did not affect plasma monounsaturated fatty acid (MUFA) (Table 5), the haylage-fed cattle had a lower plasma palmitoleic acid (C16 : 1n-7) than the other groups (P<0.05). Feeding haylage alone or n-3 mix led to a lower proportion of SFA in plasma than did the TMR (P<0.001). Plasma polyunsaturated fatty acid (PUFA) did not significantly differ between the n-3 mix and haylage groups. Therefore, the PUFA to SFA ratio was higher in the haylage and n-3 mix groups than in the TMR group (P<0.001). Plasma palmitic acid (C16 : 0) was the only SFA whose the proportion was significantly affected by the treatments (P<0.001). The highest proportion of palmitic acid was found in the plasma of TMR-fed cattle, and no differences in palmitic acid were observed between the haylage-fed and n-3 mix-fed cattle. Diet affected the plasma n-6 to n-3 FA ratio (P<0.001). The highest plasma n-6 to n-3 FA ratio was observed in the TMR-fed cattle; no differences in this ratio were found between the haylage-fed and n-3 mix-fed cattle. Total plasma n-6 FA (including arachidonic acid (C20 : 4n-6)) did not differ significantly among the diet groups. However, feeding TMR led to a higher proportion of plasma linoleic acid (C18 : 2n-6) than n-3 mix and haylage, respectively. γ-Linolenic acid (C18 : 3n-6) was higher in the haylage and n-3 mix groups than in the TMR group. Feeding haylage alone or n-3 mix led to higher proportion of total plasma n-3 FAs as well as higher individual n-3 FAs, including ALA and EPA compared with feeding TMR to dairy steers (P<0.001).
Plasma and meat fatty acid composition (%) of Holstein-Frisian steers finished on total mixed ration (TMR), ad libitum haylage or n-3-enriched diet (n-3 mix)

SL=significance level; ; ns=not significant; SFA=saturated fatty acids; MUFA=monounsaturated fatty acids; PUFA=polyunsaturated fatty acids; n.d.=not detected.
a,b,cMeans differ significantly between different diets.
*P<0.05, **P<0.01, ***P<0.001, P>0.05 (ns).
The effects of the experimental diets on meat FA composition were also determined, and no significant differences were found for total SFA, MUFA, PUFA and the PUFA to SFA ratio. Among meat FA, eicosenoic acid (C20 : 1n-9), adrenic acid (C22 : 4n-6) and DHA (C22 : 6n-3) were not detected in the plasma. Stearic acid (C18 : 0) was the only SFA that was unaffected by diet; feeding TMR to dairy steers led to higher myristic acids (C14 : 0) in beef than feeding the other experimental diets. Haylage-fed beef contained the lowest proportion of palmitic acid, and no significant differences in palmitic acid were found between the TMR-fed and n-3 mix-fed beef. The haylage-fed beef exhibited higher oleic acid (C18 : 1n-9) and eicosenoic acid but lower palmitoleic acid than the others. Linoleic acid contributed significantly to the higher level of total n-6 FA in the TMR-fed beef (P<0.001), and no differences in linoleic acid and total n-6 FA were found between the haylage-fed and n-3 mix-fed beef. Diet influenced the proportions of n-3 FAs in beef very significantly (P<0.001); ALA was predominant in haylage-fed beef; lower proportion was found in n-3 mix-fed beef, and TMR-fed beef contained the lowest proportion. Eicosapentaenoic acid and DHA were predominant only in Haylage-fed beef, whereas no differences were found between two mixed-diet groups. These effects resulted in highly significant differences in the n-6 to n-3 FA ratio among the beef groups (P<0.001). The highest n-6 to n-3 FA ratio was observed in TMR-fed beef, and the lowest ratio was found in haylage-fed beef. The ratio was higher in n-3 mix-fed beef than in haylage-fed beef, but this ratio remained significantly lower than that found in the TMR-fed beef.
Meat sensory quality
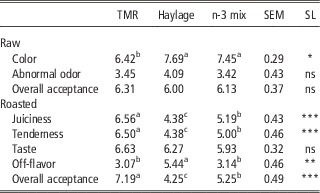
The sensory scores of raw and roasted strip loin are shown in Table 6. For raw beef, the color of the haylage-fed and n-3 mix-fed beef was scored higher than the TMR-fed beef (P<0.05). Significant differences were not found for abnormal odor, and the scores represented desirable freshness and overall acceptance by the panelists. After roasting, the TMR-fed beef was scored higher for juiciness, tenderness and overall acceptance, followed by the n-3 mix-fed beef. Haylage-fed beef had the lowest acceptance and was considered as having a stronger off-flavor and being less juicy and tender than the other beef groups. However, no significant effect of diet on taste was observed.
Sensory scores of raw and roasted strip loin from Holstein-Frisian steers finished on total mixed ration (TMR), ad libitum haylage or n-3-enriched diet (n-3 mix)

SL=significance level; ns=not significant.
Scores description: color (1=extremely pale or dark; 9=extremely bright red), abnormal odor (1=extremely bland; 9=extremely intense), overall acceptability (1=extremely unacceptable; 9=extremely acceptable), juiciness (1=extremely dry; 9=extremely juicy), tenderness (1=extremely tough; 9=extremely tender), taste (1=extremely unacceptable; 9=extremely acceptable), off-flavor (1=extremely bland; 9=extremely intense).
a,b,cMeans differ significantly between different diets.
*P<0.05, **P<0.01, ***P<0.001, P>0.05 (ns).
Discussion
No serious health problems were found in the animals during the finishing period according to the normal activities recorded for AST, GGT, CK and ALP; however, diet did affect the activity of these enzymes, with the exception of GGT. These markers are used to indicate energy balance, growth performance, muscle and bone injury and hepatic function. The higher ALP activity observed for the TMR group, followed by the n-3 mix group, can be explained by the higher growth rate of these animals compared with the haylage group because ALP is an indicator of bone growth or osteoblast activity in growing animals (Sato et al., Reference Sato, Onda, Kato, Ochiai, Kawai, Iriki, Kaneko, Yamazaki and Wada2013). Feeding the cattle a high-energy mixed diet increased plasma cholesterol levels but maintained triglyceride levels as high as that found when feeding haylage ad libitum. Kim and Suh (Reference Kim and Suh2003) reported that serum cholesterol is negatively associated with energy deficiency and suggested that this lipid is a useful predictor of energy balance status in cattle. Lower plasma cholesterol levels in haylage-fed cattle might be associated with energy deficiency and low growth performance. In contrast, higher plasma SFA level in TMR-fed cattle might be associated with higher energy intake than that of other groups.
Haylage-fed beef was markedly leaner and to have higher moisture to protein ratio, less fat and less protein compared with beef from the TMR and n-3 mix groups, suggesting that feeding haylage ad libitum did not fulfill the energy requirements for muscle growth and fat deposition; using a concentrate-based diet is more likely to be an effective way to finish Holstein cattle. Considering the daily feed cost, feeding TMR in order to achieve Korean beef carcass standard (highly marbled beef) was not efficient in current study. Jeong et al. (Reference Jeong, Oh, Seong, Cho, Kang, Kim, Jeong, Lee and Park2012) found no differences in meat quality between Korean native cattle (Hanwoo) and Holstein steers that were finished under similar conditions on a high-energy diet for 6 months. However, the nutrient composition and daily intake of the conventional diet (TMR) used in this study differed from those of the diets that are commonly used for Hanwoo fattening programs in Korea (Panjono et al., Reference Panjono, Kang, Lee and Lee2009). Moreover, feeding haylage ad libitum led to lower WHC, higher cooking loss and higher shear force values than those observed for the TMR and n-3 mix groups. In case of meat pH, no differences were found between n-3 mix-fed beef and haylage-fed beef. Apaoblaza et al. (Reference Apaoblaza, Matarneh, England, Scheffler, Duckett and Gerrard2016) mentioned that cattle finished on grass yielded higher final pH values and more oxidative metabolic profiles than cattle finished on grain or high-energy diets. The typical dark, red, highly yellow and deep color of haylage-fed beef is consistent with previous finding (Realini et al., Reference Realini, Duckett, Brito, Rizza and Mattos2004). Heme iron levels in haylage-fed beef might explain why a redder surface color appeared after 30 min of blooming. Priolo et al. (Reference Priolo, Micol and Gabriel2001) mentioned that grazing ruminants obtained more iron in their diet (grass), resulting in their meat being redder and darker than that of grain-fed cattle; the yellow color is due to the high intake of β-carotene, which is derived from plants.
Sensory panelists preferred deep red raw beef from the haylage-fed and n-3 mix-fed cattle. However, roasted lean beef from the haylage-fed cattle was considered less desirable and to have a less tender, more cohesive, gummy and chewy texture than the meat of the cattle fed the other diets. The lower tenderness and juiciness of the roasted haylage-fed beef might be the most important reasons for its lower acceptance because tenderness is the most important trait of beef for Korean consumers (Cho et al., Reference Cho, Kim, Park, Seong, Kang, Kim, Jung, Im and Kim2010). Regarding overall meat quality parameters, the n-3 mix-fed beef was scored as intermediate between the highest quality (TMR-fed) beef and the lowest quality (haylage-fed) beef. That is, the inclusion of flaxseed-supplemented pellets improved the quality of haylage-fed beef.
No significant differences were found in the proportions of meat SFA, MUFA and PUFA levels and PUFA to SFA ratio were found in the present study; these findings are consistent with previous findings in Rubia Gallega and Charolais steers (Scollan et al., Reference Scollan, Choi, Kurt, Fisher, Enser and Wood2001, Varela et al., Reference Varela, Oliete, Moreno, Portela, Monserrat, Carballo and Sánchez2004). However, SFA levels were slightly higher in TMR-fed beef but not significant. In particular, haylage-fed beef contained lower levels of myristic and palmitic acid, which are the main contributors to elevated cholesterol levels in human blood (Moloney et al., Reference Moloney, Mooney, Kerry and Troy2001); haylage-fed beef also presented higher proportions of ALA, EPA, DHA and total n-3 FA in meat. The conventional corn-based TMR used in this study contained 42.76% linoleic acid (Chung et al., Reference Chung, Jeon and Chung2016) and significantly increased the proportion of linoleic acid in both plasma and meat. Lean meat contains more phospholipid than neutral lipid and most PUFAs (both n-6 and n-3 FA) are mostly stored in the form of phospholipids in the cell membrane (Wood et al., Reference Wood, Enser, Fisher, Nute, Sheard, Richardson, Hughes and Whittington2008; Bessa et al., Reference Bessa, Alves and Santos-Silva2015); this suggests that the enrichment of lean beef with n-3 FA is possible. Fortin et al. (Reference Fortin, Julien, Couture, Dubreuil, Chouinard, Latulippe, Davis and Thivierge2010) found that increasing menhaden oil supplementation linearly increased the deposition of long-chain n-3 FA in the total membrane phospholipids of muscle in growing steers. Scollan et al. (Reference Scollan, Choi, Kurt, Fisher, Enser and Wood2001) reported that unfavorable n-6 to n-3 ratios in meat are caused by feeding high levels of linoleic acid during fattening, whereas for lean beef production, the inclusion of forage in the diet enhances n-3 FA concentrations because forages are a good source of ALA. These results confirm that haylage feeding can enhance total n-3 FA in beef from dairy steers. Disadvantageously, the beef containing higher n-3 FA in this study exhibited an off-flavor after being roasted and was considered less tender and juicy than beef from other treatments. Among mixed-diet groups, TMR-fed beef was more acceptable with better juiciness and tenderness than n-3 mix-fed beef. Tansawat et al. (Reference Tansawat, Maughan, Ward, Martini and Cornforth2013) reported that beef raised using pasture feeding tended to contain higher n-3 FA than grain-fed beef and released hexadecanoic acid methyl ester after being cooked, which was associated with bitter flavor. Although no significant differences in taste were found in this study, the observed trend indicates that haylage-fed beef tended to be less acceptable than the other beef samples.
Conclusion
Feeding mixed diet (TMR or n-3 mix) fulfilled the energy requirement of Holstein-Friesian steers more than feeding haylage alone, marked by an improvement of the carcass weight. Diet comprising flaxseed oil-supplemented pellets and reed canary grass (P. arundinacea) haylage at an as-fed ratio of 40 : 60 (n-3 mix) resulted in a higher proportion of meat n-3 FA, particularly ALA, than feeding TMR. However, no significant differences were found on long-chain n-3 FA between these two diet groups. On the other hand, feeding TMR resulted in better meat quality and sensory acceptance than the others. According to daily feed cost, carcass weight and n-6 to n-3 FAs ratio, the n-3 mix diet could be beneficial for the production of n-3-enriched beef.
Acknowledgment
This research was supported by High Value-added Food Technology Development Program with grant no. 114028-02 from Ministry of Agriculture, Food and Rural Affairs, Republic of Korea.