Introduction
Integrated crop–livestock production is not common in modern agricultural production systems for a number of reasons. Technological advances in plant genetics, machinery and synthetic chemicals, as well as shifting government policies during the past century are the primary reasons that agriculture has been transformed from small, diversified farming operations to large specialized production facilities. Despite this change, a growing awareness is emerging that the stability and resiliency of modern agricultural landscapes are now becoming impaired by this shift to enterprise specialization, concentration of operations, and expansion of scale. Energy and nutrient cycles are becoming spatially and temporally compartmentalized in a manner far removed from natural ecosystem cyclingReference Gates1. There is a need to rediscover the mechanisms and attributes of integrated crop–livestock production systems to (1) enable more efficient utilization of natural resources (sunlight, water, biologically fixed N, and recycled nutrients), (2) exploit natural pest control phenomena, (3) reduce nutrient concentration and consequent environmental risk, and (4) improve soil functioning and productivityReference Gliessman2.
Soil organic matter is a critical component in maintaining soil qualityReference Follett, Stewart and Cole3. Pastures are known to increase soil organic matter quantity due to large input of residues and lack of disturbanceReference Franzluebbers, Stuedemann, Schomberg and Wilkinson4, which could lead to retention of organically bound nutrients and improved water relations in soil. Cropping systems under conditions of high soil organic matter have not been evaluated in the Southern Piedmont, USA, because much of the cropland has been degraded by historical cropping that caused excessive soil erosionReference Langdale, West, Bruce, Miller and Thomas5. Crop responses to tillage management following pasture termination may be significantly different than responses on previously degraded land, because of the presence of a large storage of nutrients, soil biological potential and improved soil physical structure.
Yield of crops as affected by tillage management in the southeastern USA has been investigated previously in several studies. A general recommendation has been hampered by the diversity of yield responses to tillage obtained. Yield reduction with NT compared with CT has been observed for sorghum in TexasReference Franzluebbers, Hons and Saladino6, wheat stover in TexasReference Franzluebbers, Hons and Saladino6, and wheat grain in North CarolinaReference Wagger and Denton7 and South CarolinaReference Karlen and Gooden8. Equivalent yield between conventional tillage (CT) and no tillage (NT) has been observed for wheat grain in TexasReference Franzluebbers, Hons and Saladino6 and South CarolinaReference Frederick and Bauer9. Yield enhancement with NT compared with CT has been observed for sorghum in GeorgiaReference Langdale, Hargrove and Giddens10, for corn in North CarolinaReference Cassel and Wagger11, GeorgiaReference Hargrove12, and AlabamaReference Edwards, Thurlow and Eason13, and for wheat in South Carolina (when preceded by deep ripping)Reference Cassel and Wagger11. The diversity of yield responses to tillage suggests that any NT advantage would be more likely to occur with summer grain crops than with winter grain crops.
The effect of tillage system on cover crop production has been previously investigated to a limited extent. On a Typic Rhodudult in Georgia, rye cover crop production was 5.9 Mg ha−1 under CT and 8.5 Mg ha−1 under NT during 2 yearsReference Groffman, Hendrix and Crossley14. However, crimson clover (Trifolium incarnatum L.) cover crop production was lower under NT (3.6 Mg ha−1) than under CT (5.7 Mg ha−1). On a Plinthic Paleudult in Georgia, hairy vetch (Vicia villosa Roth.) cover crop production was 4.6 Mg ha−1 under moldboard plowing and 4.8 Mg ha−1 under NT during 2 yearsReference Sainju and Singh15. In this same study, winter annual weed production without a planted cover crop was 1.8 Mg ha−1 under moldboard plowing and 1.3 Mg ha−1 under NT. Cover crops have typically been incorporated into contemporary cropping systems only in combination with conservation tillage to obtain surface residue accumulationReference Schwab, Reeves, Burmester and Raper16.
Climatic conditions in the Southern Piedmont are characterized by excessive precipitation to potential evapotranspiration during the winter growing season, but during the summer growing season precipitation is similar to potential evapotranspiration. The impact of time of grain cropping (i.e., winter versus summer) on grain yield and forage availability has not been directly evaluated, especially under conditions of initially high soil organic matter. Under a double-cropping environment in the southeastern USA, a cover crop following grain cropping could provide high-quality forage to supplement shortages from potential perennial pasture.
Animals grazing cover crops could compact soil due to excessive animal traffic, especially when the soil is wet. Tollner et al.Reference Tollner, Calvert and Langdale17 observed compaction from cattle traffic in a Southern Piedmont soil with low soil organic matter. However, surface residue cover may provide a significant buffer against animal trampling effects, such that NT crop production following long-term pasture could alleviate the negative effects of animal trampling.
We hypothesized that winter grain production would be more reliable than summer grain production due to milder temperature and less risk from drought. It is possible that time of grain production could interact with tillage management, such that NT might have a positive impact on summer grain production, but a negative impact on winter grain production due to lower temperature and excessive soil moisture. It is also more likely that winter grazing of a cover crop could compact soil compared with summer grazing, especially under CT. We conducted this study to assist crop and animal producers in determining the appropriate timing for grazing and tillage management to optimize crop production without degrading soil and water resources.
Materials and Methods
The experiment was located at the US Department of Agriculture (USDA)-Agricultural Research Service J. Phil Campbell Sr. Natural Resource Conservation Center in Watkinsville, GA (33° 62′ N, 83° 25′ W) on Cecil sandy loam (fine, kaolinitic, thermic Typic Kanhapludult). Soil was moderately acidic (pH∼6) and contained moderate total N (1.2 g kg−1) in the upper 20 cm. The experimental design was a completely randomized arrangement of 16 main plots. Main plots were a factorial arrangement of (a) tillage and (b) time of grain/cover cropping, which were replicated four times. Main plots were split into grazed (0.5 ha) and ungrazed (0.2 ha) cover crop treatments. A total of 16 main plots and 32 split plots were evaluated from May 2002 to October 2005.
Previously, the experimental area was in tall fescue [Lolium arundinaceum (Schreb.) S.J. Darbyshire] for 20 years. Unfertilized pasture growth during the three years just prior to the experiment was expected to remove differences in residual inorganic soil N among paddocks. All paddocks received dolomitic limestone (2.2 Mg ha−1) immediately prior to termination of the tall fescue. The 16 experimental paddocks were regarded as an excellent starting point for the proposed research, because soil organic matter was at a high levelReference Franzluebbers and Stuedemann18 and grazing infrastructure was mostly in place at the site (fencing, gates, shades, mineral feeders, watering troughs, and animal handling facility).
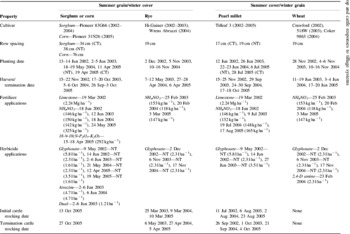
Tillage systems were: (1) conventional disk tillage (CT) following harvest of each grain and cover crop and (2) NT with glyphosate to control weeds prior to planting. Tillage treatments were initiated in May 2002. Initial CT treatment consisted of moldboard plowing to a depth of 25–30 cm. Disk plowing only to a depth of 15–20 cm occurred in subsequent years. Pasture was terminated in the NT treatment with two applications of glyphosate (Table 1).
Crop management inputs and characteristics from 2002 to 2005 at Watkinsville GA.

CT is conventional tillage and NT is no tillage.
Cropping systems were: (1) winter grain cropping [wheat (Triticum aestivum L.); November planting and May/June harvest] with summer cover cropping {pearl millet [Pennisetum glaucum (L.) R. Br.]; June/July planting and September/October termination} and (2) summer grain cropping {grain sorghum [Sorghum bicolor (L.) Moench] or corn (Zea mays L.); April to June planting and September/October harvest} with winter cover cropping [cereal rye (Secale cereale L.); November planting and May termination]. Management details of each crop are reported in Table 1. Sorghum, rye, wheat, and pearl millet were planted with a John Deere grain drill for CT and a Great Plains drill for NT.
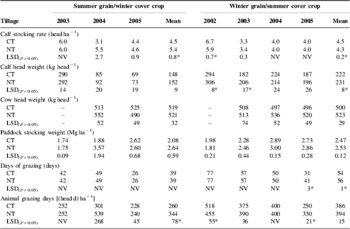
Cover crop management was: (1) no grazing and (2) grazing with cattle to consume 90% of available forage produced. Cover crops were stocked with yearling Angus steers in the summer of 2002 and in the spring of 2003 (Table 1). Thereafter, cow/calf pairs were used to simulate a more typical regional management approach. Stocking rates and weights are reported in Table 2. Ungrazed cover crops were grown until approx. 2 weeks prior to planting of the next crop and either (1) mowed prior to CT operations or (2) mechanically rolled to the ground in the NT systemReference Ashford and Reeves19.
Cattle stocking characteristics averaged across the entire grazing period in two cropping systems managed with CT and NT.

NV is no variance.
* Next to LSD value indicates significance between tillage means.
Application of N was relatively low during the first 3 years, but was adequate to assure early plant growth and development with further growth dependent upon the mineralization of stored nutrients in soil organic matter. Extractable P and K concentrations in the surface 7.5 cm of soil were ⩾100 mg P kg−1 soil and 400 mg K kg−1 soilReference Schomberg, Stuedemann, Franzluebbers and Wilkinson20; levels considered adequate for crop production.
Early-season plant population of crops was determined by counting the number of plants in two adjacent rows 1 m long at three locations in ungrazed plots and five locations in grazed plots. Plant populations were not determined during the first year of this study.
Grain yield was determined by weighing the contents of the entire experimental unit harvested with a field combine followed by unloading onto a truck with scales placed under all tires. A subsample of grain was collected for moisture determination and protein concentration (calculated as 6.25×N concentration). Grain yield was adjusted to an oven-dried basis (55°C, ⩾72 h). Standing grain-crop dry matter following grain harvest was determined from 0.15×1-m areas (three areas in ungrazed plots and five areas in grazed plots). Cover-crop above-ground dry matter was collected in the same manner. Hand-harvested yield was determined for wheat in 2004 from 0.38-m2 areas, for sorghum in 2004 from 0.76-m2 areas, and for corn in 2005 from 4.56-m2 areas in each plot and separated into grain and stover components. Grain, stover and forage components were weighed before and after oven drying (55°C).
A variable stocking rate was used to consume ⩾90% of available forage from each paddock. Stocking was targeted so that grazing could last for at least a month. Since grazing was initiated when cover crops were 0.3–0.5 m tall and actively growing, stocking estimates from experienced animal scientists were used rather than quantitative measures. Performance and production were determined from periodic weighing of cattle (2.4±1.4 times per grazing season with 20±11 days in each period). Cattle shrunk weight during each handling event was determined by not offering water for 16 h (evening prior to next day handling), herding animals into the nearby handling facility in the morning, and weighing of animals on a balance under a cattle chute. Cattle gain ha−1 was calculated as the difference in initial and final weight of all cattle placed on a paddock during a grazing season. Average daily gain was calculated from total weight gain divided by the number of cattle and grazing days in a season.
The general linear model procedure of SAS was used to analyze variances for each of the plant and animal responses during each growing season separately21. Means across years were analyzed for variance, with year as a random variable in the error term. Significant differences among means were declared at P⩽0.05, unless otherwise indicated. Only a priori contrasts between cover crop treatments within a tillage system and between tillage systems with a cover crop management were considered.
Results and Discussion
Crop establishment
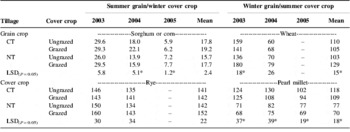
Establishment of most crops was not affected by tillage and cover crop management, except for pearl millet, corn and wheat (Table 3). Pearl millet population under NT was 66±9% of that under CT during the 3 years of evaluation. One reason for the lower plant population with NT compared with CT may have been due to poorer seed-to-soil contact in the surface residue layer as a result of the need for shallow planting of the small seed. Also, occasional flocks of birds may have consumed seeds or seedlings when foraging in the residue-rich surface soil immediately following planting. Lower early-season pearl millet population under NT than under CT, however, was not a hindrance to successful cover crop dry matter accumulation (Table 4). These results suggest that pearl millet could possibly be planted at lower density than the 13–17 kg ha−1 rate that was targeted in this study.
Early-season population (plants m−2) of grain and cover crops in two cropping systems varying in tillage system (CT and NT) and cover crop management (with and without cattle grazing).

Populations were determined for sorghum on 28 June 2003 and 18 June 2004, for corn on 29 April 2005, for wheat and rye on 12 December 2003 and 8 February 2005, and for pearl millet on 14 July 2003, 8 July 2004 and 16 August 2005.
A priori mean comparisons are between tillage systems within a cover crop management or between cover crop management within a tillage system.
* Next to LSD value indicates significance in at least one of these comparisons.
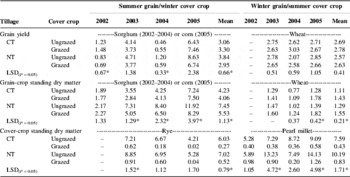
Grain yield, standing grain-crop dry matter, and cover-crop dry matter (Mg ha−1) in two cropping systems varying in tillage system (CT and NT) and cover crop management (with and without cattle grazing).

A priori mean comparisons are between tillage systems within a cover crop management or between cover crop management within a tillage system.
* Next to LSD value indicates significance in at least one of these comparisons.
The only other major tillage effect was that the corn population under NT in 2005 was 23±2% greater than under CT (Table 3). The water conservation benefit of NT compared with CT may have contributed to this effect, as well as the fact that corn was planted a week earlier under NT than under CT (Table 1). The earlier planting date was a consequence of greater preparation time required for CT planting.
The only cover crop management effect on plant population occurred with wheat (Table 3). More plants were established with grazing than without grazing of cover crops under NT in 2003. Inhibition of seedling emergence could have occurred with the large amount of pearl millet residue at the soil surface, because of either a mechanical cause at planting from residue impeding penetration of planting equipment into the soil or from a biochemical cause at seedling emergence due to presence of allelopathic compoundsReference Saxena, Singh and Joshi22.
Summer grain-crop production
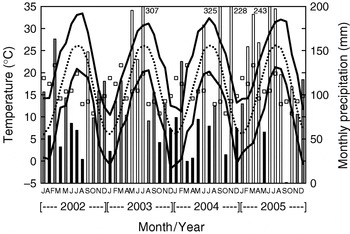
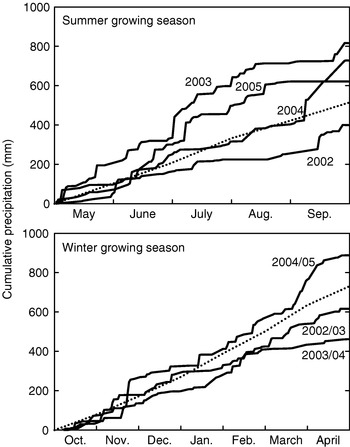
Summer grain-crop production was highly variable from year-to-year (Table 4). Precipitation from May to September was also highly variable (Figs. 1 and 2). During 2002, precipitation from sorghum planting to grain filling in mid September was only 121 mm, well below that needed to produce a crop. Sorghum production during 2003 was more typical of the regional average, and was not affected by tillage or cover crop management. Sorghum production in 2004 was again very low, because of late-season precipitation in September (Fig. 2), which caused lodging and made it difficult to harvest grain. The switch to corn production in 2005 (because of poor performance of sorghum in previous years) resulted in very good grain yield, but there was no effect of tillage or cover crop management.
Monthly temperature and precipitation near Watkinsville, GA from 2002 to 2005. Solid lines are observed minimum and maximum temperatures and dotted line is the long-term (1945–2003) mean temperature. Vertical bars are observed monthly precipitation, and squares are long-term mean precipitation. Vertical bars that are gray-shaded are within 75–125% of mean precipitation. Vertical bars that are black are <75% of mean precipitation. Vertical bars that are unfilled are >125% of mean precipitation. Data from the Georgia Automated Environmental Monitoring Network (www.georgiaweather.net).

Cumulative precipitation in summer and winter growing seasons from 2002 to 2005 at Watkinsville, GA. Dotted line is long-term mean cumulative precipitation. Data from the Georgia Automated Environmental Monitoring Network (www.georgiaweather.net).

The effect of tillage on grain yield was significant in 2 of 4 years (Table 4). Sorghum grain yield was negatively affected by NT compared with CT in 2002, but was positively affected by NT compared with CT when the cover crop was not grazed in 2004. The effect of cover crop management was significant only in 2004 under NT, in which grazing of cover crop led to lower sorghum grain yield than when cover crop was not grazed. The 4-year mean grain yield was greater under NT than under CT when the rye cover crop was not grazed. In addition, the 4-year mean grain yield was lower when rye was grazed than left ungrazed, but only under NT. The accumulation of surface plant residue under NT appears to have been more important for summer grain production than processing of cover crop into animal manure. Soil water conservation under a mulch of surface residues probably benefited plant production during the summerReference Hatfield, Sauer and Prueger23. Further research is needed to better understand the interaction between tillage and cover crop management on summer grain yield.
Hand-harvested sorghum grain yield in 2004 (Table 5) was 8.4±2.4 times greater than grain yield from commercial-sized farm machinery (Table 4). Hand-harvested corn yield in 2005 was 48±6% higher than by combine. For sorghum, the large discrepancy between hand- and machine-harvested estimates was due to late-season precipitation that flattened the maturing crop. For corn, higher hand-harvested yield than machine yield was due to grain loss through the machine. Grain-to-whole plant ratio of sorghum in 2004 was 0.48 and of corn in 2005 was 0.56 (Table 5).
Hand-harvested yield components of three grain crops managed with either CT or NT and with or without cattle grazing of cover crops.

A priori mean comparisons are between tillage systems within a cover crop management or between cover crop management within a tillage system.
* Next to LSD value indicates significance in at least one of these comparisons.
Hand-harvested yield of sorghum stover in 2004 (Table 5) was very similar in magnitude to the sorghum standing in the field after combine harvest (Table 4). Standing, summer-crop dry matter after harvest averaged 2.0 Mg ha−1 in 2002, 4.7 Mg ha−1 in 2003, 5.9 Mg ha−1 in 2004, and 8.7 Mg ha−1 in 2005. Standing summer-crop dry matter was not affected by tillage in 2002, but was significantly greater under NT than under CT in all other years. The 4-year mean values followed the order: NT-ungrazed>NT-grazed>CT-ungrazed=CT-grazed. It appears likely that a soil water conservation effect contributed to higher production with NT compared with CT and, under NT, with surface crop residue accumulation compared with grazed condition.
The results for summer crop grain yield in this study were in general agreement with previous studies, in which grain yield was positively affected by NT compared with CTReference Langdale, Hargrove and Giddens10–Reference Hargrove12. However, there is little available literature describing the effect of grazing cover crops on subsequent grain yield. Our results indicate that grazing of rye as a winter cover crop negatively affected 4-year mean summer grain and stover production under NT, but not under CT (Table 4).
Winter grain-crop production
Winter wheat production was highly uniform, both among years and within years among treatments (Table 4). Tillage and cover crop management had no effect on wheat grain yield in any year. Precipitation was nearly as variable in winter as in summer (Fig. 2), but the low evaporative demand allowed wheat to develop successfully despite differences in precipitation. Variation in wheat grain yield among years (8%) was much lower than variation in summer grain yield (85%). Mean wheat grain yield averaged 2.7 Mg ha−1, while summer grain yield averaged 3.3 Mg ha−1. These data support the hypothesis that winter grain production would be more uniform, but lower in potential, than summer grain production, as a result of differences in climatic conditions between winter and summer.
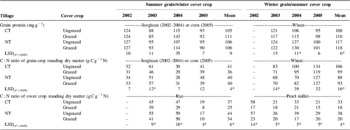
Standing wheat dry matter after harvest was greater with grazed than with ungrazed cover crop in 2005 and when averaged across years, independent of tillage system (Table 4). This cover crop management effect may have been due to either (1) enhanced nutrient availability to wheat with processing of summer cover crop dry matter through grazing cattle as manure or (2) inhibition of wheat growth from unaltered summer cover crop dry matter accumulation. Potential inhibition of wheat stover production could have been from a biochemical cause resulting from either (1) presence of allelopathic compounds in pearl millet or (2) enhanced immobilization of N from mature pearl millet residue straw (although C:N ratio of mature, ungrazed pearl millet residue among years was moderate at 36±15 g g−1; Table 6). Potential inhibition of wheat stover production could have also been physical, at least under NT, resulting from cooler and wetter soil conditions that were likely under heavy mulch residue.
Grain protein concentration and C:N ratio of plant residues in two cropping systems managed with either CT or NT and with or without cattle grazing of cover crops.

A priori mean comparisons are between tillage systems within a cover crop management or between cover crop management within a tillage system.
* Next to LSD value indicates significance in at least one of these comparisons.
Hand-harvested wheat yield components in 2004 suggested that 32±20% of wheat grain may have been left in the field, as a result of machine inefficiency (Tables 4 and 5). Standing wheat dry matter (Table 4) would also have to be considered a minimum value, since hand-harvested yield of wheat stover (Table 5) was 4.0±0.5 times greater than machine-harvested stover in 2004 (Table 4). Grain-to-whole plant ratio of wheat averaged 0.45 and was highest under CT when the cover crop was not grazed.
Winter grain crop yields in this study were in general agreement with previous studies, in which grain yield was little affected by tillage systemReference Langdale, West, Bruce, Miller and Thomas5,Reference Langdale, Hargrove and Giddens10–Reference Hargrove12. There is no known literature describing the effect of grazing summer cover crops on subsequent wheat grain yield. Our results indicate that grazing of pearl millet as a summer cover crop could enhance wheat stover production and have no detrimental effect on wheat grain yield. Tanaka et al.Reference Tanaka, Karn, Liebig, Kronberg and Hanson24 observed that swath grazing by cattle increased forage and grain production compared with cropping systems without cattle during the 4th year of a study in North Dakota. Additional crop responses to grazing of cover crops under different soil and crop management conditions are needed to bolster these results prior to making wide-scale recommendations.
Grain protein
Protein concentration of harvested grain varied from year-to-year and among crops. Across years and crops (wheat, sorghum, and corn), grain protein concentration was 108±16 mg g−1. Grain protein concentration was little affected by tillage and cover crop management, except for wheat in 2004 (Table 6). Wheat grain protein concentration was greater under NT than under CT in 2004 and when averaged across years, perhaps as a result of greater access to soil moisture with surface mulching and preservation of high surface soil organic N with NT (A.J. Franzluebbers, unpublished data). Summarized from a number of studiesReference Makowski, Wallach and Meynard25, wheat grain protein concentration varied from 80 to 140 mg g−1. Halvorson et al.Reference Halvorson, Nielsen and Reule26 reported grain protein concentration of 139±31 mg g−1 during 9 years of cropping with wheat–corn–fallow and wheat–sorghum–fallow in Colorado. Sorghum and corn grain protein concentration was 127±11 mg g−1 among nine selections in KansasReference Kriegshauser, Tuinstra and Hancock27.
Cover crop production
Ungrazed rye cover crop production was significantly greater under NT than under CT in 2003 (Table 4). Although differences were not significant in subsequent years, there was a continuing trend for higher production with NT than with CT. Averaged across years, ungrazed rye cover crop production was 6.0 Mg ha−1 under CT and 7.0 Mg ha−1 under NT (P=0.03). Cattle grazing rye cover crop were able to consume 95±4% of the forage by the end of the growing season (difference in cover crop standing dry matter between ungrazed and grazed plots). Standing dry matter of rye following grazing did not vary between tillage systems, averaging 0.4±0.4 Mg ha−1 across years and tillage systems.
Ungrazed pearl millet cover crop production was significantly greater under NT than under CT in 2003 and 2005 (Table 4). Averaged across years, ungrazed pearl millet cover crop production was 7.6 Mg ha−1 under CT and 10.2 Mg ha−1 under NT (P=0.01). Cattle grazing pearl millet cover crop consumed 93±4% of the forage produced. Standing dry matter of pearl millet following grazing did not vary between tillage systems, averaging 0.6±0.4 Mg ha−1 across years and tillage systems. It is clear from the data in our study that NT was superior to CT for producing cover crop growth.
The C:N ratio of ungrazed cover crops was higher than the remaining cover crop biomass at the end of grazing for both cover crop types and in all years (Table 6). Ungrazed cover crop C:N ratio was often greater under NT than under CT, which may have been due simply to greater biomass accumulation with NT. In contrast, the C:N ratio of wheat stover was lower under NT than under CT when the previous cover crop was ungrazed. The reason for this discrepancy in C:N ratio between cover crops and grain crops with respect to tillage is unclear.
Cover crops grazed by cattle were transformed from (a) raw plant materials that could be used to help conserve soil water and protect the soil surface from erosion into (b) non-uniform animal manure droppings that could contribute to accelerated nutrient cycling and more rapid transformation of crop residue into soil organic matter. Characterizing the benefits of ungrazed and grazed cover crops on ecosystem processes extending beyond the growth of plants needs further investigation.
Greater cover crop production with NT compared with CT suggests that there would be no need to invert crop residues and soil to obtain adequate cover crop growth. Any standing weeds prior to establishment of a cover crop could be controlled with preplant herbicide. Post-planting weeds could be effectively controlled with the development of a vigorous cover crop canopy.
Cattle stocking characteristics
Cattle were stocked on rye for 26–49 days in the spring and on pearl millet for 31–77 days in the summer (Table 2). During the first year of experimentation, yearling steers (5.9–6.7 head ha−1) were stocked on both pearl millet and rye and in subsequent years cow/calf pairs (3.1–5.5 pair ha−1) were stocked on cover crops. Average suckling-calf head weight was lower on rye (69–92 kg head−1) than on pearl millet (182–224 kg head−1), because all calves were born in January/February of each year and rye was ready for grazing about 2 months after calving whereas pearl millet was ready for grazing about 5 months after calving. Average cow weight was not different between cropping systems (515±19 kg head−1).
Total weight of cattle on rye varied from a low of 1.74 Mg ha−1 in 2003 to a high of 2.72 Mg ha−1 in 2004, averaging 2.36 Mg ha−1 across years (Table 2). On pearl millet, stocking weight varied from a low of 1.89 Mg ha−1 in 2003 to a high of 2.94 Mg ha−1 in 2004, averaging 2.50 Mg ha−1 across years. Although no differences occurred between tillage systems in any one particular year, stocking weight tended to be greater under NT than under CT when averaged across years and cover crops (P=0.09), reflecting the greater availability of forage under NT than under CT.
Total number of grazing days was 302±119 (head d) ha−1 on rye and 390±79 (head d) ha−1 on pearl millet (Table 2). The greater number of grazing days on pearl millet was due to greater forage production (Table 4) and regrowth potential. Number of grazing days was greater under NT than under CT when averaged across years on rye, but was not different between tillage systems on pearl millet. Significant tillage effects did occur in 2002 and 2005 on pearl millet, but they were opposing, resulting in no difference across years.
Cattle performance and production
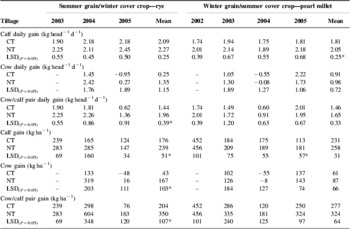
Calf daily gain was excellent on both forages, but was higher on rye (2.18±0.18 kg head−1 d−1) than on pearl millet (1.93±0.17 kg head−1 d−1) (Table 7). Calf daily gain tended to be higher under NT than under CT in most years, but differences were not significant for any year. Averaged across years, calf daily gain was significantly higher under NT than under CT on pearl millet (13%) and when averaged across cover crops (2.16 versus 1.95 kg head−1 d−1; P=0.01).
Cattle performance and production characteristics in two cropping systems managed with either CT or NT.

* Next to LSD value indicates significance between tillage means.
Cow daily gain was highly variable among years and tillage systems (0.88±1.16 kg head−1 d−1) (Table 7), partly because of variable weather conditions (e.g., 121±36% of normal precipitation during the five growing seasons with cows) and variable length of grazing period (44±12 days during the five seasons). Considering both cows and calves together, average daily gain across years was greater under NT than under CT on rye (36%) and when averaged across cover crops (1.80 versus 1.45 kg head−1 d−1; P=0.05). Greater cattle performance under NT was probably related to greater availability of forage, since stocking rate was mostly similar between tillage systems due to the small paddock size that limited our ability to make fine-tuned adjustments.
Calf gain ha−1 was 207±71 kg ha−1 on rye and was 245±132 kg ha−1 on pearl millet (Table 7). There was a tendency for greater calf gain ha−1 under NT than under CT in most seasons, but this effect was significant only on pearl millet in 2005. Averaged across years, there was significantly greater calf gain ha−1 under NT than under CT on rye (36%) and a tendency for greater calf gain ha−1 under NT than under CT on pearl millet (12%; P=0.08).
Cow gain ha−1 was highly variable (87±113 kg ha−1), but averaged across years was greater under NT than under CT on rye (P=0.02) with a similar tendency averaged across cover crops (P=0.08) (Table 7). Considering cows and calves together, total gain ha−1 was greater under NT than under CT on rye (350 versus 204 kg ha−1; P=0.01) and when averaged across cover crops (337 versus 241 kg ha−1; P=0.03).
Integrated economic analysis
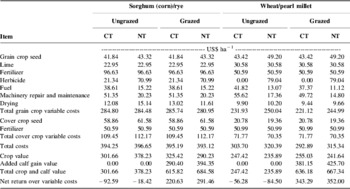
Grain-crop costs were US$284±137 ha−1 among years in the summer grain/winter cover crop system and US$237±93 ha−1 among years in the winter grain/summer cover crop system (Table 8). First-year costs were higher than subsequent years in both systems, due to extra pasture termination costs. Also when corn replaced sorghum in the summer grain/winter cover crop system, higher fertilizer inputs and use of glyphosate-resistant seed resulted in a doubling of input cost. By excluding cover crop input costs from these estimates, net return from grain cropping only over variable costs was US$40±38 ha−1 among tillage and cover crop treatments in the summer grain/winter cover crop system and US$8±21 ha−1 among treatments in the winter grain/summer cover crop system. When cover cropping costs were included, all systems resulted in a net loss from grain cropping.
Mean yearly economic inputs and outputs from summer grain/winter cover crop and winter grain/summer cover crop systems as affected by tillage and cover crop management.

Unit costs of US$2.65 kg−1 sorghum seed, US$5.86 kg−1 corn seed, US$0.40 kg−1 wheat seed, US$0.49 kg−1 rye seed, US$1.23 kg−1 pearl millet seed, US$33.07 Mg−1 lime, US$1.06 kg−1 fertilizer N, US$0.72 kg−1 fertilizer P2O5, US$0.54 kg−1 fertilizer K2O, US$12.68 l−1 glyphosate, US$3.01 l−1 atrazine, US$31.17 l−1 metolachlor, US$0.59 l−1 diesel fuel, and US$3.94 Mg−1 grain to dry three points.
Unit values of US$98.42 Mg−1 sorghum, corn, or wheat grain produced and US$1.65 kg−1 calf gain.
Note: Analysis excludes labor cost, as well as grazing time and gain of cows.
The added value of cattle gain from grazing of cover crops was 138±36% of grain cropping only (Table 8). Obviously with different prices of crop and livestock components, shifts in return could be expected. During the seven seasons evaluated in this study, net return over variable costs was not different between tillage systems in either cropping system. Net return over variable costs was highly significant (P<0.01) between cover crop management systems, averaging −US$63 ha−1 when not grazed and US$302 ha−1 when grazed.
Increased diversity of income and greater magnitude of economic return when cover crops were grazed by cattle should be key drivers for producers considering the adoption of such a management system. However, with multiple enterprises there will be a need for a greater amount of infrastructure, technology, labor and information. The rudimentary economic analysis presented here has not accounted for all of the limitations in an integrated crop–livestock system, but has shown the great potential for economic gain for producers that can effectively optimize such a system within the biophysical and socioeconomic constraints in the southeastern USA. In the Northern Plains region of the USA, winter feeding cost was reduced from US$0.73 cow−1 d−1 with baled hay in drylot to US$0.49 cow−1 d−1 with swath grazing of crop residues left in the fieldReference Karn, Tanaka, Liegig, Ries, Kronberg and Hanson28.
Conclusions
As expected, grain production in the summer was greater, but more variable than in the winter (3.3 Mg ha−1 with 94% coefficient of variation among years in summer compared with 2.7 Mg ha−1 with 3% coefficient of variation among years in winter). Although precipitation varied equally as much in both summer and winter seasons, lack of precipitation with high evaporative demand throughout the summer and excessive precipitation just prior to harvest caused major reductions in summer grain yield. Summer grain and stover production were greater under NT than under CT, but winter grain and stover production were unaffected by tillage system. In addition, both winter and summer cover crops were more productive under NT than under CT. Grazing cover crops with cattle had (1) a positive effect on wheat stover production irrespective of tillage system, (2) no effect on wheat grain and sorghum (or corn) grain and stover production under CT, and (3) a negative effect on sorghum (or corn) grain and stover production under NT. Both rye and pearl millet cover crops provided an abundant and high-quality diet for either yearling calves or cow–calf pairs for 26–77 days. Calf performance on cover crops was 2.15±0.18 kg head−1 d−1 under NT, which was an average of 11% greater than under CT. These data indicate that integrated crop–livestock production may not necessarily suppress crop yields, but could even enhance yields and net economic return, especially if managed with conservation tillage. Despite current social challenges with integrated crop–livestock production systems, significant agronomic and economic benefits could be expected with adoption.
Acknowledgements
We acknowledge the excellent technical contributions of Steve Knapp, Eric Elsner, Dwight Seman, Devin Berry, Kim Lyness, Stephanie Steed, Faye Black, Heather Hart, Robert Sheats and Robert Martin. This study was partially supported by funding from the United States Department of Agriculture (USDA)–National Research Initiative Competitive Grants Program, Agreement No. 2001-35107-11126 and the Georgia Agricultural Commodity Commission for Corn.