Implications
As a repeatable low litter birth weight phenotype was associated with characteristics of intrauterine crowding, and negatively affected lean growth performance postnatally, segregated management of lower birth weight litters in the farrowing house could target interventions to improve pre-weaning growth and survival. In the nursery and grow–finish phases, segregated management of lower birth weight litters could decrease within-pen variation in growth rates and allow better feed budgeting and appropriate marketing of pigs from low birth weight litters. Litter average birth weight should also be a factor in selecting AI (artificial insemination) boars, as it affects testis development.
Introduction
Low birth weight poses a problem for the swine industry owing to its effects on postnatal survival, growth performance and carcass quality (Quiniou et al., Reference Quiniou, Dagorn and Gaudré2002; Rehfeldt and Kuhn, Reference Rehfeldt and Kuhn2006; Fix et al., Reference Fix, Cassady, Herring, Holl, Culbertson and See2010). Even within a normal birth weight (BW) litter, intrauterine growth restriction (IUGR) and a low birth weight (LBW) can be characteristics of individual pigs (Wu et al., Reference Wu, Bazer, Wallace and Spencer2006). However, other studies suggested that IUGR can be a litter characteristic, driven by high ovulation rates and good to moderate early embryonic survival to day 30 of gestation in higher parity sows (Vonnahme et al., Reference Vonnahme, Wilson, Foxcroft and Ford2002). Using an experimental approach to manipulate the number of developing conceptuses in mature sows, Town et al. (Reference Town, Putman, Turchinksy, Dixon and Foxcroft2004) demonstrated that even relatively moderate (15 compared with 9 embryos) intrauterine crowding (IUC) resulted in lower placental weights at day 30 of gestation, and a lack of compensatory mechanisms after day 30 resulted in smaller placental and fetal weights at day 90. Consequently, in the context of studies reporting increased ovulation rates and even more severe IUC in early gestation in higher parity commercial sows, Foxcroft et al. (Reference Foxcroft, Dixon, Dyck, Novak, Harding and Almeida2009) suggested that all surviving conceptuses would be affected by IUGR, and all pigs in the litter would have a LBW phenotype. On the basis of extensive comparisons of postnatal performance in low and high BW pigs within a litter (Quiniou et al., Reference Quiniou, Dagorn and Gaudré2002; Gondret et al., Reference Gondret, Lefaucheur, Juin, Louveau and Lebret2006; Fix et al., Reference Fix, Cassady, Herring, Holl, Culbertson and See2010), a low litter birth weight phenotype would be expected to negatively affect lean growth performance of entire litters after weaning. Indeed, using unilateral–hysterectomy–ovariectomy to induce IUC, Bérard et al. (Reference Bérard, Pardo, Béthaz, Kreuzer and Bee2010) reported that muscle fiber numbers were reduced in pigs from IUC litters, regardless of their individual birth weight. Moreover, Smit (Reference Smit2007) reported that LBW litters of 10 to 15 pigs total born had more pigs born dead and fewer pigs weaned, suggesting reduced viability in these litters.
The hypotheses underlying the present study were that, (1) after accounting for the predicted effect of increased numbers of pigs born on BW, the large residual variance in litter average BW in litters of 9 to 16 pigs born to higher parity sows reflects the negative effects of IUC, driven by a high ovulation rate phenotype, and (2) low-average birth weight litters will show the developmental benchmarks associated with IUGR.
The objectives of this trial were: (1) to establish repeatability of litter BW phenotype in commercial sow populations; (2) having controlled for litter size born, to investigate relationships between litter BW phenotype and fetal and placental development at term; and (3) to relate litter BW phenotype to postnatal lean growth performance and carcass quality; and finally, (4) specifically for newborn male offspring, to study effects of litter BW phenotype on testicular morphology.
Material and methods
Animals and treatments
This study was conducted according to Canadian Council on Animal Care and JBS United Inc. ethical guidelines. Multiparous Large White × Landrace terminal line sows (Camborough; PIC, Nashville, TN, USA) were managed according to approved protocols at the JBS United Inc. research facilities (Sheridan, IN, USA). A total of 223 sows, with information on litter average birth weight of the preceding litter, farrowed within five successive weekly breeding groups in the summer of 2009 at the JBS Bache research facility. After weaning, sows were rebred and 168 sows farrowed again in the winter of 2009. Another 25 sows that farrowed in the winter of 2009 in the same breeding groups but that did not have information on litter average birth weight of preceding litters available were also used for this trial. Sows ranged between parity 2 and 8 (mean = 4.6 ± 1.1). All sows were fed standard corn/soybean meal-based gestation and lactation diets (Supplementary Table S1).
Both in the summer and winter, individual birth weight of all pigs born was measured within 24 h after birth. Litter average birth weight was calculated as total birth weight of all pigs in a litter divided by the total number of pigs born in that litter. Because extremes of high litter size will inevitably reduce both the mean and variation in litter birth weight, only litters between 9 and 16 total born were used in the analysis and for the nursery and grow–finish (GF) trials (Supplementary Table S2). This also ensured that the number of pigs after cross-fostering were even between birth weight categories. On the basis of data from the preceding two farrowings of the sows on trial and the mean litter birth weight for each litter between 9 and 16 total pigs born, experimental litters were classified as low (LBW; one standard deviation below the mean), medium (MBW; less than one standard deviation above or below the mean) or high (HBW; more than one standard deviation above the mean) birth weight as shown in Supplementary Table S2.
Measurements in summer 2009
At birth
Within 24 h after birth and before cross-fostering, Sow ID, parity, date of birth, total number of piglets born, number of piglets born alive, number of stillborns, number of mummies, individual birth weight (of all pigs born) and sex (of all pigs born) were recorded.
Stillborn piglets or piglets that died shortly after birth from any litter were dissected within 24 h after birth. Stillbirth was confirmed by removing the lungs and conducting a ‘lung floatation’ test to determine whether the piglets were born dead and never breathed (lungs not floating), or whether they were born live but died soon after birth (lungs floated). Stillborns that were smaller than two standard deviations below their litter average birth weight (i.e. runts) were not dissected. The measurements taken at necropsy were brain weight, liver weight, small intestine weight and wet weight of the Semitendinosus muscle of the right leg.
Testicular data
A total of 40 male pigs, born to different 4th to 6th parity sows and in litters of 10 to 15 pigs born in total, and identified as falling into high (HW: range 1.8 to 2.2 kg and litter average birth weight of 1.87 ± 0.09 kg, n = 22 males representing nine litters) and low (LW: range 0.8 to 1.2 kg and litter average birth weight of 1.13 ± 0.05 kg, n = 18 males representing seven litters) birth weight categories were castrated at 5.5 ± 1.3 days of age. Body (BdW) and testicular (TW) weights were measured, and the gonadosomatic index (GSI = TW/BdW × 100) was calculated. Fresh transverse sections of the testes were fixed and stored in 5% glutaraldehyde (EMS biological grade) in 0.05 M sodium phosphate buffer (pH 7.2 to 7.4). Testes tissue samples were subsequently processed by washing in three changes of buffer and embedded in glycol methacrylate plastic resin (Leica, Historesin). Histological sections (3 μm) were cut from these resin blocks and stained with toluidine blue-borate for histomorphometric analysis (Chiarini-Garcia et al., Reference Chiarini-Garcia, Parreira and Almeida2011), which were performed in five animals randomly chosen from each experimental group. The absolute numbers of germ cells, Sertoli cells and Leydig cells in the entire testis were estimated as described by Sinha Hikim et al. (Reference Sinha Hikim, Bartke and Russel1988) and Drumond et al. (Reference Drumond, Mistrich and Chiarini-Garcia2011). Briefly, ten randomly selected sections per animal in each group were examined under a binocular BX-51 microscope equipped with a bright field condenser with a 40× objective, and to obtain the volume density (Vv%), the nuclei of each cell type (germ cells, Sertoli cells and Leydig cells) were counted using the point counting method, in a total of 4410 intersections per animal. The average volumes of individual cell nuclei were determined from their diameters measured with a ruler fitted in the eyepiece, previously adjusted with a micrometer ruler. Finally, the total number of these cells in the testis was obtained through the division of the total nuclear volume of each cell type by the individual volume of each cell nuclei, and expressed in million (106). Adipocytes were identified by morphology only and were not used for analyses.
Measurements and management before weaning in winter 2009
At birth, the same measurements were taken as in summer 2009. A maximum of two male and two female stillborn pigs per litter were necropsied, as described above. In addition, the number and total wet weight per litter of all placentae recovered was recorded, from which litter average placental wet weight was calculated: However, placental data were only included in subsequent analyses when more than 50% of the placentae in a litter were recovered, which occurred in 89 litters.
All piglets in LBW and HBW litters with between 9 and 16 total pigs born were ear-tagged at birth, and piglets from MBW litters were ear-tagged the day before weaning. Cross-fostering of tagged litters only occurred within birth weight classification, but non-tagged piglets born to sows not included in the study could be cross-fostered into a tagged litter if needed. When a tagged pig died, the date of death and weight were recorded. All pigs were weighed on the day before weaning.
Management after weaning (winter 2009 only)
From the first two breeding groups farrowed, HBW, MBW and LBW litters were randomly selected for study in the nursery and GF periods at the JBS Burton Russell research facility, with selected litters providing 13 male and 13 female progeny from the same birth weight category to fill a single nursery pen. In the last three breeding groups farrowed, all litters were selected to be followed in the nursery and GF period in order to fill as many pens as possible for each birth weight category in the nursery facility, again with 13 males and 13 females per pen randomly selected from the available litters. Pigs weighing less than 2.7 kg at weaning were excluded from selection (6 LBW pigs, 1 MBW pig and 3 HBW pigs). In total, 9 HBW, 17 MBW and 10 LBW pens were established in the nursery using an incomplete block design, with blocks based on pens. Pens were divided over two nursery barns, but pens in a block were located in the same barn. In the nursery, pigs had a space allowance of 0.38 m2. At 6 weeks after weaning, pigs were moved to two GF barns, keeping the same pigs in a pen as in the nursery. In the GF phase, pigs had a space allowance of 0.62 m2.
Pigs of all birth weight categories were fed using a commercially available four-phase nursery program (JBS United Inc., Sheridan, IN; Supplementary Table S3) for the first 6 weeks after weaning. Phase 1 consisted of a pelleted diet fed for the first week, followed by meal diets fed for one, 1 and 3 weeks, respectively, for phase two through four. The common GF diets (JBS United Inc., Sheridan, IN; Supplementary Table S3) were corn and soybean meal based. Each phase was fed for 21 days until pigs were marketed. All diets were formulated to be above all NRC nutritional requirements (NRC, 1998), were supplemented with 3% to 4% choice white grease, and the lysine : metabolizable energy ratio was at 105% of the experimentally determined requirements for the genotype used in this trial. The additional energy and amino acids were provided to allow potential differences in lean protein deposition among birth weight categories to be expressed. Pigs were shipped by pen to a commercial slaughterhouse (Tyson, Logansport, IN, USA) at a targeted live market weight of 117 kg.
Measurements after weaning (winter 2009 only)
Pigs were weighed on a pen basis (not individually) within 24 h after weaning, then weekly during the 6-week nursery period and once every 4 weeks during the GF period. Pigs were weighed individually the day before slaughter. Average daily feed intake (ADFI), mortality and morbidity, and scour scores were measured on a pen basis throughout the nursery and GF periods. Carcass data were received on a pen basis (not individually) from the slaughterhouse, where fat depth, loin depth and lean meat percentages were measured using the Animal Ultrasound System (Animal Ultrasound Services and Co. Inc., Ithaca, NY, USA). Sort loss and grade premium were calculated as per Tyson Slaughterhouse standards.
Statistical analysis
For all parameters at birth, litter was used as the experimental unit, whereas pen was used as the experimental unit for all parameters tested after weaning. Data were analyzed using the MIXED procedure of the Statistical Analysis System (SAS Institute, Cary, NC, USA). After weaning, a randomized incomplete block design was used, with blocks based on pens. In the case of unequal numbers of pens for each litter birth weight category, an incomplete block was formed with one or two birth weight categories present. The model included litter birth weight category (LBW, MBW, HBW) as a fixed effect and block as a random effect.
Repeated measure analysis was used for pen weight, pen feed intake and feed utilization efficiency after weaning. An appropriate covariance structure was selected by comparing the goodness-of-fit measures of different structures. The Kenwardroger approximation was used for the denominator degrees of freedom. Categorical data such as scour scores and mortality rate were analyzed separately using the generalized logit function (proc CATMOD in SAS).
For data of body weight and average daily gain (ADG) on individual pigs, data were analyzed as a randomized design. The model included litter birth weight category and gender as fixed effects, and the week of farrowing as a random effect.
For the testicular data, all variables measured were tested for normality before analyses, using the univariate procedure of SAS. Data were analyzed as a randomized design, and the statistical model included birth weight class (HW and LW) as fixed effect and piglet as a random effect. Treatment effects on castration weight, testes weight, GSI, absolute cell numbers and cell number per gram of testes were analyzed using the general linear model (GLM) procedure of SAS. Least square means were compared using Student's t- test. Important associations among BW, testicular weight and Sertoli cell number were examined across treatment groups using correlation analysis (INSIGHT procedure of SAS).
Data in the text are given as least square means ± s.e.m., unless otherwise stated. In the tables, data are reported as least square means and residual standard deviation and data in the figures as means. Probability values < 0.05 were considered significant and values ⩽0.10 were used to describe trends.
Results
Repeatability of litter average birth weight within sows
Correlations analysis between litter average birth weight of three consecutive farrowings within sows established a correlation (P < 0.001) between litter average birth weight of the first and second farrowing (r = 0.39), between the second and third farrowing (r = 0.46), and between the first and third farrowing (r = 0.30). The correlation coefficient of the first two farrowings together v. the third farrowing was 0.47 (P < 0.001). The percent of sows in LBW, MBW and HBW categories in two consecutive farrowings is given in Supplementary Figure S1 and indicates that very few sows switched between the LBW and HBW categories in consecutive farrowings.
Birth data
Of the 192 sows farrowing, 18 sows gave birth to a litter with less than 9 pigs in total, 148 sows had a litter between 9 and 16 pigs born in total, and 26 sows had a litter with more than 16 pigs born in total. Across all litter sizes born, there was a negative relationship between litter size (total born) and litter average birth weight (y = −0.0394x + 1.9348, R 2 = 0.23, P < 0.001, Supplementary Figure S2). Average placental weight was not significantly related to litter size (R 2 = 0.02, P = 0.21), but was positively related to average litter birth weight (y = 0.1229x + 0.0777, R 2 = 0.22, P < 0.001; Figure 1).
Relationship between average litter birth weight and average placental weight per litter (n = 89).

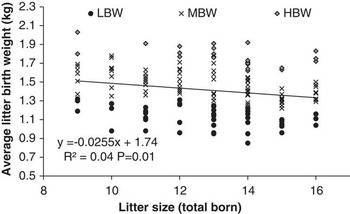
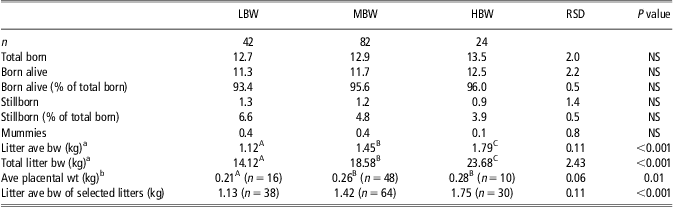
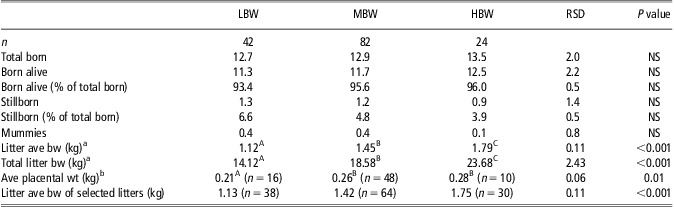
Within the 148 sows with litters between 9 and 16 of the total born, 42 sows fell within the LBW, 82 within the MBW and 24 within the HBW category (Figure 2). Within this range of litter size born, total number of pigs born, born alive, stillborn and born mummified was similar among birth weight categories (Table 1). Number of stillborns and pigs born alive as percentage of total litter size was also not different between birth weight categories (Table 1). Average placental weight was lower in LBW litters than in MBW and HBW litters (P < 0.01; Table 1).
Relationship between litter size (total pigs born) v. average litter birth weight for litters between 9 and 16 total born (n = 148). Litters were classified as low (LBW)-, medium (MBW)- or high (HBW)-average birth weight.

Characteristics at birth for litters between 9 and 16 total piglets born for low (LBW), medium (MBW) and high (HBW) birth weight litters
Data are the LSMeans, RSD = residual standard deviation, ave = average, bw = birth weight, NS = not significant.
A,B,CLSMeans in a row with different superscripts are significantly different at P < 0.05.
aTotal number of pigs born in litter used as covariate.
bOnly taking into account litters where more than 50% of the placentae were recovered.
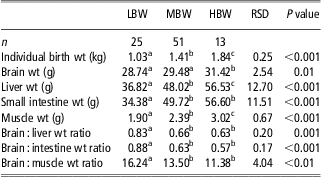
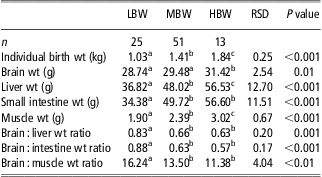
Of the 358 piglets that were necropsied in the summer and winter of 2009, 253 piglets were from litters between 9 and 16 total pigs born. Of these, 148 were considered true stillborns (lungs not floating), and 120 of these pigs had an individual birth weight within 0.5 kg of their litter average birth weight. These 120 piglets came from 26 LBW, 51 MBW and 13 HBW litters. A single pig from a LBW litter for which the brain weight data were missing was removed from the analysis. Data were averaged for each litter. Supplementary Figure S3a shows the average individual birth weight of the true stillborns used for analysis in LBW, MBW and HBW litters. Significant positive relationships between individual birth weight of true stillborn pigs and weight of the brain, liver, small intestine and Semitendinosus muscle (P < 0.001 for all relationships) are shown in Supplementary Figure S3b. Individual birth weight and weights of the brain, liver, small intestine and Semitendinosus muscle were smaller (P < 0.01) in LBW than HBW litters, with MBW litters having intermediate results (Table 2). Moreover, LBW litters had higher brain : liver, brain : intestine and brain : muscle weight ratios than MBW and HBW litters (P < 0.01).
Data of necropsied piglets for litters with low (LBW), medium (MBW) or high (HBW)average litter birth weight. Data are averaged by litter
Data are the LSMeans, RSD = residual standard deviation, wt = weight.
a,b,cLSMeans in a row with different superscripts are significantly different at P < 0.05.
Growth performance data
ADG during lactation tended to be higher (P = 0.06) in HBW (0.23 ± 0.01 kg/day, n = 24) than LBW (0.21 ± 0.01 kg/day, n = 37) litters, resulting in a higher weaning weight (P < 0.001) for HBW (6.49 ± 0.10 kg) than LBW (5.56 ± 0.08 kg) litters. Mortality rate during lactation was higher (P < 0.001) in LBW than HBW litters (16.4% and 6.7% for LBW and HBW, respectively).
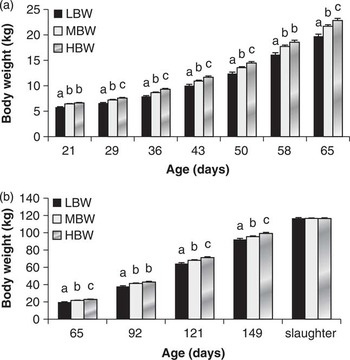
BW was lower (P < 0.01) in LBW than MBW and HBW litters throughout the nursery and GF phase (Figure 3a and b) and was higher (P = 0.05) in HBW than MBW pigs during most of the nursery and GF phase (Figure 3a and b).
BW for low (LBW), medium (MBW) and high (HBW) birth weight litters in (a) the nursery phase (P value for birth weight category: <0.001, for time: <0.001 and birth weight category by time interaction: 0.001), and (b) the grow–finish phase (P value for birth weight category: <0.001, for time: <0.001 and birth weight category by time interaction: <0.01). Columns within age without common superscript are significantly different at P < 0.05.

By design, slaughter weight was similar between birth weight categories and within-pen variation in body weight at slaughter was also similar between birth weight categories, both when analyzed using the standard deviation (12.69, 12.35 and 12.42 kg for LBW, MBW and HBW litters, respectively: P = 0.83) or the CV (5.08, 4.93 and 4.94 for LBW, MBW and HBW litters, respectively: P = 0.78) as the measure of variation.
ADG was higher (P < 0.05) in HBW than LBW and MBW litters throughout the nursery and GF phase, and was higher (P < 0.05) in MBW litters than LBW litters in the nursery, but similar to LBW litters in the GF phase (Supplementary Figure S4).
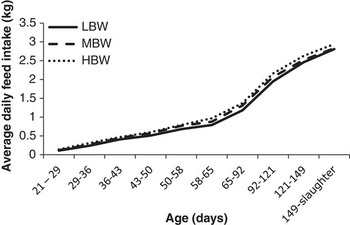
From 1 week after weaning until slaughter, ADFI was higher (P < 0.001) in HBW than LBW litters (Figure 4). Feed utilization efficiency (pen feed/pen weight gain) in the nursery phase tended to be higher (P = 0.06) for LBW than MBW litters, but was not different from HBW litters (1.41, 1.45 and 1.42 for LBW, MBW and HBW litters, respectively). In the GF phase, feed utilization efficiency was better (P < 0.001) in LBW than MBW and HBW litters (2.34, 2.40 and 2.42 for LBW, MBW and HBW litters, respectively).
Average daily feed intake for low (LBW), medium (MBW) and high (HBW) birth weight litters during the nursery period (21 to 65 days of age) and the grow–finish (GF) period (65 days of age until slaughter). P values in the nursery for birth weight category: <0.001, for Time: <0.001 and for birth weight category by time interaction: <0.01. P values in the GF phase for birth weight category: <0.001, for time: <0.001 and for birth weight category by time interaction: 0.39.

Scour scores in the nursery (1 = no scours, 2 = mild scours, 3 = severe scours) was similar between birth weight categories (average score was 1.12 for LBW and 1.13 for MBW and HBW litters; P = 0.90).
The number of pigs slaughtered per pen was similar between birth weight categories, meaning that the number of pigs that were taken off trial from weaning until slaughter because of mortality (2.7%, 2.3% and 2.6% for LBW, MBW and HBW, respectively) or morbidity/too slow growth (9.2%, 7.9% and 6.4% for LBW, MBW and HBW, respectively) were similar between birth weight categories.
Individual body weight and ADG data
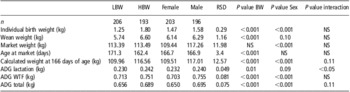
Effects of litter birth weight phenotype on individual birth weight and ADG were similar as results on a litter/pen basis (Table 3). Compared with males, females had lower (P < 0.001) body weights at birth, weaning (tendency, P = 0.10) and market, their calculated body weight at a fixed age of 166 days was lower (P < 0.001) and their ADG was lower in lactation (trend P = 0.09), wean-to-finish and total (P < 0.001; Table 3).
Individual BW data for pigs of different genders and from low (LBW) or high (HBW) birth weight litters

RSD = residual standard deviation, ADG = average daily gain, WTF = wean-to-finish, NS = not significant.
There was an interaction between litter birth weight phenotype and gender for ADG in lactation and close to a trend for ADG total and calculated weight at a fixed age. Males in HBW litters had higher ADG than HBW females, LBW females and LBW males (Table 4). ADG total and calculated weight at a fixed age of 166 days were lower in LBW females and higher in HBW males compared with LBW males and HBW females (Table 4).
Interaction between litter birth weight phenotype and gender for ADG and calculated weight at a fixed age

LBW = low litter birth weight, HBW = high litter birth weight.
a,b,c LSMeans in a row with different superscripts are significantly different at P < 0.05.
Carcass data
Live body weight and hot carcass weight were similar between birth weight categories, whereas age at slaughter was different (P < 0.001) in LBW (174.4 days) and HBW litters (165.6 days; Supplementary Table S4). Loin depth, fat depth, lean meat percentage, yield percentage, grade premium and sort loss were not affected by birth weight category (Supplementary Table S4).
Testicular data
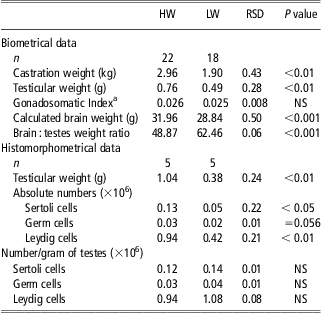
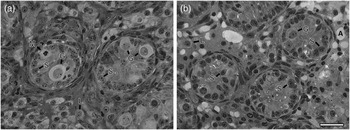
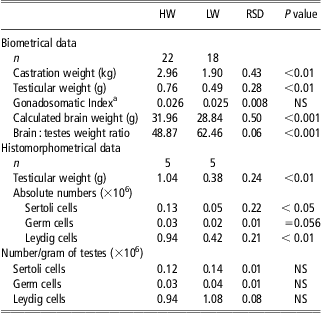
Testis weight and body weight at castration were different (P < 0.01) for HW and LW males, respectively (Table 5), whereas testis weight relative to body weight (GSI) was similar. When brain weight at birth was calculated with the formula given in Supplementary Figure S3b, the brain : testis weight ratio was shown to be higher (P < 0.001) for LW compared with HW males (Table 5). The diameter of the seminiferous tubules was not affected by birth weight (56.8 ± 0.4 μm v. 56.7 ± 0.5 μm for HW and LW piglets, respectively, RSD: 5.49 μm, P > 0.05). The histomorphometrical analysis established that LW males had lower absolute numbers of germ cells, Sertoli cells and Leydig cells than HW males (P < 0.01; Table 5; Figure 5), but the numbers of cells per gram of testes were similar between HW and LW animals. Figure 5 also shows that Leydig cells are partially replaced by adipocytes in the interstitial tissue of testes from the LW males.
Biometrical and histomorphometrical data of the testes from high (HW) and low (LW) birth weight piglets
Data are the LSMeans, RSD = residual standard deviation, NS = not significant.
aGonadosomaticindex = testicular weight/body weight × 100.
Photomicrographs of transversal sections of testicular cords from 6-day-old piglets of high (a) and low (b) birth weights. Observe the germ cells (G), the nuclei of the Sertoli cells (S), Leydig cells (L) and the presence of cell division (M: mitosis). The ‘ghost cells’ are assumed to be adipocytes (A). Toluidine blue-sodium borate staining. Bar represents: 30 μm.

Discussion
In the current trial, there was a decline in litter average birth weight of 39 g for each additional pig born across the whole population of litters recorded, consistent with earlier studies (35 g in Quiniou et al., Reference Quiniou, Dagorn and Gaudré2002; 43 g in Beaulieu et al., Reference Beaulieu, Aalhus, Williams and Patience2010b). However, for litters of 9 to 16 total pigs born, litter size only accounted for 4% of the variation in litter average BW, yet litter average BW among the same sized litters differed by almost 1 kg, suggesting that factors other than numbers born are affecting litter average BW. The hypothesis that early IUC results in IUGR and fetal programming of the entire litter in more mature sows in relatively prolific damlines (Foxcroft et al., Reference Foxcroft, Dixon, Dyck, Novak, Harding and Almeida2009) is consistent with the observation of a lower placental weight in LBW compared with MBW and HBW litters. A correlation across litters between average placental weight and average birth weight, but no correlation between litter average placental weight and total born, is also consistent with the hypothesis that LBW litters were subjected to IUC early in gestation, inducing persistent effects on placental development.
Another characteristic of IUGR is the ‘brain-sparing effect’, as reported between litters by Town et al. (Reference Town, Putman, Turchinksy, Dixon and Foxcroft2004) and within litters by Alvarenga et al. (Reference Alvarenga, Chiarini-Garcia, Cardeal, Moreira, Foxcroft, Fontes and Almeida2013). Consistent with these earlier studies, we established the overall effects of litter BW classification on brain : organ weight ratios using dissection of stillborn pigs with an individual BW within 0.5 kg of their litter average BW. Assuming that a stillbirth is a consequence of events occurring during the farrowing process, and is a relatively random process in relation to pig size and potential viability, the selected stillborn pigs used in this study are likely to be representative of the developmental state of their littermates. Interestingly, Bérard et al. (Reference Bérard, Pardo, Béthaz, Kreuzer and Bee2010) showed that across the range of IUC established in their UHO model, the individual birth weight of piglets exerted the most important effect on organ weights and brain : liver weight ratios. As shown by the study of Town et al. (Reference Town, Putman, Turchinksy, Dixon and Foxcroft2004), the problem with IUC in early gestation is that placental development and fetal growth of all surviving littermates is affected, whereas in more ‘normal’ HBW and MBW litters, only a few piglets may experience extreme IUGR.
The higher pre-weaning mortality in LBW litters is also in agreement with earlier findings (Smit, Reference Smit2007). As both post-weaning mortality and morbidity, as measured by scour scores in the nursery and the number of pigs taken off trial because of disease or slow growth in the nursery and GF stages, were similar between BW categories, targeting management interventions in the farrowing house to reduce the impact of an LBW litter should be seen as a high priority, particularly given the repeatability of the LBW phenotype.
The higher brain : muscle weight ratio in LBW litters shows the same trend reported by Town et al. (Reference Town, Putman, Turchinksy, Dixon and Foxcroft2004) in day 90 fetuses from relatively crowded uteri. As predicted, LBW litters had lower body weights at all times and the difference in body weight between LBW and HBW litters increased over time owing to differences in ADG. Interestingly, ADG in lactation was higher in HBW males, but not females, compared with LBW males and females and ADG from birth to slaughter was lowest in LBW females and highest in HBW males. These gender-related effects emphasize the importance of balancing gender between litter BW categories when studying postnatal growth performance. Overall, the longer time needed for LBW litters to reach the same market weight suggests that segregated management of LBW progeny would allow more efficient use of barn space at the GF stages of production.
As reviewed elsewhere (Foxcroft et al., Reference Foxcroft, Bee, Dixon, Hahn, Harding, Patterson, Putman, Sarmento, Smit, Tse and Town2007), several earlier studies have reported effects of individual birth weight within a litter on muscle fiber differentiation, lean growth performance and carcass quality. However, options for measuring carcass traits at a fixed age or fixed weight make detailed comparisons between these studies difficult. In the current trial, pigs were slaughtered by pen at a fixed end weight and as each pen consisted of 13 males and 13 females, gender was balanced within pens and between birth weight categories. Unfortunately, with the loss of information for the HBW pens owing to data recovery problems in the slaughterhouse, it was not possible to confirm litter birth weight effects for any of the measured carcass traits, including fat depth and lean tissue yield, and further research is needed in this area.
Our study did show clear effects of birth weight on testicular development in male progeny. It has been demonstrated that Sertoli cells provide the environment that protects and nourishes germ cells and supports their development to viable sperm (França and Chiarini-Garcia, Reference França and Chiarini-Garcia2005) and Sertoli cell proliferation in pigs begins during the prenatal period (McCoard et al., Reference McCoard, Wise and Ford2002) and continues after birth (Swanlund et al., Reference Swanlund, N'Diaye, Loseth, Pryor and Crabo1995; França et al., Reference França, Silva, Chiarini-Garcia, Garcia and Debeljnk2000). A critical period of Sertoli cell proliferation occurs during the first 3 weeks after birth (McCoard et al., Reference McCoard, Wise, Lunstra and Ford2003) and the total number of Sertoli cells achieved will determine testicle size in adulthood, as well as the sperm production capacity (Cooke et al., Reference Cooke, Porcelli and Hess1992; Hess et al., Reference Hess, Cooke, Bunick and Kirby1993). More recently, Flowers (Reference Flowers2008) has reported beneficial effects on sperm production for prospective artificial insemination (AI) boars with improved pre-weaning growth, which was achieved by rearing these boars in smaller litters during lactation. Therefore, considering the correlation between body weight and Sertoli cell numbers found in our trial, and the tendency for lower growth rates during lactation in LBW litters, our results suggest that LBW males may end up with a lower total number of Sertoli cells, with important implications for lifetime sperm production and libido of prospective AI boars. If mature sows in sire-line programs show the same repeatability in litter birth weight phenotype as in the present study, selection of potential AI boars from HBW litters would be predictive of better lifetime productivity in the boar stud.
A big problem in all-in/all-out systems is the huge variation within pens in body weight at the time of slaughter. Although the common practice is to sort pigs by size at the entry of the nursery and/or GF barn (Deen, Reference Deen1997; Tokach, Reference Tokach2004), research has shown that this is not effective in decreasing weight variation (O'Quinn et al., Reference O'Quinn, Dritz, Goodband, Toakch, Swanson, Nelssen and Musser2001), while increasing aggressive behavior during the 2-day period after regrouping (O'Connell et al., Reference O'Connell, Beattie and Watt2005). Schinckel et al. (Reference Schinckel, Ferrel, Einstein, Pearce and Boyd2004) showed that pigs in the smallest 20th weight percentile at birth grow slower after weaning and are responsible for the majority of variation in pig weights after weaning. Pigs sourced from our LBW litters are likely to overlap to a great extent with the overall 20th percentile of lowest birth weight pigs in all litters born. Given this overlap, an option raised by the current trial is to sort nursery and GF pigs by litter average BW rather than by individual BW. Indeed, a CV of ∼5% for within-pen weight variation around slaughter as reported in our trial was smaller than a CV between 6% and 8% reported by O'Quinn et al. (Reference O'Quinn, Dritz, Goodband, Toakch, Swanson, Nelssen and Musser2001) and between 8% and 14% reported in other studies (Dedecker, Reference Dedecker2002; O'Connell et al., Reference O'Connell, Beattie and Watt2005).
Another management option for the nursery and GF phase is segregated management of the different litter BW phenotypes that allows for different feeding strategies. Beaulieu et al. (Reference Beaulieu, Shea and Gillis2010a) showed that pigs with lighter BW showed a greater positive response to a complex diet after weaning than heavier BW pigs and concluded that the Phase 1 diet in the nursery could be used more efficiently and cost-effectively when targeted specifically to the LBW pigs at weaning. Moreover, it has been shown that LBW pigs have a lower feed efficiency than HBW pigs (O'Quinn et al., Reference O'Quinn, Dritz, Goodband, Toakch, Swanson, Nelssen and Musser2001; Schinckel et al., Reference Schinckel, Einstein, Jungst, Booher and Newman2010). This could be because of the effects of piglet birth weight on intestinal morphology as reported by D'Inca et al. Reference D'Inca, Gras-Le Guen, Che, Sangild and Le Huërou-Luron(2011) and Alvarenga et al. Reference Alvarenga, Chiarini-Garcia, Cardeal, Moreira, Foxcroft, Fontes and Almeida(2013). Although reduced feed utilization efficiency in LBW litters might have been expected in our study, feed utilization efficiency tended to be higher for LBW compared with MBW litters in the nursery phase and was significantly better in the GF phase than in MBW and HBW litters. It is not clear why LBW litters had a higher feed efficiency. Nonetheless, it is clear that pigs from LBW litters have different nutritional needs and segregated management would help to optimize the feeding of both populations.
Another potential advantage of segregated management would be that LBW litters could be marketed differently from the rest of the population. Because low birth weight pigs likely reach the plateau of lean growth earlier than high birth weight pigs (Rehfeldt and Kuhn, Reference Rehfeldt and Kuhn2006), LBW litters should either be marketed at a lower slaughter weight, or sent to a market demanding higher fat percentages.
In conclusion, the data from the present study confirm that a low litter birth weight is a repeatable phenotypic trait in mature sows and is associated with the benchmarks of IUGR. This LBW litter phenotype affects postnatal survival and growth and has implications for management strategies to reduce the variation in postnatal performance.