



I. INTRODUCTION
To follow “More Moore” and “More-than Moore” approaches, different packaging technologies, such as System in Package (SiP) and System on Chip (SoC), were developed during the past few years (Moore, Reference Moore1965; Garrou et al., Reference Garrou, Bower and Ramm2008). These concepts allow the miniaturization of microelectronic devices, while at the same time increasing their functionality and performance (Zhang et al., Reference Zhang, Van Driel and Fan2006). However, packaging technologies have the drawback that stresses introduced during the manufacturing process might lead to a reduction of reliability. Manufacturing related stresses can be large enough to induce cracks or delamination directly during the manufacturing process or afterwards if service stresses are superimposed. These stresses are mainly related to the mismatch of the coefficient of thermal expansion (CTE) of different materials, e.g. polymers, semiconductors, and metals. Furthermore, stresses are introduced because of polymeric shrinkage during the embedding (Macurova et al., Reference Macurova, Kharicha, Pletz, Mataln, Bermejo and Schöngrundner2013, Reference Macurova, Angerer, Schöngrundner, Krivec, Morianz and Antretter2014) or encapsulation (molding) process (Wong et al., Reference Wong, Bennett, Manessis, Danilewsky and McNally2014) of electronic devices. In order to quantify the probability of failure it is necessary to know the stresses and deformations (warpage) inside the package. Different experimental approaches are available to determine the stresses and warpage of packages. Yang et al. (Reference Yang, Kwon and Lee2012) presented a new reliability prediction method for specific packages.
The X-ray Diffraction Rocking Curve method and its application for the determination of the curvature of silicon chips embedded into a printed circuit board (PCB) at room temperature (RT) as well as at non-ambient temperatures up to 115 °C is the topic of Wong's paper. We present two suitable variants of this technique and the corresponding mathematical formalism as well as their advantages. However, at first, several other competing techniques for the curvature determination will be considered here in brief.
Scanning acoustic microscopy is well suited for the investigation of delamination and cracks in the material (Mutti and Briggs, Reference Mutti, Briggs, Yacobi, Holt and Kazmerski1994). However, this method is less adapted for the precise curvature determination. The X-ray computer tomography technique was used for the curvature measurement with success (Landis and Keane, Reference Landis and Keane2010). The optical methods applied to the curvature measurements of silicon chips are primarily the shadow Moiré method as described, e.g. in Hassell (Reference Hassell2001) and various interference methods (Malacara, Reference Malacara2007). The shadow Moiré technique requires no beam interference and can be applied using white (polychromatic) light and diffuse reflecting surfaces. Here a grating above the investigated curved component generates a shadow (e.g. a line pattern) on the object. This pattern is observed through the grating under a specific angle and the overlapping effect generates a line pattern from which the surface of the object can be reconstructed. The interferometry techniques according to the setups of Twyman–Green (a variant of the classical Michelson interferometer) and of Fizeau should be noted here. The latter method is modified advantageously for the application of far-infrared radiation with a wavelength in the range of 10 µm to avoid problems of diffuse reflection on the sample surface (Kaushal and Bongtae, Reference Kaushal and Bongtae2001). The direct determination of residual strain and stress in the material can be achieved by X-ray diffraction with laboratory diffractometers, as well with large synchrotron facilities. The observation of the variation of the lattice plane spacing as a function of the plane orientation in the sample coordinate system is described in Noyan and Cohen (Reference Noyan and Cohen1987) and Welzel et al. (Reference Welzel, Ligot, Lamparter, Vermeulen and Mittemeijer2005). Here a polycrystalline material is suited at best; also the thin-layer analysis is realizable (Zhao et al., Reference Zhao, Yu, Huang and Wang2006). Moreover, single-crystal investigations (Ortner, Reference Ortner2005) are also possible. The topography mapping by means of the X-ray diffraction technique has also been used for the curvature determination of silicon wafers as e.g. described in Segmüller et al. (Reference Segmüller, Angilelo and La Placa1980). During the past years, the Raman spectroscopy technique is more often applied to the determination of residual stress in solids (DeWolf, Reference DeWolf2003; Ryu et al., Reference Ryu, Zhao, Hecker, Son and Byun2012). This method is well suited for mappings of the lateral residual stress distribution and many promising results are achieved up to now.
The Rocking Curve method based on X-ray diffraction and its application to determine the curvature of silicon chips embedded into a PCB is the topic of our paper and will be discussed below in detail. The rocking curve technique is based on the detection of the intensity of a specific diffraction maximum as a function of the sample orientation. The diffraction intensity is recorded at a fixed diffraction angle, while the sample is rotated about an axis perpendicular to the incident and diffracted beam (i.e. the diffracting plane). This technique is a standard procedure for the determination of the defect or dislocation density, the waviness of the surface, or the mosaic structure in single crystals. In the work of Wong et al. (Reference Wong, Bennett, Manessis, Danilewsky and McNally2014) and Wang et al. (Reference Wang, Zhang, Wang, Jiang, Zhu, Zhao, Liu, Wang, Shi, Wang, Liu and Yang2009), this method is used for the curvature determination. Popovici et al. (Reference Popovici, Stoica, Chalupa and Mikula1988) provide a more detailed discussion on the effect of a curved crystal on the observed rocking curve. This technique was also adapted for the determination of stress factors in thin layers on silicon single-crystal substrates (Martinschitz et al., Reference Martinschitz, Eiper, Massl, Koestenbauer, Daniel, Fontalvo, Mitterer and Keckes2006).
Note: an overview of all variable designations and acronyms used in this paper is given in Table I.
General nomenclature and variable designation of the used parameters and the used acronyms.

II. EXPERIMENTAL
A. Investigated samples
In order to determine manufacturing related deflections and stresses of a package consisting of a silicon chip embedded into a PCB two samples at significant manufacturing stages are investigated. Sample A represents the condition after the attachment process where a silicon chip (silicon single crystal with copper pads on one side) is bonded a copper foil by means of an epoxy-based adhesive at 130 °C; see Figure 1(a). The chip has the size 7 × 7 × 0.12 mm3. The adhesive layer under the die is approximately 0.045 mm thick, and the copper foil has the size 22.0 × 22.0 × 0.07 mm3. The adhesive covers the silicon chip and forms a meniscus on the borders. The curing of the adhesive at elevated temperature leads, together with the CTE mismatch (a relatively higher CTE of the adhesive in comparison with the CTE of the silicon die and the copper foil) to a convex shape of the sample at cooling to RT. The arising stresses and deformations in the package because of the CTE mismatch are examined in Macurova et al. (Reference Macurova, Schöngrundner, Bermejo, Pletz, Antretter, Krivec, Morianz, Brizoux and Lecavelier2015a). Sample B represents the package after the lamination step followed by copper foil removal. During the lamination the attached silicon chip was laminated together with different kinds of prepregs and a copper foil at 200 °C and an applied pressure of 30 bar [see Figure 1(b)]. The lamination is finished by cooling to RT. After lamination, the package is released from the press and the copper foils are removed above and below the silicon chip. This package represents the investigated sample B. It consists of the encapsulated silicon chip, the adhesive layer, and three prepreg (glass fabric/resin composite) layers. The prepreg on the top and on the bottom of the package has a post-press thickness of 44 µm, while the prepreg in the middle of the package has a thickness of 115 µm after pressing. During the lamination, the arising residual stresses in the resin are higher than in the adhesive, because only the resin exhibits a significant volumetric shrinkage because of its curing. The following copper removal causes a partial release of residual stresses and results in a deformation of the final package into a concave shape at RT (cf. the paper of Macurova et al., Reference Macurova, Angerer, Bermejo, Pletz, Schöngrundner, Antretter, Krivec, Morianz, Brizoux and Lecavelier2015b).
Schematic drawing of (a) sample A, which consist of a silicon chip bonded with an adhesive on a copper foil and (b) sample B, which consist of a silicon chip bonded with an adhesive and embedded into a PCB (pre-preg).

B. Sample orientation and axis convention
The (1 0 0) silicon lattice plane was oriented parallel to the sample surface on which the measurements is performed. Initially the almost square-shaped chip is leveled and its edges are oriented parallel to the X- and Y-directions of the sample stage. Furthermore, the center of the sample is adjusted to the position X = 0, Y = 0 in the stage coordinate system. In this work, the sample curvature of two traverses passing through the sample center are determined in the main directions X and Y parallel to the sample edges (defined as φ = 0°, φ = 90°). A full reconstruction of the sample surface is not undertaken.
C. X-ray diffraction
The initial conventional scans (θ–θ configuration) for the precise identification of the silicon diffraction peak position as well as the rocking curve experiments for the actual wafer curvature determination are conducted on a D8 Discover diffractometer (Bruker AXS, Germany) in parallel beam geometry (CuKα1/α2 radiation, 1.5418 Å wavelength). The diffractometer is equipped with a Sol-X energy dispersive detector, an open Eulerian cradle, a polycapillary collimator in the incident beam (4 mrad = 0.23° divergence, 250 mm distance to the sample). An equatorial soller slit (0.12° divergence nominal) is inserted on the receiving side. Owing to the high diffraction intensity of silicon single crystals, the tube current, and the tube voltage are adapted to keep the count rate low enough (20–40 kV, 10–35 mA). This adjustment ensures that the detector works in the linear dynamic range. For the curvature determination, the beam diameter is limited by means of a circular primary collimator with 0.3 mm diameter. For the high-temperature diffraction in situ measurements, a domed high-temperature stage DHS900 (by Anton Paar, Austria) is attached (Resel et al., Reference Resel, Tamas, Sonderegger, Hofbauer and Keckes2003) to the sample stage. The heating rate was 1 °C s−1. After reaching the intended measurement temperature, the rocking curve experiments are conducted under isothermal conditions. All diffraction experiments are performed under air.
D. Conventional scans
For the determination of the exact diffraction angle (2θ Si) and the actual intensity of the silicon (4 0 0) reflection, conventional scans (angle of incidence equal to the angle emergence of the diffracted beam, detection of diffraction intensity as a function of the diffraction angle 2θ) are conducted initially. These scans are performed with a step size of 0.05°2θ and ~1 s counting time per step. A sufficient sample adjustment could be assumed if the observed diffraction intensity of the silicon (4 0 0) reflection is high enough. However, only very slight tilts of the wafer attached on the sample stage by an adhesive tape could be realized.
E. Rocking curve
The detector circle is subsequently fixed to the observed diffraction angle (2θ Si = const). The sample stage position is fixed to a specific sample position (X, Y). The diffraction intensity is recorded as a function of the sample holder orientation or the rocking angle θ. The corresponding rotation about an axis (also called Θ- or ω-axes to avoid confusion with the detector circle) is perpendicular to the incident and to the diffracted beam. The diffraction intensity function I = f (θ) (the “rocking curve”) is recorded using a step size of 0.01°θ and a counting time of ~0.5 s step−1. The position of the maximum θ max = α can be interpreted as the orientation of the normal to the silicon lattice plane (1 0 0), which corresponds to the normal to the sample surface on a specific point (X, Y).
III. RESULTS AND DISCUSSION
A. Curvature determination
In Figure 2, the rocking curves of a typical silicon chip at RT and at 130 °C are displayed. For each temperature, six curves are shown. The series of rocking curves with low peak intensity refer to RT, the curves with high peak intensities refer to the measurements at 130 °C. These curves refer to different X-positions (ΔX = 1 mm) as indicated in the diagram. It can be easily recognized that the corresponding increment Δθ max(X) is ~0.35° at RT and decreases to ~0.10° at 130 °C. The evident concurrent change of the full-width at half-maximum (FWHM, Δθ = β) of the rocking curves of ~0.2° at RT and ~0.05° at 130 °C will be discussed later. Additionally a change of the direction of the shift is observed. For the determination of the curvature behavior in the X-direction, the orientation of the lattice plane normal is determined as a function of the (X, Y)-position on the sample: α X (X, Y) = θ max(X) = f (X, Y). In the Y-direction, α Y (X, Y) = θ max(Y) = f (X, Y) is defined analogous. Then the curvature radius R X (X, Y) and the corresponding curvature in the X-direction κ X (X, Y) = 1/R X (X, Y) can be calculated according to κ X (X, Y) = (∂α X /∂X)·(π/180°). Similarly, the curvature in the Y-direction can be defined as κ Y (X, Y) = (∂α Y /∂Y) (π/180°). The use of the curvature instead of the curvature radius is preferable for the quantitative discussion to avoid infinite values. If the curvature is uniform over the sample traverse, α X (X) and α Y (Y) are linear functions. This is the case if data corresponding to the sample region ~1 mm near the edge are excluded. A drop of the diffraction intensity represented those data. The slope κ X is determined by the linear regression of α X or α Y vs. X or Y. In Figure 3, the data deduced from such an experiment are displayed. The sign of the curvature (i.e. concave or convex behavior) must be carefully deduced from the sign of the slope according to the definition of the XY-axes on the sample stage. In our work, a negative curvature or a negative curvature radius indicates a convex surface, and positive values correspond to a concave surface.
Rocking curves of a non-laminated silicon chip (sample A) at RT and at 130 °C. The sample position shift in the X-direction was 1 mm each (position as indicated). The changes of the shift of the rocking angle of maximum diffraction intensity, as well as the changes of the FWHM can be clearly seen.

Rocking angles of the Rocking curve maxima plotted as a function of the lateral sample position in the X-direction for sample A. The curves correspond to different temperatures. Dashed lines and open symbols indicate data referring to the cooling phase (desc = descent). The variation of the slope can be easily recognized.

Figure 4 shows the determined curvatures for sample A for different temperatures. The temperature is increased gradually with a step size of 50 °C from RT up to 200 °C. At each measurement, a holding time of 1 min is applied in order to avoid temperature gradients within the sample. After reaching 200 °C, the sample is cooled down to RT, while again curvature measurements are performed every 50 °C. The black solid dots in Figure 4 represent the determined curvature during heating, while the open symbols represent the determined curvatures during the cooling phase. It can be clearly seen that the curvature of sample A changes from a convex shape at RT to a concave shape at approximately 125 °C where the sample is almost flat. Since the adhesive curing is performed at 130 °C, this result is reasonable. Furthermore, the adhesive changes its properties dramatically above the glass transition temperature (T g = 100 °C). The stiffness changes from 3.4 to 0.04 GPa, which leads to a relaxation of the sample. Figure 4 shows that the deformation of sample A because of temperature change is fully reversible. There is no change in the determined curvature at RT after a temperature cycle, κ = −6 m−1.
Curvature values calculated from the shift of the rocking curve maxima by linear regression, plotted as a function of the temperature. The graph refers to the sample A. Data referring to the cooling phase are indicated by open symbols and dotted lines.

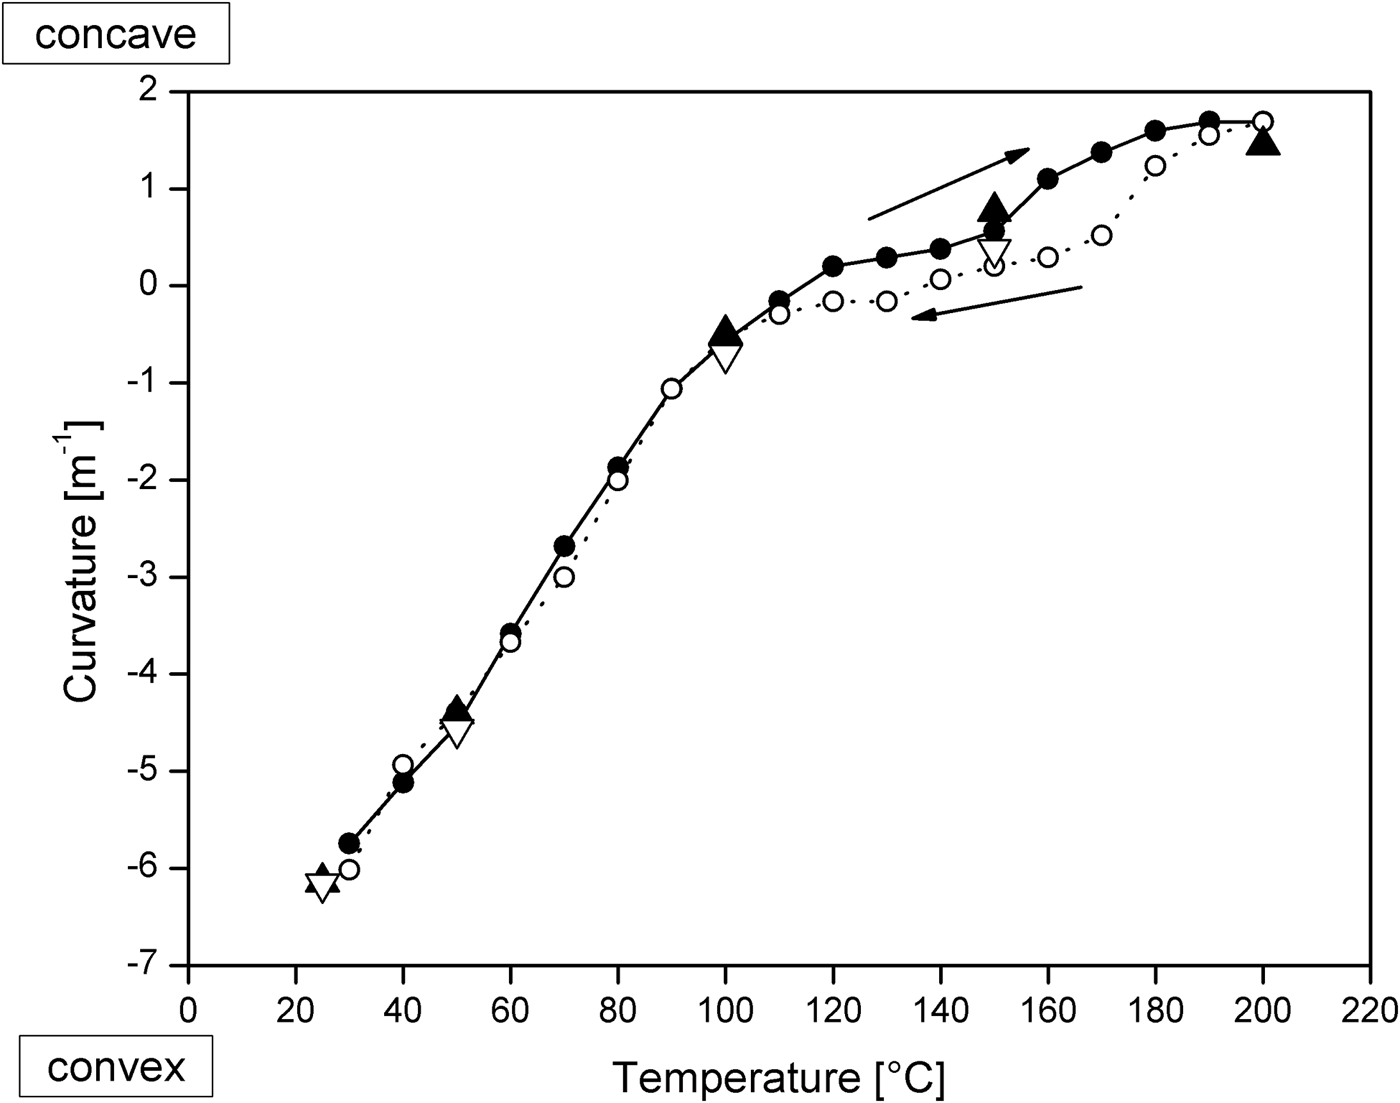
Figure 5 shows the determined curvatures for sample B. Again measurements at RT and at elevated temperatures (every 50 °C up to 200 °C and back to RT) are performed. Contrary to sample A, a concave shape of sample B is observed at RT. However, the curvature changes from a concave shape at RT to a convex shape at 100 °C. A further temperature increase leads to a decrease of the curvature. At 200 °C (lamination temperature) a curvature of −0.5 m−1 remains. The reason could be the cure shrinkage of the resin, which occurs at approximately 170 °C. During cooling to RT, the curvature increases between 150 and 100 °C. Further cooling leads to a decrease of the curvature. However, the shape of sample B remains convex after cooling to RT. The non-reversible deformation of sample B could be explained by viscoelastic or viscoplastic deformation of the polymers and/or because of damage within the package.
Curvature values calculated from the shift of the rocking curve maxima by linear regression, plotted as a function of the temperature. The graph refers to the sample B. Data referring to the cooling phase are indicated by open symbols and dotted lines.

B. Relation of curvature and FWHM rocking curve
Regarding Figure 2 the changes of the FWHM (or β = Δθ) of the rocking curve for different curvatures can be recognized: a higher curvature correlates with a higher FWHM (β). In Figure 6, the relation between the FWHM (β) of the rocking curve and the corresponding curvature κ = f(β) deduced by the conventional method described above is plotted. Such an investigation has been conducted for sample A. Assuming a parallel beam, a simple relation between β and the curvature radius R = 1/κ can be given. We suppose a beam width W = 0.3 mm and an angle of incidence γ = ½ 2θSi = 34.6°. Then we will get according to Wang et al. (2009):
 $$\beta = \Delta \theta = \vert W/\left( {R\cdot {\rm sin}\gamma} \right) \vert\cdot 180^\circ /\pi = \vert W\cdot \kappa /{\rm sin}\gamma \vert\cdot 180^\circ /\pi.$$
Rocking curve widths (FWHM) of sample A plotted vs. curvature data as calculated from the shift of the rocking curve maxima at different sample positions. The dotted line refers to the linear fit function for the actual diffraction geometry. The straight lines indicate the theoretical graphs for various angles of divergence or convergence of the incident beam.

For the correction of the beam divergence (angle of aperture) ξ of the adjusted diffractometer setting a corrected value of β′ = Δθ′ = |β ± ξ| must be taken. Here the plus-sign refers to a divergent beam and a minus-sign to a convergent beam. We have defined a convex surface by a negative and a concave sample surface by a positive curvature. The absolute values (indicated by vertical bars) in (1) have to be used to avoid negative values for the FWHM.
This relation corresponds with the slope in the plot presented in Figure 6. A best fit can be achieved assuming a beam divergence ξ = + 0.07° and an effective beam diameter of 0.213 mm. Consequently, it is interesting to note that in case of non-parallel incident beams the smallest rocking curve widths are not observed at flat samples (κ = 0). A convex sample surface and a divergent beam can for example result in a sharp rocking curve (β′ = Δθ′ = 0) if the condition β = W · κ/sinγ · 180°/π = ξ is fulfilled. The observed mean irradiated length W′ (cf. Figure 7) fits well to the average irradiated length W′/sinγ = 1/4 · π · W/sinγ = 0.236 mm/sinγ. Here W′ can be interpreted as the length of the short side of a rectangle of the same area as a circle with a diameter W (equal to the length of the rectangle), i.e.
 $$W\!\cdot W^{\prime} = 1/4{\rm} \cdot W^2 \cdot \pi.$$
Shape of the irradiated spot (circle) on the sample during the rocking curve experiments; the short side (W′) of the rectangle coextensive in area (shaded) corresponds to the mean irradiated length on the sample, which is relevant for the curvature determination; the long side of the rectangle (W) is equal to the beam diameter. The diagram refers to incidence perpendicular to the sample surface, the irradiated spot will be dilated by a factor of 1/sinγ in horizontal direction (bold arrow, direction of the X-ray beam), γ denotes the angle of incidence.

In Figure 8, the curvature data as calculated from the regression in Figure 6 (small symbols in 10 °C steps) are displayed for sample A. The corresponding data from Figure 4 (large symbols in 50 °C steps) are added in the diagram for comparison. The remaining rocking curve width is caused by the waviness of the sample surface, by defects in the silicon single crystal, and by the finite focal spot size of the X-ray tube anode. In Figure 9, three rocking curves of a chip sample with a relatively high surface waviness are displayed in a stacked plot. The plotted curves refer to the same diffraction geometry and the same sample, only the collimator diameter is changed from 0.3 mm (solid line), 1 mm (dashed line) to 2 mm (dotted line). The rocking curve width broadening with larger collimator diameter as discussed above, and the increasing aberrant peak shape is obvious. The latter effect is caused by the mosaic structure and by the surface waviness of the material. For the determination of the curvature from the peak width (FWHM), the waviness of the material should not exceed a specific limit, which depends on the collimator diameter. Consequently, this method is not applicable if the rocking curve displays such an aberrant behavior and no clear maximum can be assigned. This problem is reduced in most cases by the use of a smaller collimator diameter so that the irradiated sample length is smaller than the characteristic length of the surface waviness.
Curvature values for sample A obtained every 10 °C as calculated from the regression function deduced in Figure 6. Data referring to the cooling phase are indicated by open symbols and dotted lines. Large symbols refer to the curvature data obtained every 50 °C, which were calculated from the shift of the rocking curve maxima.
Rocking curves obtained from a non-laminated chip sample (sample A). The curves refer to three different collimator diameters as indicated. The irregular peak broadening is caused by the surface waviness of the silicon chip.

For the estimation of the layer thickness limit up to which useful curvature measurements can be conducted, the absorption coefficient μ of the used prepreg layer material is determined for the specific radiation wavelength used. For this purpose, the attenuation of diffraction intensity for a specific rocking curve experiment is determined as a function of an increasing number of prepreg layers (up to 16 layers), which are subsequently placed into the X-ray beam (perpendicular penetration). Each layer has a thickness of 76 µm. In Figure 10, the natural logarithm of the observed integrated diffraction intensity
 $I\left( d \right)/I(d = 0) = \sum\nolimits_{\theta = 34^\circ} ^{\theta = 36.5^\circ} {I(\theta, d)} $
is plotted against the total thickness d of the absorbing prepreg layer. In accordance with the Lambert–Beer law ln(I/I
0) = −μ d, the slope in such a diagram, which is received by linear regression is equal to the absorption or attenuation coefficient μ of the layer material. For the applied CuKα radiation a value of μ = 4.64(3) mm−1 equal to a half value thickness d
1/2 = ln(2)/μ = 0.149 mm is found. In Figure 10, the results of these measurements combined with theoretical attenuation data for polypropylene (μ = 0.321 mm−1) and copper foil (μ = 45.62 mm−1) are displayed. If a tolerant minimum of 10 for the peak-to-background ratio for useful rocking curve measurements is assumed, no measurements can be conducted if μ d < 7. However, for the rocking curve measurements, the prepreg layer has to be passed through twice at an angle of incidence γ = ½ 2θ
Si = 34.6°. The effective path length d′ = 2 d/sin (γ) = 3.52. d requires the correction of the given thickness values at the X-axis in the diagram in Figure 10 by a factor 1/3.52. Consequently, a maximum of 0.04 mm copper foil, 0.4 mm actual prepreg material or 5.8 mm polypropylene can be transmitted easily if CuKα radiation is applied. These values, which are surely not the limit of the method, should be interpreted as guidelines depending on the device (dependent on radiation, diffraction geometry, counting time, and detector sensitivity).
Natural logarithm of the integrated intensity of a rocking curve of a typical sample plotted as a function of the transmitted pre-preg layer thickness. The black squares indicate actual measurement results, the lines refer to calculated reference values for copper and polypropylene layers.

IV. CONCLUSIONS
The rocking curve X-ray diffraction technique is adapted to determine the curvature of single-crystalline silicon chips embedded into PCBs at RT conditions as well as at non-ambient temperatures (up to 200 °C). Two variants of this method are used: (1) the observation of the shift of the rocking curve maximum as a function of the XY-position of the sample; (2) the direct curvature determination from the rocking curve width (FWHM). An analytical correction of the curvature with respect to the incident X-ray beam divergence, diffraction angle, and effective beam diameter is presented. In addition, a quantitative discussion of the absorption effects in the embed medium is included. It enables the estimation of the upper thickness limit up to which a material with a specific known attenuation coefficient can be investigated with the presented procedure.
First, a bonded silicon chip on a copper foil is used as a reference sample to demonstrate the accessible precision of the rocking curve method and to highlight its possible difficulties and limitations as well.
Second, the curvature of an embedded silicon chip is determined at elevated temperature. It is shown that in situ measurements at elevated temperatures of encapsulated samples (directly inside the package) are possible.
Consequently, this technique can be a valuable tool for the large microelectronics community in respect of production, quality control, and development.
ACKNOWLEDGEMENTS
The authors thank K. Skalnik for assistance during the measurement data evaluation and A. Bubnik for technical advice concerning the diffraction and absorption experiments. Furthermore, we thank T. Krivec and M. Morianz from AT&S and A. Lecavelier from Thales Global Service for helpful discussion and for providing samples and material data. Financial support by the Austrian Federal Government (in particular from Bundesministerium für Verkehr, Innovation und Technologie and Bundesministerium für Wissenschaft, Forschung und Wirtschaft) represented by Österreichische Forschungsförderungsgesellschaft mbH and the Styrian and the Tyrolean Provincial Government, represented by Steirische Wirtschaftsförderungsgesellschaft mbH and Standortagentur Tirol, within the framework of the COMET Funding Program is gratefully acknowledged.



