

‘Quantity has a quality all of its own.’
-- Variously attributed to Lenin, Trotsky, or Stalin observing how massed Red Army troops overwhelmed opponents, but most likely misquoted from Carl von Clausewitz, On War
Are club goods becoming more widespread in developed economies, and, if so, what is the broader significance of this trend? This paper complements Selmier's article, in this issue, on the emergence of club goods in finance by demonstrating the growing economic significance of club goods for what are traditionally thought of as non-financial enterprises. I make four connected arguments. First, club goods—or as I will relabel them, ‘franchise goods’—based on intellectual property rights (IPRs—patents, copyrights, trademarks, brands, etc.) have become increasingly important in the generation of profits for American and many non-American firms. Indeed, corporate strategy today largely revolves around the generation or acquisition of IPRs and other club/franchise goods. Second, while the linguistic and real world contrast or conflict between ‘Main Street’ and ‘Wall Street’ may have made sense a half century ago, it has limited analytic utility today. Financialization is not just about the credit relationship between financial firms on the one side and non-financial corporate and household borrowers on the other, but also about Main Street's ability to use financial power to suppress competition in its own markets. In this process parts of Main Street are fused with parts of Wall Street. In essence, this paper meets Selmier's because some financial and non-financial firms are respectively transforming private and public goods into club goods in the search for monopoly rents.Footnote 1 Third, firms’ strategic reliance on IPRs and club goods more generally has magnified both profit and wage inequality in the broader economy. This inequality combines with changes in corporate structure to produce a significant part of the household level income inequality we currently observe in the United States. Fourth, all these processes are ineluctably political. The state necessarily constitutes the property rights that turn what might otherwise be public goods into club or franchise goods.Footnote 2 The quantity and quality of those property rights is an indeterminate outcome of struggles among firms over the size of and shares of the pool of profits in a given national and global economy. Just as in the past, those struggles occur partly in the market. Unlike in the past, where struggles for control over the factory floor largely determined the distribution of profits between capital and labor in oligopolistic markets, today firms struggle among themselves to create and defend monopoly positions. They do so primarily in the political and juridical arenas, via litigation over IPRs, lobbying to expand IPRs, and U.S. state efforts to export its preferred version of IPRs to the rest of the world via trade agreements.Footnote 3 The rest of this article will try to show why this is so.
Part one discusses property rights to clarify the status of IPRs as club/franchise goods. Part two looks at the shift in the sources of profitability in the U.S. economy to show why the Main Street/Wall Street dichotomy obscures more than it reveals. Part three uses ten years of data from the Forbes Global 2000 (the 2000 largest firms annually, from 2006 to 2015) and the Osiris dataset to show that firms possessing robust IPRs now capture a disproportionate share of U.S. and global profits.Footnote 4 Part four briefly discusses changes in corporate structure to show how changes in industrial organization translate inequality in corporate profitability into individual income inequality. It then concludes.
1 Property rights and club goods
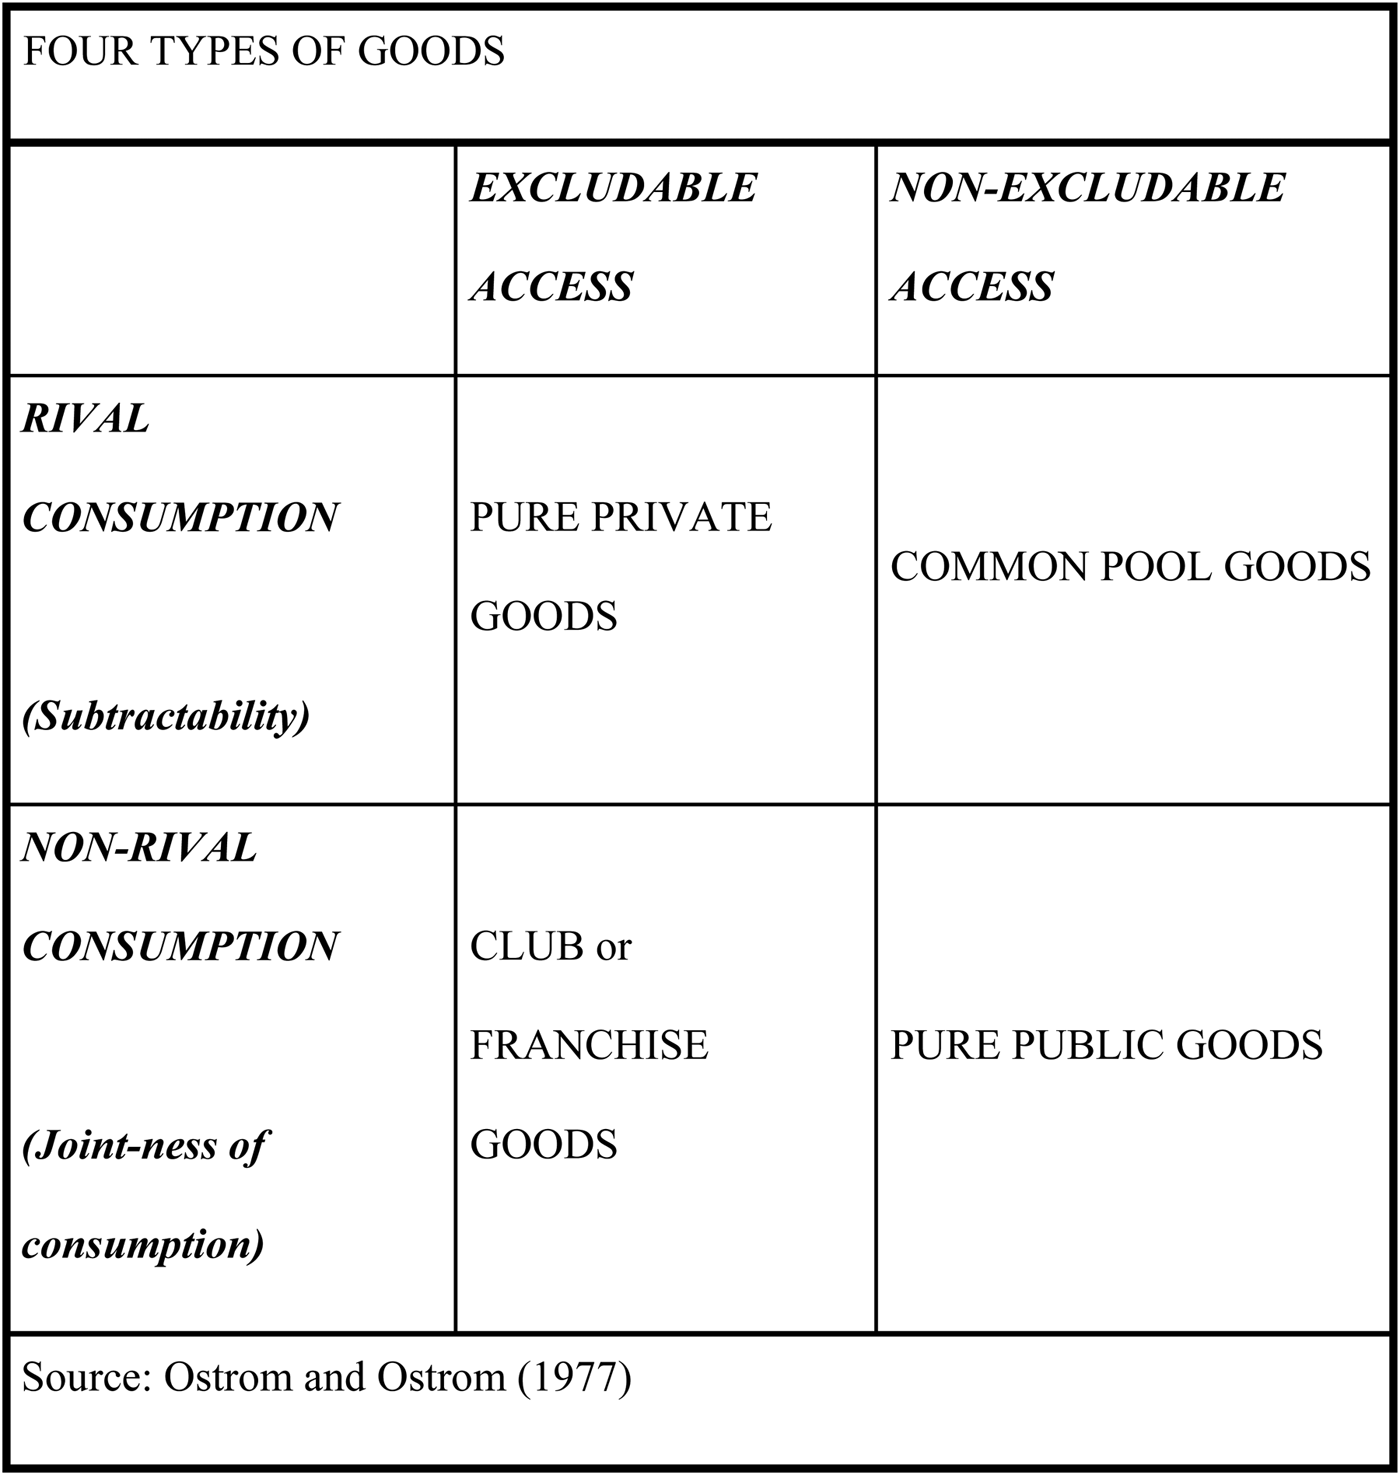
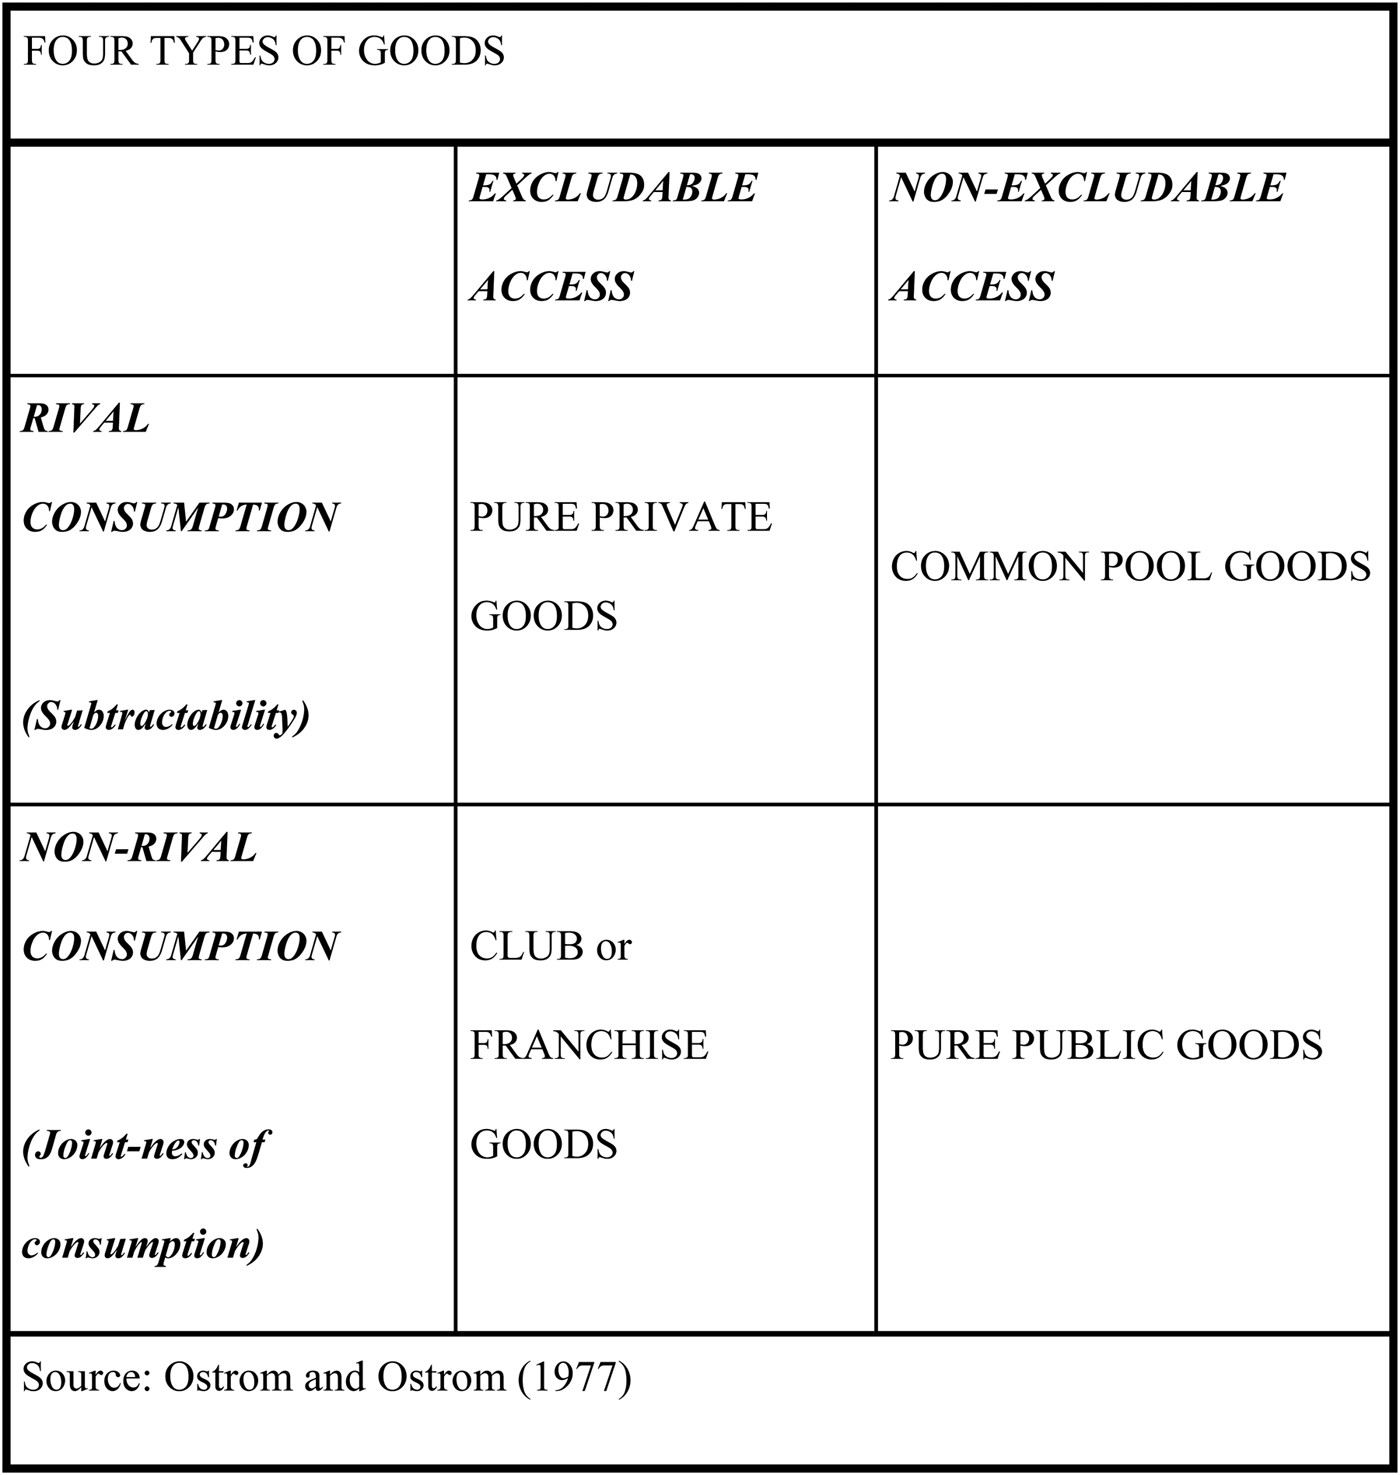
Property rights define who gets what when a given stream of income is divided. But different kinds of property and thus different kinds of property rights exist. The Ostroms defined goods using the two binary characteristics of excludability (essentially, can I legally prevent someone from consuming a good?) and rivalry/subtractability in consumption (does my consumption of a good subtract from what you can consume of that good?).Footnote 5 These characteristics define four ideal types of goods with potentially different kinds of property rights: private goods, public goods, common pool goods, and club/franchise goods (Figure 1). As with all ideal types, these four types simplify a more complex reality in which specific commodities often blend characteristics of all four types in varying proportions. But specifying the types is a useful analytic exercise that fills out the classic Campbell and Lindberg argument that the state constitutes different types of industrial organization when it constructs different kinds of property rights.Footnote 6 Property rights are not simply about a reduction of transaction costs in exchange as the stream of research stemming from Demsetz argues.Footnote 7
Four Types of Goods
Private goods, defined by excludable access and subtractable/rival consumption, are the default category for thinking about property. Yet as anyone who has examined the deed to a house can attest, an owner's rights around what looks like private property are often circumscribed in various ways. In orthodox economics, private goods face minimal production problems because property rights appear to be relatively easy to establish and these create a basis for both supply and demand. Property rights—excludability—create an incentive to produce goods for rivalrous consumption. In order to consume the good, I must not only purchase it but also bid against other potential buyers. This bidding up process incentivizes other actors to produce the good. Their property rights over the good are not extinguished until and unless they transfer that right to me for some consideration. As long as the costs of production and transaction are below what consumers willingly pay, someone will produce these goods.
Common pool goods (Ostrom labels them common pool resources—CPRs) are easy to extract, but in the absence of easily enforced property rights (non-excludability) are not reproduced.Footnote 8 Rivalrous consumption encourages those who can capture these resources to extract them as quickly as possible. But the inability to enforce property rights over and thus sell any newly created CPRs means that potential producers cannot recoup their production costs, so no one invests in more production. CPRs are thus subject to exhaustion in the so-called tragedy of the commons.Footnote 9 Ostrom's work focused on the myriad ways in which self-organized groups could collectively constrain extraction of CPRs below the natural level of replenishment.Footnote 10 The central point, however, is that private production of CPRs does not automatically occur. Instead, top-down or bottom-up institutions are required in order to transform CPRs into some kind of individually or collectively held private good by attaching a monetary or social price to extraction of the CPR.
The same lack of private production also inheres to public goods, both in their full sense as goods from whose consumption no one can be excluded and in the Olsonian sense of goods from which members of a specific sub-group cannot be excluded. Consumption is non-rivalrous, which implies that unlike CPRs exhaustion is not an immediate problem. Yet public goods also suffer from under- or non-production because without excludability, without property rights, no one will want to bear the cost of production for a good that they cannot reliably sell in the face of free riding. Instead, public goods are only produced via either social or state coercion that compels free riders to bear their share of the cost of producing these goods, or through regulation that forces producers to internalize the cost of ‘bads’ produced in the course of their production of other goods. The contemporary ‘information economy’ is built on a foundation of public goods in both senses: goods that by nature are non-rival in consumption and difficult to make excludable, and whose production is publicly financed.Footnote 11
Finally consider what the economics profession usually calls ‘club goods.’Footnote 12 The economics profession uses social clubs as their example for club goods, and thus sees no barriers to their production. Consumption is non-rivalrous, in that your enjoyment of our shared social activity does not limit my enjoyment (and indeed might enhance it). Production of those social activities has costs, like any production process, but the requirements for club membership—and the imposition of an entry or membership fee—assures that those costs are borne by those who enjoy the good, unlike the situation with public or common pool goods. Moreover, the value of club goods increases from network effects (a feature of joint-ness of consumption). So far, so good. Yet the choice of the label club good and the associated example is somewhat misleading because it conjures up voluntary association. The choice of ‘clubs’ distracts attention away from the issue of what exactly creates the excludability that distinguishes a club good from a public good.
In Ostrom's terms, information wants to be a public good, i.e., one that is non-rival in consumption and non-excludable, and thus ‘free.’Footnote 13 Consider digitized music, which is close to being a pure public good by being non-excludable, non-subtractable. A digital copy of a piece of music using a standard coding format can be distributed to and used by anyone with a device that can play that codec. Production costs for digitized music are essentially the studio rental fee, which is so low that even political science professors can record albums.Footnote 14 Given very low production costs, the average cost of production is minimal, the marginal cost of reproduction is essentially zero, and in principle nothing prevents people from freely sharing these files. And indeed, music revenues have been falling continuously since 2000 according to the Recording Industry Association of America (RIAA).Footnote 15 How can firms producing music be profitable in this environment?
Precisely because it is not profitable to produce public goods, states, and especially the U.S. state, transform some public goods into club goods, which combine non-rival, non-subtractable consumption with the possibility of exclusion. The dominant firms in the contemporary economy—those with large shares of profits, market capitalization, and growth—largely produce these non-rival, non-subtractable goods as either intermediate or final goods. This is why I prefer the term ‘franchise good.’ A franchise originally meant a royally granted monopoly right to exploit something, explicitly backed up by force.Footnote 16 The defining feature of a franchise good is that the state creates and enforces both the quantity and quality of excludability, and by doing so determines the volume and duration of profit potentially captured using that property right. Profitability for these firms rests more on the specific terms of their IPRs than on production costs.
Thus the music industry has directed major lobbying efforts towards creating, enforcing, and extending the Digital Millennium Copyright Act (1998) as well as the Copyright Term Extension Act. The DMCA makes it illegal to thwart copyright protection methods using software or hardware; the CTEA extended copyright on works for hire to ninety-five years, retroactive to 1923. The RIAA spent roughly $90 million lobbying to broaden the DCMA over the decade of the 2000s, and an additional $64 million in litigation against alleged pirates.Footnote 17 RIAA sought a steady expansion of the scope and effectiveness of the restraints on unlimited copying of digitized information, thus making it possible to monetize digitized music.
The ‘quality’ of these property rights (e.g., their duration, exceptions, or mandates for licensing) matters as much as the ‘quantity’ (i.e., the sheer fact of a patent or copyright). Because the stock market capitalizes the future stream of profits from any given property right, longer duration for an IPR, or limits on forced licensing, translate into larger capitalization. Politically defined IPRs thus determine both the profit stream inhering to an IPR and thence the wealth that income stream creates for firms producing franchise goods. ‘Politically determined’ profitability here refers to the whole package of electoral, lobbying, and litigation activity that affects both legislation and interpretation of that legislation by courts and administrative agencies granting monopoly rights (e.g., the United States Patent Office), in contrast to the kind of profitability that comes from internal engineering improvements that reduce production costs.Footnote 18 Profitability in franchise goods sectors is more a function of the former than the latter. Consider the pharmaceutical industry, where the price of products like Daraprim™ and the Epipen™ has nothing to do with production costs and everything to do with patents, regulatory mandates, and lobbying. More generally, Brett ChristophersFootnote 19 has argued that the tension between anti-trust law and intellectual property law is the dominant force determining the balance between competitive pressure and monopoly in the U.S. and British economies.
2 The shift towards club / franchise goods in the U.S. economy
2.1 Franchise goods and monopoly
Over the past fifty years the U.S. economy has shifted from one in which profitability was a function of a firm's ability to control private property and efficiently manage production using that property, towards an economy in which profitability is a function of a firm's ability to extract monopoly rents from complex value chains using their control over IPRs rather than efficient production per se. Concretely, this can be seen in the reversal of position for the automobile and pharmaceutical industries. Automobile gross output was 4 percent of U.S. gross output in 1960, while pharmaceuticals were less than 0.2 percent; in 2014 automobiles were 1.9 percent of gross output and pharmaceuticals were 1.8 percent. Patented drugs accounted for roughly 20 percent of prescriptions but over 80 percent of revenue.Footnote 20 In value added terms, pharmaceuticals were the second largest U.S. industry from 2007 through 2014, followed by semiconductor design and manufacturing. This section contrasts production of and profits from private goods (automobile production in the era of high Fordism), franchise goods (pure design/software production), and intermediate goods (blending physical and IPR production) to make this clear. Think Ford, Apple, and Intel (or IBM).
Three things matter here: the degree to which property rights constitute a legal monopoly position (not simply the exclusive possession of private property but a limit on competitive entry); the degree to which monopoly and oligopoly rents have to be shared inside the firm (a question of industrial organization); and the degree to which profitability rests on factors under private or public control (an important difference between pure private property rights and franchise property rights).
Profitability in the automobile production process—particularly in the era of high ‘Fordism’—rested on a combination of public and private goods. Continuous flow (assembly-line) production can be extraordinarily efficient, and thus extraordinarily profitable. But this profitability requires full capacity utilization to maximize economies of scale.Footnote 21 Automobile production is a capital intensive production process in which the ‘tool,’ i.e., the factory and design, accounts for 50 to 60 percent of final cost.Footnote 22 Maximizing economies of scale through high levels of capacity utilization requires both macro-economic and micro-economic (factory floor) stability.Footnote 23 With respect to public goods, automobile firms needed macro-economic stability in order to sell vehicles at a constant level consistent with stable and hopefully maximum throughput for the factory. With respect to factory floor stability, automobile firms needed assurances that they would be able to control the tempo and organization of production in the face of emergent unions. This latter requirement depends on how property rights around factory machinery on the one hand, and property rights around jobs on the other, emerge through political struggles.
Political struggles from the 1930s through the 1950s in most rich countries produced a compromise in which owners’ property rights as expressed in management's control over factory equipment and thus control over the pacing of production were exchanged for unionized workers receiving guarantees to a stable income through no-layoff guarantees or top-offs to unemployment insurance.Footnote 24 Yet, even in a benign macroeconomic environment profitability required management and owners to actually run their factories effectively.Footnote 25 Their property rights in the factory did not assure profits and only minimally prevented entry by competitors.
What did deter entry was the scale of investment required to compete in automobile production, producing an oligopolistic market structure, as measured by the standard Herfindahl-Hirschman index, everywhere after World War II. Oligopolistic markets produced oligopoly rents. But the physicality of production—in theoretical terms, the rivalrousness involved in the use of capital equipment—had two important implications. First, in order to secure consistent throughput and thus maximum economies of scale, firms had to share oligopolistic rents with unionized workers. So rents were widely dispersed, as unions encompassed essentially the entire blue collar (and in some places white collar) workforce.Footnote 26 Second, equally important, moving from an oligopolistic position to a monopoly position required an expansion of physical capital. Because this expansion involved lumpy fixed investments it risked a loss of economies of scale (and also an increase in dis-economies of coordination, thus producing diminishing returns). Diminishing returns threatened to reduce return on equity. Consequently, the nature of property and property rights limited the drive to monopoly. Tellingly, the major monopolies of the mid-twentieth century were either publicly owned (as in Europe) or privately owned but regulated (as with American telephony in the AT&T era). The nature of private goods, in the form of rivalrousness, set limits on monopoly.
By contrast, franchise goods inherently produce monopoly, because franchise goods enjoy increasing returns and because the property rights around IPRs and other franchise goods typically bestow a monopoly. Thus their rate of return is to a much larger extent determined through regulation rather than private production efficiencies.Footnote 27 Pure intellectual property firms produce various flavors of knowledge: digitized information, chemical formulae, information about consumer purchasing patterns, symbols that motivate purchasing decisions.
The critical difference between franchise goods and franchise property rights as compared to private goods is rivalry or subtractability in the production process. Franchise goods do not suffer from subtractability. In the ideal typical case, expanding production of franchise goods does not require an expansion of productive assets. Apple, for example, does not need a second factory to double the output of iOS or OS X.Footnote 28 Production realities thus set no limits on these monopolies, because economies of scale and thus returns continue to grow with each additional unit of production. Instead, the way the state structures franchise good property rights determines whether a monopoly is created. For example, consider the difference in returns between legal regimes in which patents are or are not limited by mandatory licensing. In the former, returns would necessarily be lower. Or consider the differences in the rate of return to a firm owning some network if they can charge any price to a second firm that desires access to that network; if they must charge the average price of transmission; if they must the charge marginal cost of transmission. Returns to the first firm would drop as we go from the first legal regime to the last one.
Two issues then arise: Why are rents not shared within the firm as with oligopolistic ‘old economy’ firms? Why is the production of complex commodities embodying a franchise good not subject to diminishing returns? The answer is that rents are shared, and that production does exhibit diminishing returns, but that franchise good production enables IPR firms to share rents with a smaller footprint of employees and to shift production, and thus any dis-economies, to the firms that do actual physical production.
IPR-based firms do share part of the rent they collect. Song et al., using a random sample of 6 percent of all IRS form W2 data and covering 100 percent of U.S. firms, show that firms with above average profits tend to pay above average wages.Footnote 29 They report that “virtually all of the rise in earnings dispersion [in the United States from 1978 to 2012] between workers is accounted for by increasing dispersion in average wages paid by the employers of these individuals.” The better paying firms were the ones with higher productivity and thus higher profits. Song et al. calculate that individuals in the top 1 percent of income earners typically worked in firms paying about double the average wage. These firms have higher pay both because they can afford it and for the usual efficiency wage reasons.
Profitability in franchise goods stems from the length and duration of the patent, copyright, etc. A doubling of employee pay—a sharing of the monopoly rent—affects profitability less than it would for an automobile firm. Moreover, a large share of pay in these sectors is contingent, as it is embodied in share options. Finally, these firms also have expelled much of their non-core labor force, limiting the pool of people to whom rents must be redistributed.Footnote 30 So rents are concentrated on a much smaller number of workers. Where the old General Motors once employed 1 percent of the entire U.S. workforce, Apple today employs barely 0.05 percent, and indeed a much shrunken GM still has roughly three times Apple's formal headcount.Footnote 31
Similarly, the shareholder value model has encouraged firms to outsource production to specialist original equipment manufacturers. In the case of Apple, everything physical in its iconic products is made by other firms, and then assembled by contract assemblers like Hon Hai / Foxconn. But this outsourcing model extends into the service sector also, where, e.g., formal franchising of fast food chains is pervasive, or, the hotel industry, which typically involves a brand holder licensing the brand to a separate physical capital heavy entity (the owner of the building) using subcontracted labor.Footnote 32 All of these firms use a large number of contracted in, and thus contingent, labor. This shifts the risks from market volatility directly onto the worker. Industrial organization in the information economy typically involves breaking up production process over three separate types of firms, one specializing in human capital intensive production of IPRs, one specializing in physical capital intensive production of components, and one specializing in labor-intensive assembly, cleaning, materials handling, etc.
Where non-franchise firms competed over production efficiencies, franchise firms compete by defending their monopoly position via the accumulation of robust IPR portfolios and the litigation those portfolios enable. IPR firms use their thicket of patents and copyright to deter entry by competitors.Footnote 33 The Congressional Research Service reports that patents significantly raise the costs non-patent holders incur trying to invent around the patent by an estimated 40 percent for pharmaceuticals, 30 percent for major new chemical products, 25 percent for typical chemical goods, and roughly 7 to 15 percent for electronics.Footnote 34 Older research confirms the difficulties new firms have navigating patent ‘thickets,’ and suggests that microchip makers were expending about $200 million in licensing fees for intellectual property of little utility beyond fending off lawsuits.Footnote 35
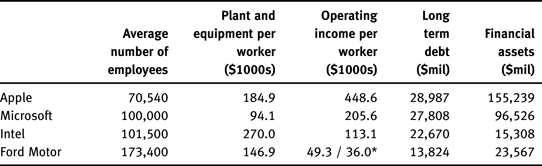
Obviously, hybrid or intermediate firms like Intel also exist. Intel has a large IP portfolio based on copyright of its chip designs, but it also has a large physical capital footprint because it owns and operates a number of semiconductor chip fabrication facilities (‘fabs’). Fabs currently cost around $1 to $5 billion to construct. (By contrast an automobile factory is roughly $0.5 to $2 billion depending on the level of automation.) Hybrid firms like Intel thus must optimize both production efficiencies and network effects for their intellectual property. The differences among these firms can be seen in a simple comparison of profit as a percentage of operating revenue (ordinary sales), gross and net profit per employee, the scale of physical plant and equipment, and debt levels (useful in the next paragraphs) (Table 1). Apple's $29 billion of debt in Table 1 is a bit deceptive—not only do its vast cash holdings more than offset this debt, but the debt was contracted in order to avoid incurring tax liability while transferring part of that cash to shareholders as a special dividend. This debt was not an operating expense as such.
Profitability, labor-intensivity, and physical capital-intensivity of select firms, average, 2010–2014

Sources: Calculated from Bureau van Dijk (Reference Van Dijk2015); annual reports(10Ks) of indicated companies.
* First number includes a once only income tax provision; second number is net of that provision.
2.2 Main Street versus Wall Street?
The nature of the Main Street / Wall Street opposition also changes depending on whether we are dealing with private goods or franchise goods. The classic opposition of non-financial and financial firms arises from a conflict over debt and thus interest rates. Old economy firms with large fixed physical asset bases typically had to finance the acquisition and replacement of that asset base using debt in the form of loans or bonds. Thus in West Germany, 40 percent of industrial finance took the form of bank loans in the late 1960s and 1970s; weakly developed Japanese bond and equity markets meant that Japanese firms relied on bank loans for roughly 80 percent of their external financing.Footnote 36 And while U.S. corporate finance disintermediated much earlier than in the other two major economies, firms still relied heavily on the bond market for finance, with securitized liabilities amounting to more than three-fifths of liabilities for non-financial firms in the 1990s.
Non-franchise, non-financial firms’ reliance on banks and bonds created a direct conflict over interest rates. All other things being equal, the higher real interest rates were the bigger the spread that lending institutions would enjoy. On the other hand, the higher real interest rates were the more costly it was for firms producing physical goods to finance new equipment and work in progress.Footnote 37 This was also true, to a lesser extent, about higher nominal interest rates, because these created a higher hurdle rate for new investment. The larger non-franchise goods firms responded to this situation by internalizing financing. Thus major ‘industrial’ companies, like GM, Ford, or GE became increasingly reliant on their consumer or industrial financing operations (respectively GMAC, Ford Credit, and GE Capital) for profitability. GE Capital, for example, ran a thinly disguised money market operation (GE Interest Plus) to raise money for its own internal financing needs and also to supply vendor credit to its industrial customers.Footnote 38 Ford Credit accounted for roughly 30 percent of Ford's profits 2011 to 2015.Footnote 39 This hybridization did not remove the inherent conflict between financial and non-financial firms, but rather allowed some nominally non-financial firms to walk on both streets. Main Street firms that were too small to create financial subsidiaries continued to suffer from higher real interest rates.
By contrast, franchise firms have a commensal relationship with the financial sector. Like industrial firms, these firms often need to make a large upfront investment to generate a product. Unlike industrial firms, these firms are largely investing in people's time rather than in physical equipment. Labor time cannot be collateralized, and so these firms find it difficult to secure traditional loan or bond finance. Instead, they rely on venture capital and workers’ willingness to accept deferred wages in the form of share options.Footnote 40 The reliance on venture capital generates part of the commensality with Wall Street. Venture capital firms most obviously have a stake in the success of franchise-type firms, because venture capital firms cannot recoup their investment without doing an initial public stock offering (IPO). The major Wall Street investment banks share in the proceeds of that IPO both on a transactional basis and via their ability to allocate the first tranche of shares floated to favored customers. Finally, the surest way to retain a monopoly position is to pre-emptively buy up potential competitors, so franchise firms also generate considerable merger and acquisition activity for investment banks.
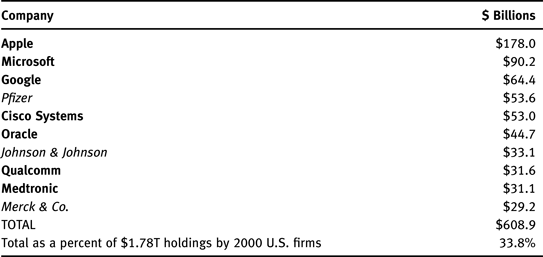
Post-IPO and merger, this commensality continues. Franchise firms generate monopoly profits but do not suffer from physical depreciation of their production apparatus. Consequently, they generate enormous volumes of liquid capital that flow through Wall Street. Among the top ten U.S. firms with the largest cash holdings of cash and cash equivalents at the end of 2014, the largest physical capital footprint is represented by three pharmaceutical firms (Table 2). These have considerably less of physical capital base than most industrial firms, and spend disproportionately on research (and marketing) rather than production. The top ten account for over a third of all cash holdings by U.S. firms. Among the fifteen firms with the largest cash holdings in 2014, only one, Exxon, is arguably a pure physical production, private goods type firm. The other fourteen are firms that rely on IPRs for their profitability.
Top ten U.S. firms by cash holdings at December 2014
‘Tech’ in bold; Pharmaceuticals in italics

Source: Compiled from Mergent Online, Reference Online2015.
Firms struggle to secure a share of the value created in global value chains. Franchise good-type firms have captured a major share of that value. This capture is the major reason to analyze firms in terms of the kind of property rights they possess. Nominal categories, like ‘tech,’ obscure more than they reveal when to comes to understanding who gets what in terms of profits, and how they get that share. The next section shows that firms with robust IPRs have been capturing the bulk of corporate profits.
3 The distribution of profits among firms
Profits are highly concentrated in the global and U.S. economy, and within the group of ‘winners’ profits are highly concentrated in a handful of IPR-heavy firms. Out of roughly 28,000 global firms with annual revenues over $200 million tabulated by McKinsey, roughly one-third of total profit accrues to the 2000 firms in the Forbes Global 2000, although these amount to only 7.1 percent of those 28,000 firms.Footnote 41 The Forbes Global 2000 (FG2k hereafter) are the 2000 largest firms in the world. Among the FG2k, the top twenty-five U.S. firms—0.01 percent of McKinsey's 28,000 firms and 1.25 percent of the Forbes 2000—account for 13.5 percent of all profits from 2005 to 2014 for the FG2k group, 41 percent of profits for the 597 U.S. firms within that group, and roughly 4.5 percent of all profits for the 28,000 firms McKinsey analyzed. Using a standard measure for inequality, the Gini index (where 1 equals perfect inequality and 0 equals perfect equality), to assess the distribution of profit just within the FG2k shows levels of inequality for profits that are significantly higher than any given national economy. The Gini index for the distribution of profits among the FG2k over the ten year period 2005 to 2015 is .809. By comparison, some of the most unequal societies in the world, South Africa and Brazil, typically have Gini indices of roughly .600, and the highly egalitarian Nordic countries have Ginis typically around .250.
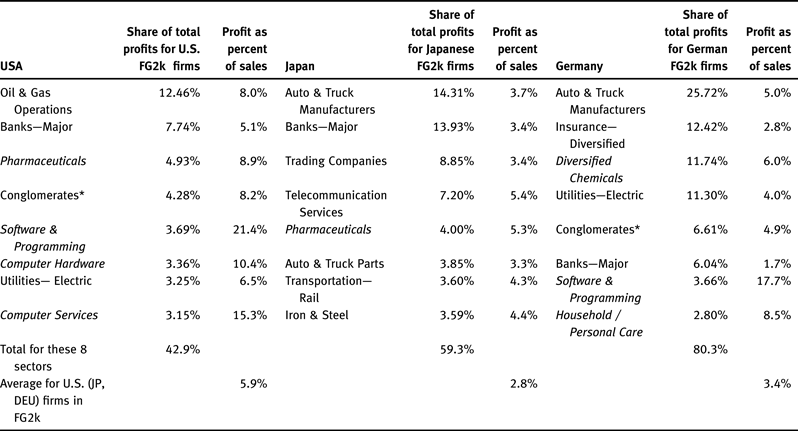
But this inequality in and of itself does not tell us about what kind of firms get these profits. A closer analysis shows that a few narrow groups of firms capture most profits. Unsurprisingly, these include the giants of the old automobile-petroleum economy, the big banks within the financial sector, and the larger utility firms. But, to a surprising extent, given their small labor and physical capital footprints, franchise firms capture a considerable share of global profits. Table 3 presents the eight largest sectors by share of profit for the three largest capitalist economies. Franchise good sectors are coded in italics.
Eight largest sectors in the Forbes Global 2000 by share of profits in Germany, Japan, and the United States, plus cumulative profit as a percent of cumulative sales by sector, 2005 to 2014.

* Primarily GE, 3M, and large defense contractors like Honeywell and Textron in the United States; Siemens in Germany. These firms are like Intel, blending industrial production with considerable in-house IP. The average profit as a percentage of sales for the entire FG2k is 5.6%.
Source: Author's calculation from Forbes Global 2000 data for indicated years.
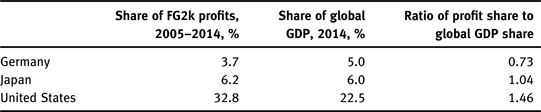
Three things emerge from this table. First, the Japanese and German economies continue to be dominated by old economy firms, though this is relatively less true of the Japanese economy. The only U.S. old economy equivalent is the salience of the large multinational oil firms. However, historically high oil prices from 2005 to 2014, precisely the period for which we have data, exaggerate their share of profits.Footnote 42 Oil firm profits crashed along with oil prices in 2014 to 2016, with major firms like Exxon-Mobil seeing profits fall by 60 percent and firms like BP and Chevron actually running losses.Footnote 43 The old-economy orientation of the German and Japanese economies shows up in a relatively small share of global profits (Table 4). Microsoft alone (with on average 100,000 employees) made cumulative profits of $155 billion, which was only a bit smaller than the combined $190 billion profit at VW-Audi, Mercedes, BMW, and Porsche (with on average 890,100 employees). Similarly, Microsoft's profits approximated those of the three major Japanese automobile firms (with on average 638,200 employees) at $159 billion.Footnote 44
Relative share of total profits by the Forbes Global 2000, 2005 to 2014

Source: Author calculation from FG2k and International Monetary Fund, World Economic Outlook Database, https://www.imf.org/external/pubs/ft/weo/2015/02/weodata/index.aspx.
Second, profits as a percentage of sales are considerably higher for franchise good firms than for non-franchise goods firms as another Microsoft to automobile firm comparison shows. Microsoft’s 25.5 percent profit to sales ratio, 2005–2014, was roughly four to five times as large as the automobile firms’ profits as a percentage of sales, which ranged from Daimler's 3.0 percent to VW-Audi's 5.4 percent.Footnote 45 We might expect very narrow profit-to-sales ratios for final retailers, most of whom operate on narrow margins but with large volumes (think: Walmart). But it is not obvious why this should be true for large integrated manufacturing firms. By contrast, the oil companies typically had profit-to-sales ratios of roughly 10 percent.
Third, the big exception to the high profitability of firms with robust IPRs is the Japanese pharmaceutical industry, where profits as a percentage of sales are similar to the level in the other seven sectors, rather than the 8.9 percent for the entire U.S. pharmaceutical sector, or the 18 percent typical of large firms like Merck, or the 23 percent typical of established biotech firms like Amgen. This exception proves the point, however, as the Japanese state heavily regulates prices in the pharmaceutical market. Japanese firms find it difficult to use their IPRs to set monopoly prices, and profits suffer accordingly.
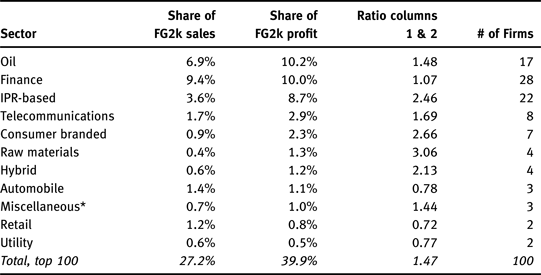
Aggregate data show that this pattern holds both in the U.S. and global economies. A handful of big firms capture most of the profits. Among those firms, the finance, franchise, and legacy auto-petroleum sectors dominate. If Selmier is correct that finance is a franchise or club good type business, then the shift of profits from old economy, private goods-type firms to new economy, franchise goods-type firms is quite evident.Footnote 46 Table 5 displays only the top one hundred firms by cumulative profit among the FG2k. These firms account for almost 40 percent of the total profits of the entire FG2k and thus approximately 12 percent of the total profits of the 28,000 largest firms globally. While oil firms lead with about a tenth of total profits for this group, the combined share of pure IPR firms (software, pharmaceuticals, and computer services), hybrid firms (e.g., Intel) and consumer branded firms (primarily beverages and tobacco) exceeds that of either the oil sector or the combined oil-autos group.
Sector shares of sales and profits for Top 100 firms in Forbes Global 2000, ranked by share of total profits in the FG2k

* Berkshire Hathaway, United Health Care, Schlumberger.
Source: Calculated from FG2k data
Relative to their share of global sales or employee headcounts, firms with robust IPRs capture a disproportionate share of global profits. As oil and raw materials prices equilibrate downward from the usually high levels associated with the U.S. housing / China investment bubbles, the relative share of IPR and hybrid firms will tend to rise. If we aggregate firms whose profits rest on control over club or franchise goods, these account for nearly a quarter of profits for the top one hundred firms by profits in the FG2k.
4 Implications for income inequality and growth
Income inequality has been increasing in the rich OECD countries since the 1980s.Footnote 47 One important source of that inequality has been the rising salience of franchise or club goods not only in the financial side of the economy but also in the production side. The rising salience of property rights around franchise goods for profitability links many seemingly disparate trends. It is in this sense that quantity, in this case the quantity of profit captured, begins to have a quality all of its own. These trends operate first through inequality of profits among firms. Firms with IPRs and other franchise property rights accrue monopoly profit. As with old economy oligopolistic firms, those profits are often shared within the firm. But under relentless pressure to conform to the shareholder value model, franchise firms also face significant incentives to minimize their physical and labor footprint in order to maximize returns on a much smaller set of physical assets. This changes the industrial structure by splitting the labor force into employees with good, well-paying, standard jobs in IPR and human capital-intensive firms and much less well paid typically non-standard employees in labor-intensive firms. As noted above, physical capital-intensive firms occupy an intermediate position, but they too face shareholder value-type financial market pressures to supplement their workforces with contingent labor and to minimize new capital investment.Footnote 48 Unionization and a robust welfare state can mitigate the effects of this process but do not prevent it: Pre-tax and transfer market incomes in Sweden are as unequal as those in the United States, and the Gini index in both countries has risen at a similar pace from 1982 to 2013.Footnote 49 Equalization in Sweden operates through a welfare state that offsets the effects of an economic transition towards a franchise good economy.
Second, the shift towards franchise goods and their related IPRs also tends to dampen economic growth. Greater income inequality concentrates more income into the hands of people with a lower marginal propensity to consume, which reduces one impulse for growth. But it also concentrates more profit into the hands of companies that both have financial disincentives to invest in physical capital and little need to invest in physical capital. By contrast, physical capital-intensive firms are relatively starved of profits and thus also face disincentives to invest. These combine to reduce the impulses for growth. In the United States, this has produced a steady decline in the number of publicly listed firms. The number of American publicly listed firms per capita fell by nearly half from 1996 to 2013, with half the decline attributable to mergers.Footnote 50 On the one hand, franchise firms are aggressive acquirers of potential but immature competitors (vide Google's purchase of YouTube for $1.65 billion) and also voracious purchasers of firms whose value rests only in the potential litigation value of their patent portfolio (vide Google's purchase of Motorola Mobility for $12.5 billion, or Microsoft's purchase of Nokia for $7.2 billion). On the other hand, physical capital firms have been aggressively buying up potential competitors in order to shrink productive capacity so as to regain some bargaining power versus franchise firms (vide Dow Chemical's proposed purchase of Dupont for $130 billion or Intel's 2015 purchase of programmable logic chip producer Altera for $16.7 billion). In both cases profits flow into acquisition rather than the creation of new or better capacity.
Third, no ineluctable technological dynamic drives these outcomes. Political and legal decisions around the quantity and quality of IPRs produce the franchise economy we live in.Footnote 51 It could be argued that the disintegration of the old economy firms and the increasing specialization visible in the tri-partite structure of human capital, physical capital, and labor-intensive firms reflects some logic of economic efficiency. But the marked decline in GDP and productivity growth in the rich OECD countries as this new industrial structure emerged suggests either that increased efficiency deters growth or that this specialization has nothing to do with efficiency. Moreover, a close examination of this tri-partite structure shows that it is largely a legal fiction. In almost all brand-based industries, for example, the brand owner is deeply involved in managing the employees of the fictively independent labor contractor that staffs the actual site of production.Footnote 52 De facto, brand owners must act like employers in order to prevent deterioration of their brand's value. The 2015 National Labor Relations Board decisions in Browning-Ferris and McDonald's affirmed that the brand owner was in fact a joint employer, showing that vertical disintegration is a function of the legal construction of property rights rather than some natural process. These decisions, if upheld, will cause some sharing of monopoly profits akin to the old union-driven sharing of oligopoly profits. This should ameliorate income inequality to a degree.
The so-called information economy is built on the transformation of non-subtractable, non-excludable, and thus public goods into non-subtractable but excludable club or franchise goods. This transformation permits public goods to be monetized as franchise goods, creating a potential stream of profits. The size and duration of that stream of profits depend on the quantity and quality of the property right establishing exclusion. Market structure (monopoly versus competition or oligopoly) and industrial organization (firm size and structure) in the information economy thus do not arise spontaneously from nature. They are political constructs to a much greater degree than was true for the old economy because of the lack of subtractability or rivalry in consumption of information-based goods. Consequently, the state has the power to construct market incomes—to ‘pre-distribute’—to a much greater degree than was the case in the old economy. Given that the state is the source of most of the public goods that get transformed into franchise goods, the rectification of much income inequality could be done without much loss of innovation.Footnote 53