Introduction
China, the most populous country in the world, has followed the demographic transition and fertility transition that occurred earlier in developed countries. China’s fertility has declined consistently following its mortality decline. The total fertility rate (hereafter TFR) was around six children per women in the early 1970s, but it dropped dramatically during the 1970s, fluctuating just above the replacement level in the 1980s, and falling below replacement level in the early 1990s. More recently, China’s TFR has been quite erratic and controversial (Jiang & Liu, Reference Jiang and Liu2016). As in many countries that have completed the demographic transition, China’s fertility declined further to become very low after reaching replacement level in the early 1990s. However, as the population size in China has steadily grown due to the population momentum built during the previous decades, this population growth has reduced the impetus for the government to examine the low fertility and its causes. The fertility and demographic transition produced the demographic dividend, which has stimulated China’s economic development; the nation benefited from the demographic dividend but neglected the consequences foreshadowed by persistent low fertility.
Unlike developed countries that completed their demographic transition, China’s fertility decline has been interwoven with government-led enforcement of the birth control policy. The birth control policy functioned in the early stage of fertility decline, but with the passage of time a wide range of social, economic, political and cultural changes have played increasingly important roles in family formation, reproductive behaviour, fertility patterns, fertility decline and the demographic transition (Zheng et al., Reference Zheng, Cai, Wang and Gu2009; Cai, Reference Cai2010; Zhao et al., Reference Zhao, Xu and Yuan2017). However, the Chinese government overvalued the effect of the birth control policy and underestimated the importance of socioeconomic development. Ignoring the pronatalist policies adopted by those countries that had completed the demographic transition and were confronted with low fertility, the Chinese government assumed that there would be a rebound of the TFR if the birth control policy were eliminated, and it enforced the birth control policy for another two decades during which fertility was low. Recently, the Chinese government has relaxed the birth control policy twice, in 2013 and in 2016, but both failed to produce the expected baby boom.
China’s fertility level and fertility change are the results of many factors associated with socioeconomic development and ideological change. Marriage postponement, and low fertility of married women, will cause the fertility level to decline further. Retherford et al. (Reference Retherford, Choe, Chen, Li and Cui2005) suggested that about two-fifths of the decline in TFR between 1990 and 2000 is accounted for by later age at marriage and three-fifths by declining fertility within marriage. To examine the effect of these two factors on China’s fertility decline during the past decades, to alert the Chinese government to the causes of fertility variation and a potential further decline in China’s fertility, and to address the need to reverse the anti-natalist policy to a pro-natalist policy, further study is needed.
This paper examines the effect of marriage postponement and fertility change of married women on the fertility change in China’s population, in urban and rural populations, and in different age groups and provinces using data from China’s 1990, 2000 and 2010 censuses. The changes in TFR are decomposed into the change in the proportion of married women (hereafter PMW), which indicates the effect of marriage and subsequent childbearing postponement on fertility level, and the change in the marital fertility rate (hereafter MFR). Further, the effects of these two factors on net reproduction rate (hereafter NRR) are estimated, as NRR is not only a fertility indicator but can also be regarded as an indicator of population development. China’s fertility change is analysed, including the roles of different age groups, and of urban–rural and regional differences. The main driving force behind China’s TFR decline is examined, and an attempt is made to predict its future fertility trend. First the fertility change, and recent relaxation of policies in China, are introduced, then the decomposition methods and results for the changes in TFR and NRR are presented. Finally, the conclusions that can be drawn from the study are discussed.
Fertility changes in China
China’s population policy was first initiated as the wan, xi, shao policy, meaning ‘later marriage, longer birth spacing, and fewer children’. In 1980, this policy was replaced by the ‘one child for one couple’ policy, usually referred to as the ‘one-child policy’. Due to strong resistance in rural areas, the one-child policy evolved into a more relaxed ‘1.5-children’ policy; that is, in the majority of China’s rural areas, couples were permitted a second childbirth if their first one was a girl (Gu et al., Reference Gu, Wang, Guo and Zhang2007). The Chinese government attributed the fertility decline in China to this birth control enforcement and claimed that this policy averted over 400 million births in the previous 30 years (Cai, Reference Cai2010).
With the birth control policy, China’s fertility level declined steadily after the 1970s. The TFR dropped dramatically from around six in the early 1970s, fluctuated above replacement level in the 1980s, and fell to below replacement level in the early 1990s. However, the census and annual population survey data since the early 1990s have reflected such a low TFR that the National Bureau of Statistics (NBS) raised the number of births reported annually in the 1990s and early 2000s, although no details of their adjustment methods were made public. The TFR was 1.22 in China’s 2000 census, but was adjusted upward to 1.4 by the NBS for their internal use (Morgan et al., Reference Morgan, Guo and Hayford2009). Charged with implementing China’s family planning policy, the National Health and Family Planning Commission (NHFPC) regarded the fertility level as an underestimate due to under-counting and deliberate concealment of births. In 2013, the NHFPC officially stated that the national TFR was 1.5–1.6 (NHFPC, 2013).
Given the low TFR released by the NBS, scholars have been concerned about possible underestimation of the annual numbers of births released by the NBS in the 1990s and the early 2000s. Recently, a consensus has been reached that China’s fertility has fallen to a very low level (Morgan et al., Reference Morgan, Guo and Hayford2009; Cai, Reference Cai2013; United Nations, 2015; Zhao et al., Reference Zhao, Xu and Yuan2017), but the numerical value of the TFR is contentious.
Besides the uncertainty in the low fertility level, the fertility problem has been complicated by China’s urban–rural and regional differences at the provincial level. The population is divided into three categories in the census data: city population, township population and village (rural areas) population. The first two refer to the population resident in urban areas, while the third refers to the population resident in rural areas. The urban population has a much lower fertility level than its rural counterpart as indicated in census and survey data. The regional difference in fertility at the provincial level is rather significant too, partly because of different socioeconomic development and localized birth control policies among the provinces (Gu et al., Reference Gu, Wang, Guo and Zhang2007; Cai, Reference Cai2010).
Postponement of marriage and consequent delayed childbearing is one component of China’s fertility change. With socioeconomic development and women’s emancipation from traditional roles as wives and mothers, women are pursuing more education and seeking careers, which delays their marriage. A report in August 2018 pointed out that China’s marriage rate has declined successively for years with late marriage being increasingly common (Han, Reference Han2018). As most childbirths occur inside wedlock, the postponement of marriage depresses the proportion of married women of prime childbearing age, and results in a delay in childbearing and a decline in the fertility level (Guo, Reference Guo2017). Such a postponement could partially account for the very low fertility observed in the late 1990s, while increase in childbearing age caused the small reversal of fertility in the first decade of the 21st century (Cai, Reference Cai2013). Moreover, China has experienced radical changes in marriage behaviour, including significant increases in cohabitation, premarital sex and pregnancy, extramarital relationship and divorce (Zhao et al., Reference Zhao, Xu and Yuan2017). All of these will affect the fertility level.
The postponement of marriage and childbearing reflects the very low fertility intention of married women in China. Contrary to the classical ideology of ‘more sons, more blessing’, young couples voluntarily eschew having more children in response to economic and social pressures, and in accordance with their personal career and life goals (Zheng et al., Reference Zheng, Cai, Wang and Gu2009). People limit childbearing as a quantity–quality tradeoff; fertility limitation is taken as a strategic decision to advance offspring quality via increased parental investment per child (Lawson & Mulder, Reference Lawson and Mulder2016). The fertility intention of married women has been one child or two children, and the actual number of childbirths has steadily decreased in the context of China’s socioeconomic and demographic transition, as seen in recent surveys and censuses (Jiang & Liu, Reference Jiang and Liu2016; Jiang et al., Reference Jiang, Li and Sánchez-Barricarte2016).
In 2013, in acknowledgment of the effect of persistent low fertility on long-term balanced national development, structural change in population, shrinking family size, rapid ageing and low fertility reflected in nationally representative samples, China partly relaxed the stringent birth control policy so that couples where either spouse was an only child were permitted to have two children. However, subsequent birth statistics didn’t come up to the projected number of births, and the Chinese government adopted a universal two-child policy in 2016. After a slight increase in 2016, the number of births decreased in 2017, causing debate and concern about China’s fertility and fierce criticism of previous birth projections and policy suggestions. In July 2018, Liaoning Province, whose population had declined successively for several years due to low fertility and emigration, issued the Population Planning of Liaoning Province (2016–2030) policy document, which stipulated concrete terms to raise fertility. It is expected that this provincial pronatalist regulation will be followed by other provinces.
Methods
Non-marital childbearing has emerged in China, but is still not widely accepted. In particular, non-marital childbearing was regarded as illegitimate, and over the past three decades, during the implementation of the strict birth control policy, those who gave birth to a child out of the wedlock were required to pay social maintenance fees (Jiang & Liu, Reference Jiang and Liu2016). Therefore, there are relatively few non-marital births in China, and non-marital births are not considered in studies of fertility in China (Retherford et al., Reference Retherford, Choe, Chen, Li and Cui2005; Yip et al., Reference Yip, Chen and Chan2015). The present study also does not consider non-marital childbearing. In China, nearly 70% of women will give birth to a child within one and a half years of marriage, and 90% of women of childbearing age will give birth to a child within two and a half years of marriage (Li & Jiang, Reference Li and Jiang2009). Since the 1980s, for women of childbearing age in China, the interval between first marriage and first childbirth has shortened slightly (Li & Jiang, Reference Li and Jiang2009).
The term ASMFR a (t) is used to represent the age-specific marital fertility rate (ASMFR) for married women aged a (age-specific MFR) at time t, and MP a (t) is used to represent the proportion of married women (PMW) aged a. Then, the age-specific fertility rate for women aged a is ASFR a (t)=ASMFR a (t)×MP a (t). Let SR a (t) denote the proportion of newborn girls among all births delivered by women aged a and P a (t) denote the probability of female survival from birth to age a.
In some research, the change in TFR has been decomposed into the change in the proportion of married women and the change in the marital fertility rate (Retherford & Ogawa, Reference Retherford and Ogawa1978; Khawaja, Reference Khawaja2000; Retherford et al., Reference Retherford, Choe, Chen, Li and Cui2005; Yip et al., Reference Yip, Chen and Chan2015). The decomposition procedure is essentially similar to the decomposition of changes in crude rates between two time points proposed by Kitagawa (Reference Kitagawa1955), and which has been applied widely (Das Gupta, Reference Das Gupta1993; Jiang et al., Reference Jiang, Yu, Yang and Sánchez-Barricarte2017). This study uses the change in the PMW by age to represent the effect of marriage postponement and consequent childbearing postponement. If the PMW for a certain age group decreases, then marriage and childbearing postponement has occurred among people in that age group. The decomposition formulae used are as follows:
The TFR can be expressed as follows:
 $$TFR(t){\equals}\mathop{\sum}\limits_a {ASFR_{a} (t){\equals}} \mathop{\sum}\limits_a {ASMFR_{a} (t){\times}MP_{a} } (t)$$
The difference between TFRs at times t and t+h can be decomposed into:
 $$\eqalignno{ & TFR(t{\plus}h){\minus}TFR(t) \cr & {\equals}\mathop{\sum}\limits_a {{ASMFR_a}(t{\plus}h){\times}MP_{a} (t{\plus}h)} {\minus}\mathop{\sum}\limits_a {ASMFR_{a} (t){\times}MP_{a} } (t) \cr & {\equals}\mathop{\sum}\limits_a {{{MP_{a} (t{\plus}h){\plus}MP_{a} (t)} \over 2}} {\times}(ASMFR_{a} (t{\plus}h){\minus}ASMFR_{a} (t)) \cr & {\plus}\mathop{\sum}\limits_a {{{ASMFR_{a} (t{\plus}h){\plus}ASMFR_{a} (t)} \over 2}} {\times}(MP_{a} (t{\plus}h){\minus}MP_{a} (t)) $$
The two terms on the right-hand side of equation (2) represent the effect of the change in the MFR and the effect of the change in the PMW, respectively.
The net reproduction rate (NRR) can be expressed as follows:
 $$\eqalignno{ & NRR(t){\equals}\mathop{\sum}\limits_a {ASFR_{a} (t)\,∗\,SR_{a} (t){\times}} P_{a} (t) \cr & \quad \quad \,\,\,\,\,\,{\equals}\mathop{\sum}\limits_a {ASMFR_{a} (t)} {\times}MP_{a} (t){\times}SR_{a} {\times}P_{a} (t) $$
The difference between NRRs at time t + h and time t can be decomposed into:
 $$\eqalignno{ & \hskip -25pt NRR(t{\plus}h){\minus}NRR(t) \cr & \hskip -25pt {\equals}\mathop{\sum}\limits_a {\Delta ASMFR_{a} } (t){\times}{{MP_{a} (t{\plus}h){\times}SR_{a} (t{\plus}h){\times}P_{a} (t{\plus}h){\plus}MP_{a} (t){\times}SR_{a} (t){\times}P_{a} (t)} \over 2} \cr & \hskip -25pt {\plus}\mathop{\sum}\limits_a {\Delta MP_{a} } (t){\times}{{ASMFR_{a} (t){\times}SR_{a} (t{\plus}h){\times}P_{a} (t{\plus}h){\plus}ASMFR_{a} (t{\plus}h){\times}SR_{a} (t){\times}P_{a} (t)} \over 2} \cr & \hskip -25pt {\plus}\mathop{\sum}\limits_a {\Delta SR_{a} } (t){\times}{{ASMFR_{a} (t){\times}MP_{a} (t){\times}P_{a} (t{\plus}h){\plus}ASMFR_{a} (t{\plus}h){\times}MP_{a} (t{\plus}h){\times}P_{a} (t)} \over 2} \cr & \hskip -25pt {\plus}\mathop{\sum}\limits_a {\Delta P_{a} } (t){\times}{{ASMFR_{a} (t{\plus}h){\times}MP_{a} (t{\plus}h){\times}SR_{a} (t{\plus}h){\plus}ASMFR_{a} (t){\times}MP_{a} (t){\times}SR_{a} (t)} \over 2} $$
The four terms on the right-hand side of equation (4) represent the effect of the change in the MFR, the effect of the change in the PMW, the effect of the change in the proportion of girls among newborns (namely the change in sex ratio at birth) and the effect of change in survival rate (mortality rate), respectively. In equation (4),
 $\Delta x$
represents
 $x\left( {t{\plus}h} \right){\minus}x\left( t \right)$
.
Data
Several government departments are responsible for population statistics in China. The Ministry of Public Security manages household registration including birth records. The National Health and Family Planning Commission (NHFPC) implements family planning policy and monitors births. The National Bureau of Statistics (NBS) is the statutory and authoritative statistics department, responsible for conducting population censuses and annual population sample surveys in China. Estimates of the same indicator by different departments may sometimes be markedly discrepant.
The study employed census data released by the NBS as the NBS is the most authoritative and census data are comprehensive, even though these data are flawed and have been criticized as possibly subject to under-reporting (Goodkind, Reference Goodkind2011; Cai, Reference Cai2013). Tabulated census data were used from the 1990, 2000 and 2010 population censuses, including birth data, marriage data, age and sex structure data, and mortality data for the nation, cities, townships and villages (rural areas), as well as data for individual provinces (PCO, 1993, 2002, 2012). The birth data in the 1990 census are for the year 1989. The data for city, township and village populations in the 2000 census were not provided, and are not included in this study.
Some studies have attempted to elucidate the extent of under-enumeration and adjusted the data in China’s census (Goodkind, Reference Goodkind2011). However, there is no consensus on how to do this. Here the census data were used directly, without adjustment, for the following reasons. First, there is no generally accepted fertility level, despite generally accepted under-reporting. Since the early 1990s, the birth number released under the authority of the NBS has been regarded as low, and has been adjusted upward without any details about how such an adjustment was made. Second, as quite a lot of data were employed for this analysis, especially data at the provincial level, it was not feasible to adjust the data in a uniform and generally accepted way. Third, if the data are adjusted, they are actually being manipulated, and such a manipulation would directly affect the conclusions. As under-reporting or concealing of births in the census lowers the estimated marital fertility rate, direct use of census data without adjustment may underestimate the contribution of the marital fertility rate (MFR) to fertility level changes. This bias is acknowledged here, but currently the census data remain the only dataset that can accomplish the study’s goals.
Results
National fertility trends
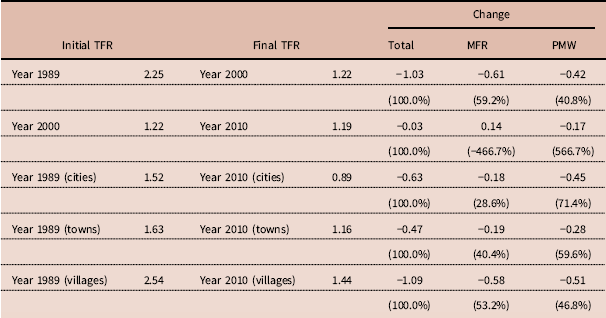
As shown in Table 1, the TFR in China was 2.25 in 1989, and decreased by 1.03 to 1.22 in 2000. Of the 1.03 decrease in the TFR in China, 0.61, or 59.2%, was attributable to a change in the MFR and 0.42, or 40.8%, to a change in the PMW as a result of marriage postponement.

The TFR was 1.22 in 2000, and decreased by 0.03 to 1.19 in 2010. The change in the PMW, namely marriage postponement, led to a decrease in the TFR by 0.17, whereas the change in the MFR caused an increase in the TFR by 0.14 rather than causing it to decline. This marriage postponement and the change in the MFR had opposite effects.
Due to the unavailability of city, township and village population numbers in the 2000 census, only the change from 1989 to 2010 has been decomposed for cities, townships and villages. The TFRs for city, township and village populations exhibit marked differences, with that for village populations (2.54) being greater than that for city populations (1.52) by 1.02 in 1989. Between 1989 and 2010, the TFR for city, township and village populations decreased by 0.63, 0.47 and 1.09, respectively. The change in PMW, namely marriage postponement, contributed 71.4, 59.6 and 46.8% to the decline in city, township and village populations, respectively. Marriage and childbearing postponement dominate the decline in TFR, as women, especially urban women, enjoy more education, higher labour participation and the pursuit of career development. For rural women, both the MFR change and the PMW change contribute significantly to the decline, namely 0.58 and 0.51 in absolute numbers, respectively, indicating a rapid decline in desired number of children as well as a significant marriage and childbearing postponement.
Because of the lack of data in 2000, cities, towns and villages have not been decomposed into sets of data for 1989–2000 and 2000–2010. However, if the data for cities, towns and villages were available and could be divided into two sets of data, similarly to the treatment of the data for the total population, the change in the MFR might have opposite effects on the fertility level at the city, town and village levels between 1989 and 2000 and between 2000 and 2010, as reflected by the effects of the MFR on the fertility level at the national level during these two periods.
Decomposition by age
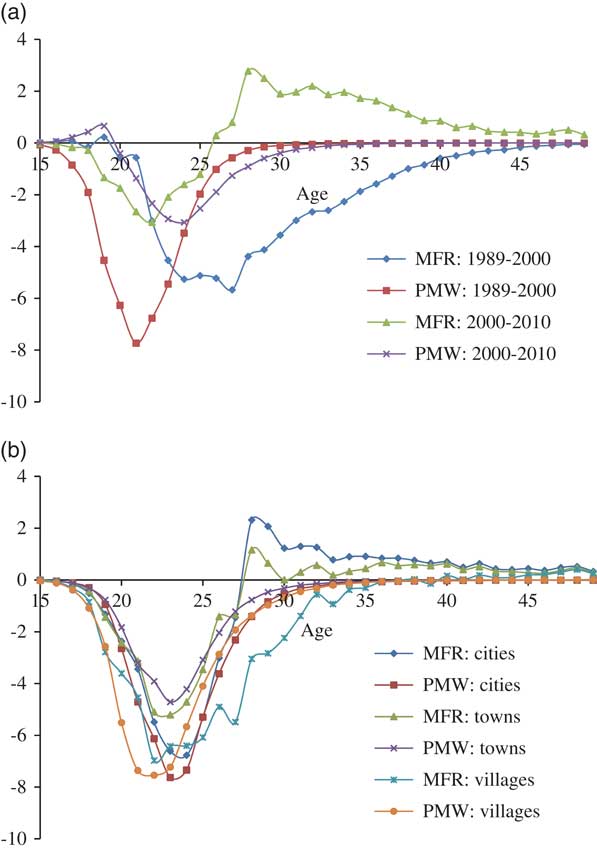
Figure 1 presents the age-specific decomposition of the change in the TFR. Between 1989 and 2000, the MFR declined and marriage was postponed in almost all age groups, causing a decrease in the TFR. Marriage postponement by the relatively young age group (18–26 years) had a noticeable impact on the change in the TFR, whereas marriage postponement by the 35 years and older age group had a very small effect on the change in TFR.
Decomposition of the change in TFR by age (result×100).
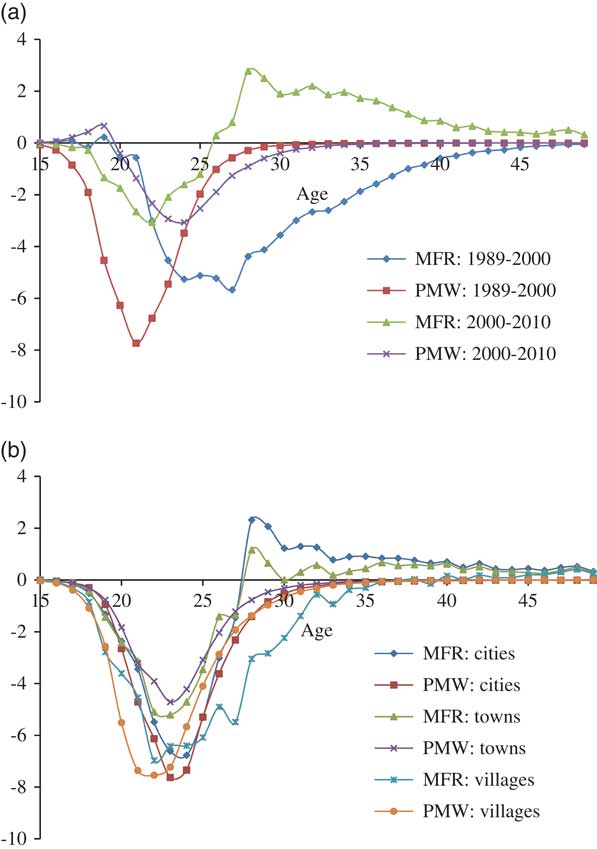
Between 2000 and 2010, the decrease in the MFR in the age group younger than 26 years resulted in a decrease in the TFR, whereas the increase in the MFR in the age group 26 years and older caused an increase in the TFR. The change in the PMW resulted in a decrease in the TFR. However, marriage postponement by ages 35 years and older had an insignificant impact on the TFR.
Between 1989 and 2010, in cities and towns, the change in the MFR for ages younger than 28 years reduced the TFR, whereas the change in the MFR for ages 28 years and older increased the TFR. In villages, the age-specific MFR in the age group younger than 40 years reduced the TFR, whereas the age-specific MFR in the age group 40 years and older increased the TFR. Marriage postponement resulted in a decrease in the TFR. However, marriage postponement by those older than 35 years had very little effect on the TFR.
Even though marriage is postponed, leading to the decrease in PMW for almost all age groups (all age groups for the city populations, younger than 42 age groups for the township and village populations, almost no change for township and village populations older than 42), Chinese women show an almost universal marriage pattern. In 2000 census data, at ages 30 and 35, the percentages of never-married women among all women are 2.22 and 0.61%, respectively. As almost all women aged 35 and older are married, the change in PMW for those older than 35 years doesn’t change much and had a very small effect on the TFR.
The change in the MFR of women under 26 years of age decreases the TFR, but for those aged over 26 it increases the TFR. This reflects the fact that childbearing is delayed due to the postponement of marriage, but as Chinese women still have universal marriage and universal childbearing, childbearing recovers somewhat at later ages.
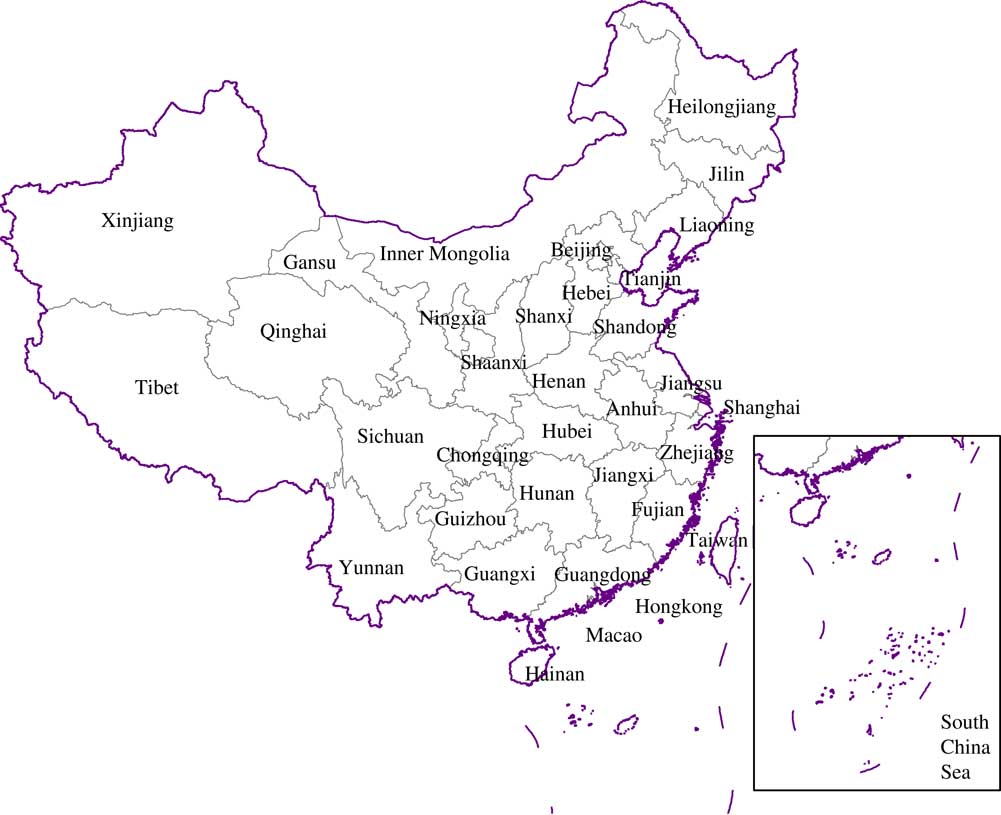
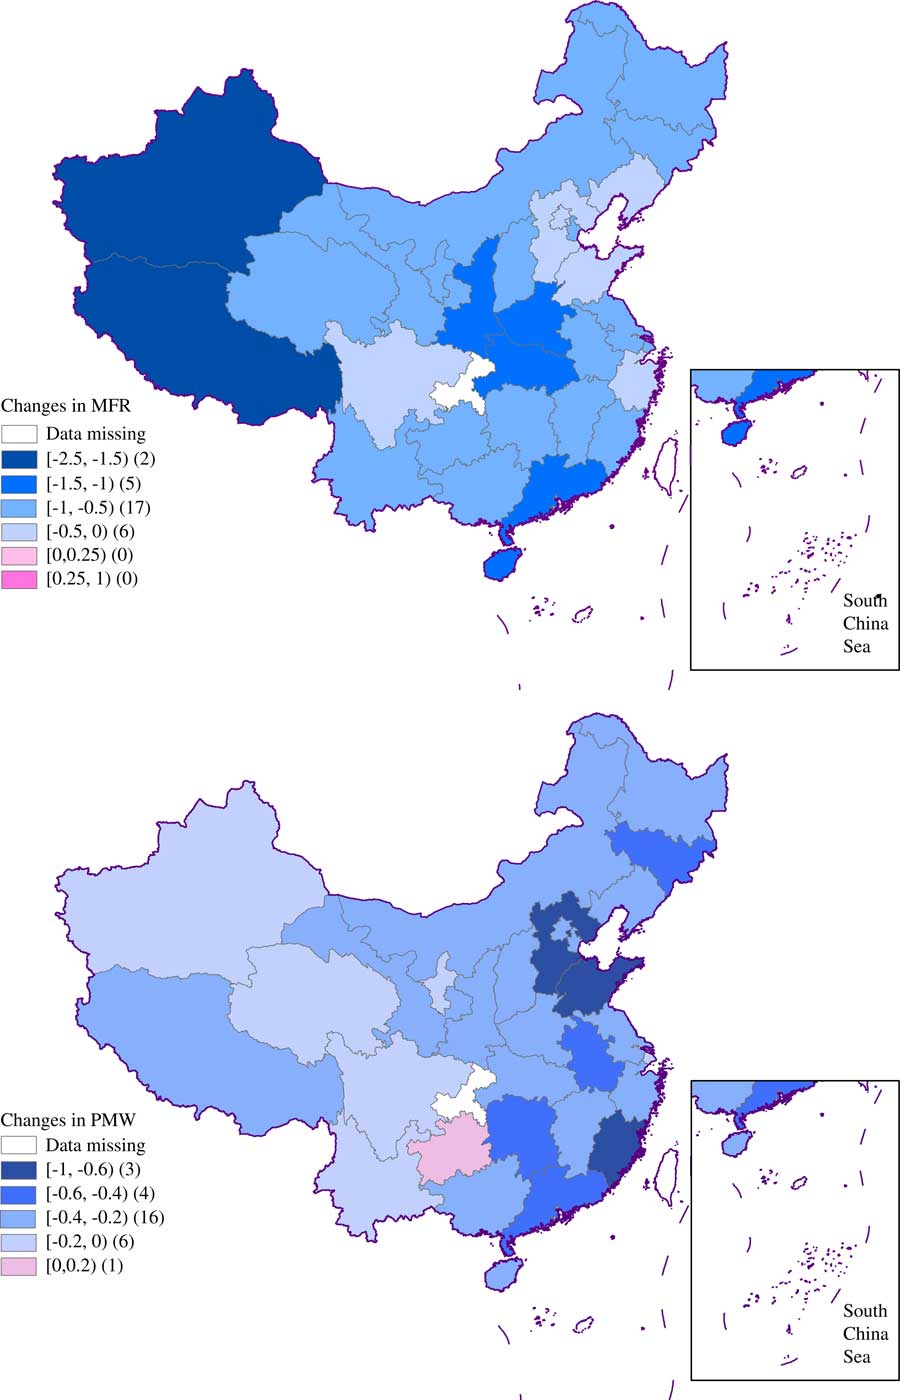
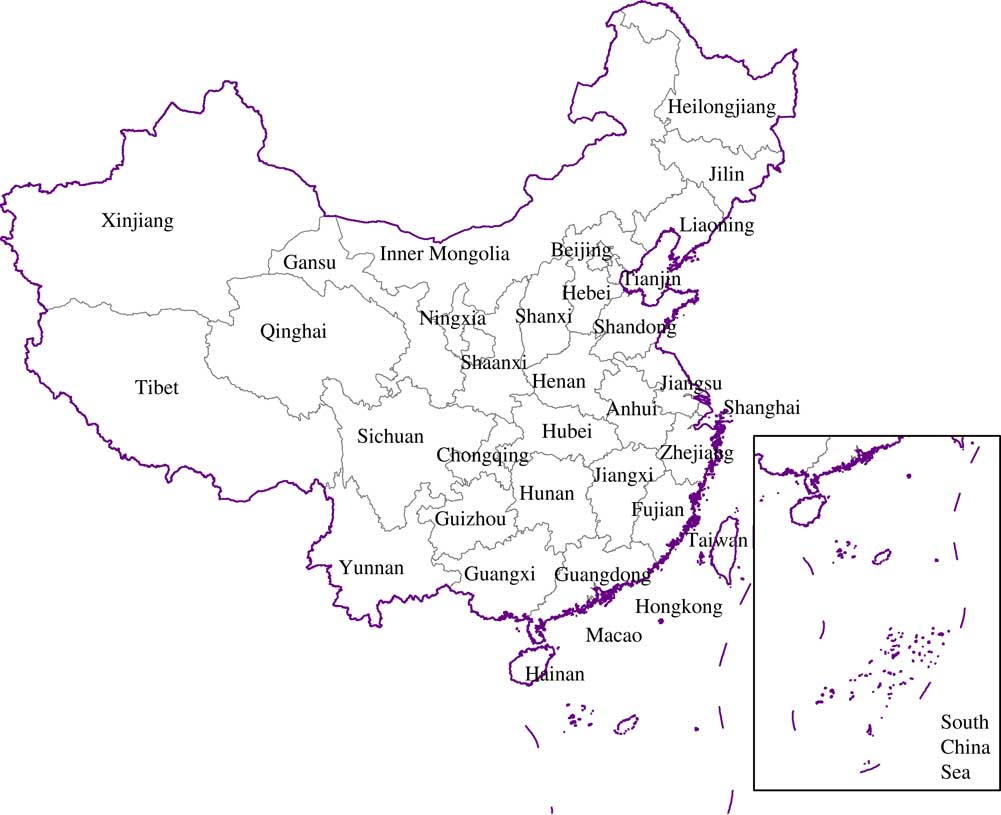
Decomposition by province
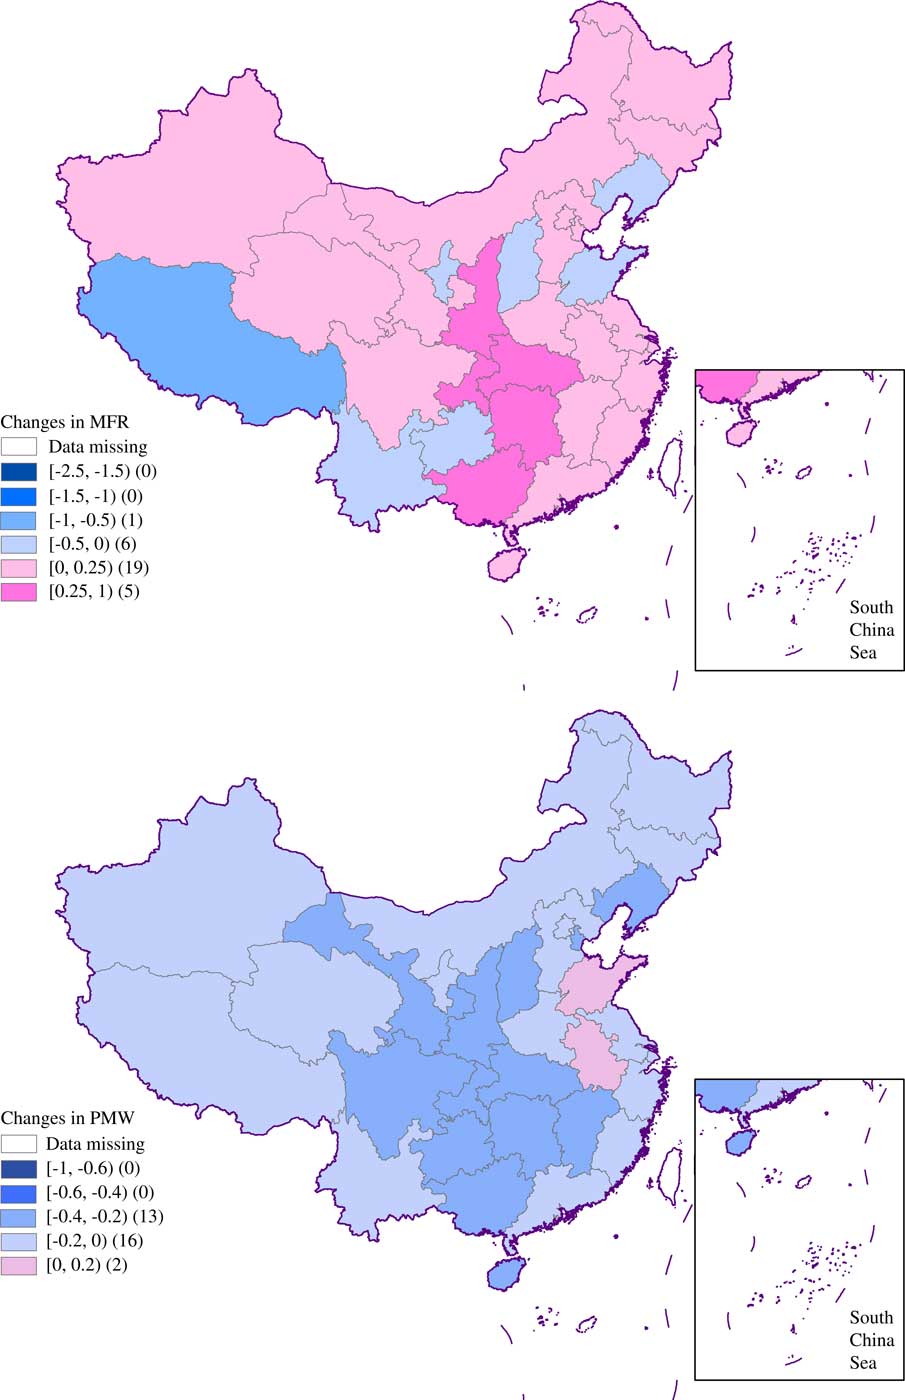
Figure 2 is a map of China showing its provinces. Figures 3–4 present the decomposition results for the TFR change in individual provinces. Between 1989 and 2000, the TFR declined in all provinces. With the exception of Guizhou, where the change in the PMW caused an increase in the TFR, the changes in the MFR and PMW both produced a decrease in the TFR in all provinces. The magnitude of decline in the TFR due to the change in MFR is largest in the two western-most provinces, medium in the five provinces in central and southern China, followed by most provinces in northern and southern China, and smallest in some eastern provinces. The magnitude of decline in the TFR due to the change in PMW exhibits a regional gradient from eastern China to western China, being largest in eastern provinces, medium in central provinces and smallest in western provinces. The regional pattern for the contribution of changes in MFR and PMW from 1989 to 2000 partially reflects the socioeconomic and demographic differences among provinces. The eastern provinces enjoyed economic prosperity and took the lead in marriage postponement; late marriage began to become a common practice, resulting in a larger decline in the fertility rate compared with central and western provinces, whereas in not-so-developed western provinces with a much higher TFR (compared with already very low MFR and TFR in eastern provinces), MFR had more room to change, and there was a larger decline in TFR.
Map of China showing provinces.
Decomposition of the change in TFR in China between 1989 and 2000.
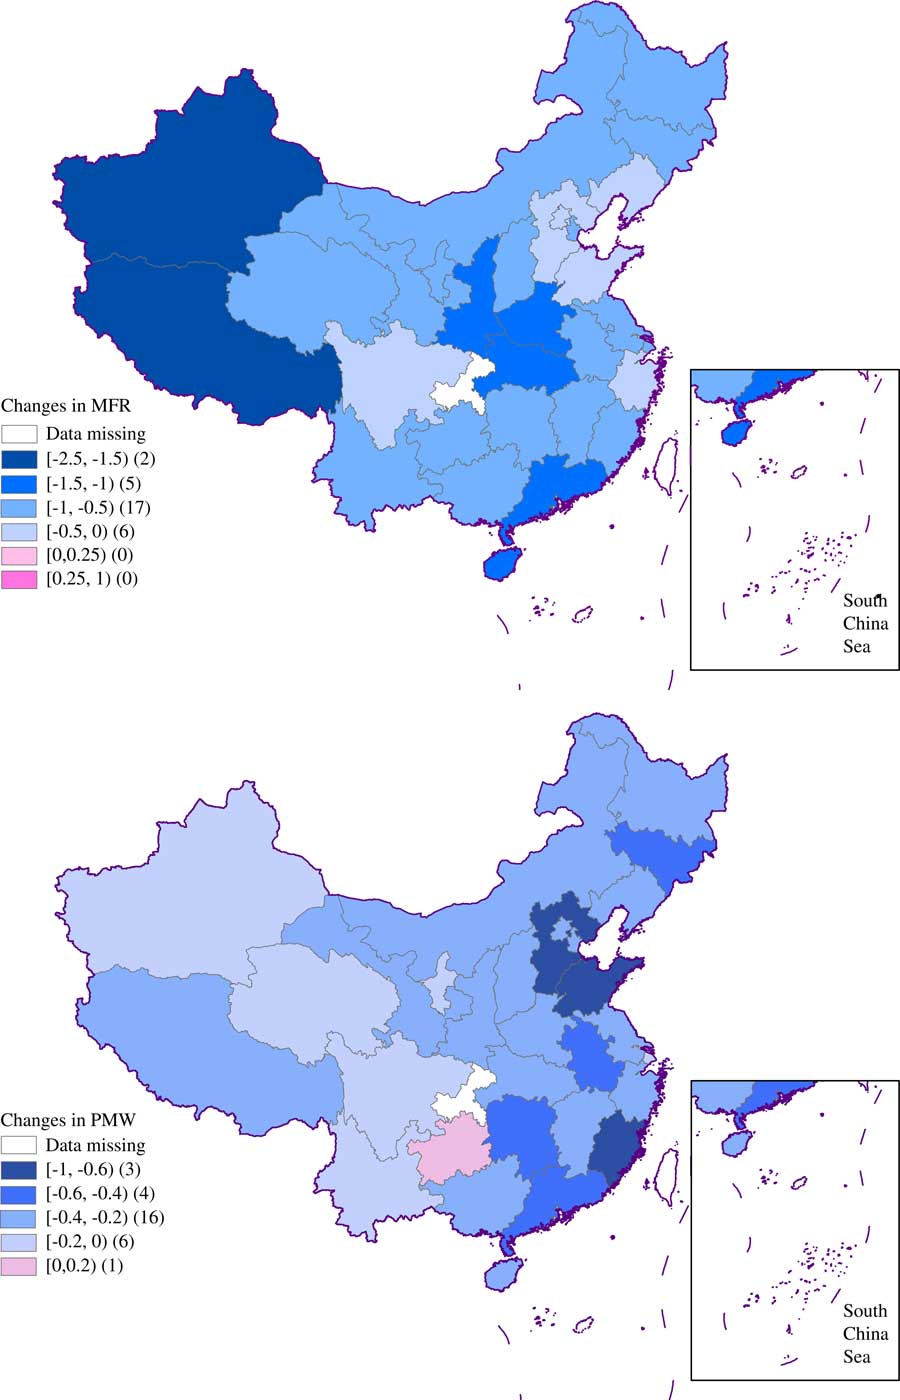
Decomposition of the change in TFR in China between 2000 and 2010.

Between 2000 and 2010, the TFR increased in eleven provinces and decreased in eighteen provinces. The change in the MFR resulted in an increase in the TFR in all provinces except Shanxi, Liaoning, Shandong, Guizhou, Yunnan, Tibet and Ningxia. The provinces in which the change in the MFR resulted in a relatively significant increase in the TFR were concentrated in central and southern China, including Shaanxi, Hubei, Hunan, Chongqing and Guangxi. Marriage postponement reduced the TFR in all provinces except Anhui and Shandong. In most (23) provinces, marriage postponement resulted in a decrease in the TFR by 0–0.30. Marriage postponement made a relatively large contribution to the TFR changes in Jiangxi and the provinces in central China.
The provinces where marriage postponement had a relatively large impact on fertility were mainly distributed in eastern China between 1989 and 2000, and central China between 2000 and 2010, reflecting a geographical transfer effect; late marriage began to become a common practice in the eastern provinces between 1989 and 2000, while central China began to have more late marriages between 2000 and 2010.
Effect on population development
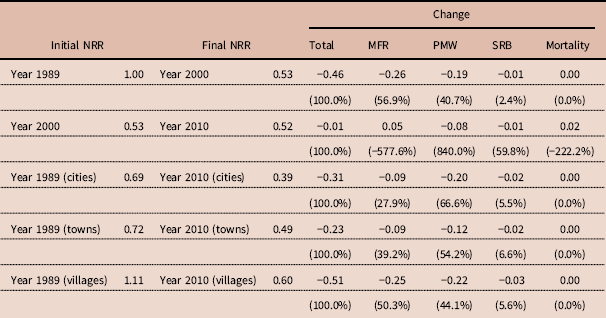
The net reproduction rate (NRR) has been decomposed to estimate the contribution of different factors to population development, as shown in Table 2. The NRR in China was 1.00 in 1989, and decreased by 0.46 to 0.53 in 2000. Of this decrease, 0.26 or 56.9% was attributable to the decrease in the MFR, 0.19 or 40.7% to marriage postponement, 0.01 or 2.4% to the change in the SRB and there was almost no effect of survival rate (mortality level) change.
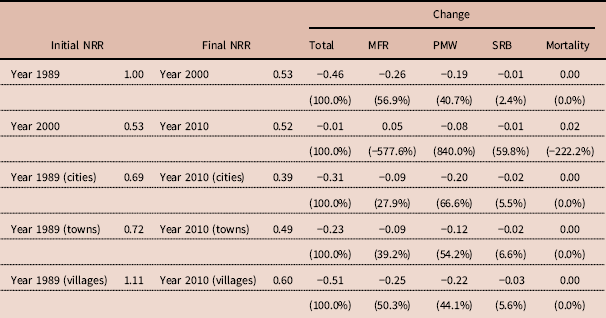
Between 2000 and 2010, the NRR decreased from 0.53 to 0.52. The increase in the MFR increased the NRR by 0.05; marriage postponement reduced the NRR by 0.08, the change in the SRB reduced the NRR by 0.01 and the change in the mortality increased the NRR by 0.02.
In 1989 the NRRs in cities, towns and villages were 0.69, 0.72 and 1.11, respectively, which decreased by 0.31, 0.23 and 0.51 to 0.39, 0.49 and 0.60, respectively, in 2010. Marriage postponement was the primary factor behind the decrease in the NRR in cities and towns, with the change in the MFR and the decrease in the SRB causing smaller decreases in the NRR. The decrease in the MFR was the primary factor causing the decrease in the NRR in villages, with the decrease in the SRB being a minor factor that caused a decrease in the NRR by 0.03.
Discussion
Fertility in China has reached a very low level, and is very likely to decrease further despite the universal two-child policy. Studying the past fertility decline can help in understanding this fertility trend and suggest effective countermeasures to curtail further fertility decline, the likelihood of which has recently raised a great deal of concern in China. The decomposition method used in this study found that a change in the marital fertility rate (MFR) reduced the TFR between 1989 and 2000, and increased the TFR slightly nationwide and in most provinces between 2000 and 2010. The effect of the change in MFR varied with age group over time, reducing the TFR in almost all age groups between 1989 and 2000, and reducing the TFR in the under-26 age group and increasing the TFR in over-26 age group between 2000 and 2010, which suggests a delay in childbearing at young ages and a high likelihood of childbearing recovery at later ages. The slight rise in TFR due to rising marital fertility between 2000 and 2010 indicates a positive trend in curtailing fertility decline. It is possible that the MFR will increase further, leading to an increase in fertility, but only to a very small extent.
Marriage postponement, measured by the change in proportion of married women (PMW), and subsequent childbearing postponement, resulted in a decline in the fertility level. Currently the ages at first marriage and first birth are low, but increasing slowly and steadily (Zhao et al., Reference Zhao, Xu and Yuan2017). It can be predicted that marriage and childbearing postponement will continue to contribute to the decline in TFR in the foreseeable future, even though the magnitude will decrease, as was seen to happen between 2000 and 2010 compared with that between 1989 and 2000. However, since marriage is universal for females in China, it can also be inferred that the contribution of childbearing postponement to the decrease in fertility level in China will decrease in the future and the change in fertility timing will cause an increase in fertility after a certain period of time.
The contributions of the change in martial fertility rate and marriage postponement to fertility change differed between cities, towns and villages between 1989 and 2010, reflecting China’s marked rural–urban difference. Marriage and childbearing postponement dominate the decline in fertility level for urban women. Even compared with such international metropolitan areas as Tokyo, Hong Kong and Singapore, which experienced extraordinary fertility decline and are now regarded as having the lowest of low fertility levels, fertility in China’s urban population has been very low (Zhao et al., Reference Zhao, Xu and Yuan2017). The low marital fertility has left little room for TFR to decline, and the rising marriage and childbearing ages drove the urban TFR decline. For rural women, both the MFR change and the PMW change contribute significantly. But it is seen that the rural TFR has dropped to a very low level, and in the future it will follow the urban pattern, driven down mainly by rising marriage and childbearing ages.
The contributions of the MFR and PMW exhibit regional differences. Between 1989 and 2000, the magnitude of the contribution of the MFR change to the TFR change is largest in the two western-most provinces and smallest in some eastern provinces. Between 1989 and 2000, the magnitude of the decline in TFR due to the change in PMW exhibits a regional gradient from eastern to western China, being largest in eastern provinces, medium in central provinces and smallest in western provinces. However, during 2000–2010, the largest decline in TFR due to the change in PMW occurred in the provinces in central China, indicating a geographic diffusion of marriage postponement from prosperous eastern provinces to the less prosperous central and western provinces. It is likely that western China will also see this trend in the coming years. Marriage postponement decreased the fertility level mainly among younger age groups.
The NRR in China has declined over time from 1.00 (around replacement level) in 1989, to 0.53 in 2000, and further to 0.52 in 2010, due mainly to the change in MFR and marriage postponement. The MFR will increase, and marriage postponement will slow or even cease. The NRR is likely to increase in the future but will remain far lower than replacement level for the foreseeable future.
The present study has certain limitations. It is generally believed that the quality of census data in China is flawed. However, due to the lack of reliable data that can be used to adjust the fertility level, the study used population census data directly, which affects our conclusions of the study. In addition, a decomposition by birth order may illuminate more about the reasons behind the demographic effects studied here. However, the study was limited by data unavailability, and such a decomposition was not feasible. Despite these limitations, the results presented here are still useful for interpreting China’s fertility and population characteristics, and may serve as a reference for the future adjustment and improvement of China’s birth control policy.
In many European countries that have completed their demographic transition, the fertility transition has been characterized by a rapid shift to delayed childbearing, and a low probability of progression after the first birth (Lutz et al., Reference Lutz, Skirbekk and Testa2006). The long-lasting trend towards delayed parenthood has reduced the TFR, and is essential for understanding general post-transitional fertility patterns (Sobotka, Reference Sobotka2017). China is following the same transition pattern. As young women pursue higher education and career development, and respond strategically to economic pressures from skyrocketing real estate prices and the costs of rearing and educating a child, they postpone marriage and childbearing, which lowers fertility rates. It is not likely that there will be a reversal and rebound of China’s fertility in the foreseeable future. The adjacent countries and regions with similar cultural backgrounds and much more developed economies shed light on the path ahead for China. Japan, South Korea, Singapore, Hong Kong and Taiwan have all experienced the fertility transition, are now confronted with persistent low fertility, and are making great efforts to encourage greater fertility but with little effect.
As the most critical demographic variable, fertility determines the future size and structure of a population, the development of its economy and its social well-being. The Chinese government is somewhat aware of the potential effect of persistent low fertility, and adjusted the birth control policy in 2013 to a policy where if either of the couple was an only child they could have a second birth, and in 2016 by a universal two-child policy. However, the birth number decreased in 2017 after a slight increase in 2016, causing a predicament for the current universal two-child birth control policy. Actually, even under the stringent birth control policy, China implemented a universal two-child policy in four experimental zones covering 8 million people. Not surprisingly, the fertility level there was very low – even lower than under the strict birth control policy (Gu & Wang, Reference Gu and Wang2009). On the one hand, the Chinese government is not readily opting for a pronatalist policy after so many years of stringent birth control enforcement. On the other hand, the fertility level and the birth number are going down, contrary to the government’s and academics’ projections, even under the relaxed policy. The Chinese government now states that it encourages people to give birth according to the policy, implicitly implying a reversal from an antinatalist to a partially pronatalist policy, as birth control has not completely ceased. However, such an implicit statement won’t work in raising the fertility level. Taking into consideration the factors that led to China’s low fertility, China should act urgently to reverse the birth control policy to an explicitly pronatalist one.
Ethical Approval
The authors assert that all procedures contributing to this work comply with the ethical standards of the relevant national and institutional committees on human experimentation and with the Helsinki Declaration of 1975, as revised in 2008.
Conflicts of Interest
The authors have no conflicts of interest to declare.
Funding
This work was supported by the Key Project of Social Sciences Foundation of China (Grant No. 15ZDB136) to QJ.