INTRODUCTION
Ribosomal internal transcribed spacer (ITS) sequence data have been successfully employed to study some sponges at the population level, e.g. Axinella corrugata (George & Wilson), Leucetta ‘chagosensis’ (Dendy) and Crambe crambe (Schmidt) (Lopez et al., Reference Lopez, Peterson, Willoughby, Wright, Enright, Zoladz, Reed and Pomponi2002; Wörheide et al., Reference Wörheide, Hooper and Degnan2002; Duran et al., Reference Duran, Giribet and Turon2004 respectively). Ribosomal ITS-1 and/or ITS-2 regions have also been used in conjunction with other gene loci in sponge molecular phylogenies, e.g. the Aplysinidae and freshwater sponges (Addis & Peterson, Reference Addis and Peterson2005; Schmitt et al., Reference Schmitt, Hentschel, Zea, Dandekar and Wolf2005). However, Wörheide et al. (Reference Wörheide, Nichols and Goldberg2004) showed that there were heterogeneous levels of intra-genomic polymorphisms (IGPs) in a diverse range of marine sponge taxa. They concluded that the ITS regions should only be used in phylogenetic studies below the family level as multiple sequence alignments above this level would be too variable to confidently establish homologies. More importantly their work also suggested that care should be taken when using ITS regions due to the different levels of IGPs detected across sponge taxa and recommended that each taxon should be screened to identify and analyse the level of IGPs present (Wörheide et al., Reference Wörheide, Nichols and Goldberg2004). Alvarez et al. (Reference Alvarez, Krishnan and Gibb2007) investigated the intra-genomic variation in the ITS regions in three halichondrid sponges and found at least three different sequence types in any single individual and suggested that the ITS regions are not appropriate markers for fine-scale population studies in species with levels of IGPs greater than 1%.
A number of new phylogenetic relationships have been postulated by molecular data within the demosponge order Haplosclerida. These include the suggestion of close relationships between some members of each of the genera Callyspongia (Duschannaing & Michelotti) and Haliclona (Grant) by mitochondrial cytochrome oxidase I data (mtCOI) (Raleigh et al., Reference Raleigh, Redmond, Delehan, Torpey, van Soest, Kelly and McCormack2007) despite these genera belonging to different families (the Callyspongiidae (de Laubenfels) and Chalinidae (Gray) respectively). In this study we have sequenced the ribosomal ITS regions from multiple specimens of Haliclona (Haliclona cinerea (Grant), Haliclona xena De Weerdt and Haliclona oculata (Pallas)) and single specimens of two Callyspongia in an attempt to further explore relationships between putatively closely related species of Haliclona and Callyspongia suggested by phylogenetic analyses employing other gene loci (e.g. Raleigh et al., Reference Raleigh, Redmond, Delehan, Torpey, van Soest, Kelly and McCormack2007). These data would also be used to determine the degree of IGPs present within some haplosclerid taxa and to ascertain whether the ribosomal ITS regions could be used for fine scale phylogenetic and population analyses within the haplosclerids.
MATERIALS AND METHODS
Specimens
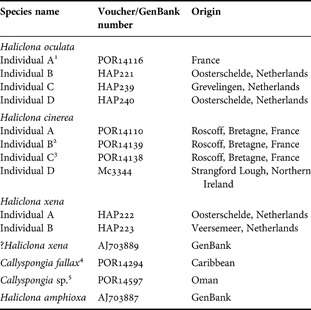
Specimens included in this study were either acquired on loan from the Zoological Museum Amsterdam or collected fresh by Ms Marieke Koopmans (Department of Agrotechnology and Food Sciences, Wageningen University Research Centre, Netherlands) or by Dr Bernard Picton (National Museums Northern Ireland, UK). All specimen details are given in Table 1. The species included in this study were chosen as previous molecular work had suggested they were closely related to one another (e.g. Raleigh et al., Reference Raleigh, Redmond, Delehan, Torpey, van Soest, Kelly and McCormack2007; Redmond et al., Reference Redmond, van Soest, Kelly, Raleigh, Travers and McCormack2007). All specimens were stored in 100% ethanol and/or 6M guanidinium chloride. DNA extraction was carried out as described in Redmond et al. (Reference Redmond, van Soest, Kelly, Raleigh, Travers and McCormack2007).
Specimen information including their voucher or GenBank accession numbers, and geographical origins. Voucher numbers beginning with POR are from the Zoological Museum Amsterdam, HAP are from the Molecular Evolution and Systematics Laboratory, National University of Ireland, Galway and Mc are from National Museums Northern Ireland, UK.

Superscript numbers indicate the same individuals as those in the mtCOI molecular tree in Raleigh et al. (Reference Raleigh, Redmond, Delehan, Torpey, van Soest, Kelly and McCormack2007).1, 6 H. oculata;2, 5 H. cinerea; 3, 8 H. cinerea; 4, 211 C. fallax; 5, 32 Callyspongia sp.
PCR and DNA sequencing
Initially PCR amplification of the section of rDNA containing both the ITS-1 and ITS-2 regions was performed using the primers RA2 (5′ GTCCCTGCCCTTTGTACACA 3′) and HITSR (5′ CCYKGTTRGTTTCTYTTCCTCCGC 3′). The former was obtained from Wörheide et al. (Reference Wörheide, Nichols and Goldberg2004) while the reverse primer was designed from the 5′ end of an existing 28S rRNA gene sequence alignment that contained numerous haplosclerid sequences. All gene fragments were amplified in 50 µl reactions, which comprised 1X PCR buffer (Promega and Phusion), 1.5–2 mM MgCl2, 10 mM dNTPs (Promega), 2 µM primers and 1 unit of Taq polymerase (Promega, Phusion and Biolabs). The temperature regime was an initial denaturation of 94°C for 5 minutes followed by 30 cycles of 1 minute at 94°C, 30 seconds at annealing temperature (between 38°C and 43°C depending on sample) and 1 minute at 72°C. A final extension step of 5 minutes at 72°C finished the regime. Successfully amplified PCR products were gel purified using the RBC Bioscience HiYield Gel/PCR DNA Fragments Extraction Kit as described in the product protocol (Catalogue number YCF100). PCR products from a total of 12 individuals (from two Callyspongia and three Haliclona species) were cloned. For all cloning reactions the Invitrogen TOPO TA Cloning kit (Catalogue number K4500-01) was used and PCR products were ligated into the pCR®2.1-TOPO vector and chemically transformed into competent TOP 10 Escherichia coli cells as outlined in the provided protocols. Purified products from colony PCRs (using the M13F-5′GTAAAACGACGGCCAG 3′ and M13R-5′ CAGGAAACAGCTATGAC 3′ primers), were automatically sequenced in both the forward and reverse directions (MWG-Biotech, Germany). To determine if direct sequencing of ITS PCR products was feasible and to compare the resulting sequences with the sequences from the cloned PCR products, direct sequencing was carried out on PCR products for five Haliclona individuals (three H. oculata individuals, one H. cinerea and one Haliclona sp.).
Sequence analysis
In all cases, the resulting chromatograms from the sequence reactions were assembled into contigs and analysed using the SeqMan II software from the Lasergene package (DNASTAR Inc.) then edited by eye in MacClade 4.0 (Maddison & Maddison, Reference Maddison and Maddison1998). The fully edited consensus sequence was entered into a BLAST algorithm search (Altschul et al., Reference Altschul, Gish, Miller, Myers and Lipman1990) to check for possible contamination. Two haplosclerid sequences that included the complete ITS-1 and ITS-2 regions, Haliclona amphioxa (de Laubenfels) (AJ703887) and Haliclona sp. (AJ703889) were downloaded from GenBank and included in our multiple sequence alignment. To determine the different regions in the rRNA gene sequence, our sequences were compared in a multiple sequence alignment with the H. amphioxa sequence from GenBank that had the location of each region specified. To compare intra- and inter-specific variation, all available ITS-1 and ITS-2 sequences from freshwater sponges, halichondrids and Aplysina (Nardo) were downloaded from GenBank. Further unpublished ITS sequences for freshwater sponges and the secondary structures of the ITS-1 and ITS-2 regions of Baikalospongia bacillifera (Dybowsky) were kindly provided by Valeria Itskovich (Limnological Institute of the Siberian Branch of the Russian Academy of Sciences). These secondary structures were employed in an attempt to align the very variable haplosclerid alignments. Maximum likelihood trees were reconstructed, using PAUP* 4.0b10 (Swofford, Reference Swofford1998), separately for H. oculata, H. cinerea and H. xena using the ITS-1, ITS-2 and the complete sequence (18S, ITS-1, 5.8S, ITS-2 and 28S rRNA). No substitution model was applied as it was immediately obvious that this particular sequence dataset would not be useful for phylogenetic reconstruction (see below). To investigate intra-genomic, intra- and inter-specific variation, uncorrected pairwise distances (P distances) were calculated using PAUP* 4.0b10 (Swofford, Reference Swofford1998).
RESULTS
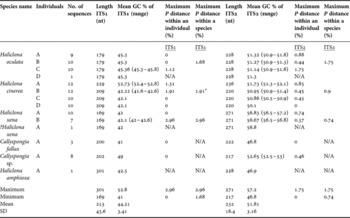
In total, 102 full-length sequences (3′ end of 18S, ITS-1, 5.8S, ITS-2 and 5′ end of 28S rRNA) from the multiple clones, five directly sequenced PCR products and two full-length haplosclerid sequences from GenBank were included. The exact number of clones sequenced per individual is detailed in Table 2. When aligning the ITS sequences it came to our attention that the Haliclona sp. (AJ703889) sequence downloaded from GenBank was identical to the multiple sequences from H. xena and subsequently this sequence was renamed and treated as a ?H. xena individual. The length of the ITS-1 ranged from 169 nucleotides (nt) in H. xena to 301 nt in H. amphioxa, with the mean length 213 nt and standard deviation of 43.6 nt. The GC content in the ITS-1 ranged from 52.8 % in H. cinerea A while Callyspongia fallax (Duchassaing & Michelotti) had a low GC content of 41%. The average was 44.2% and standard deviation was 3.41%. There was less variability in the sequence length of ITS-2 among the various species. Callyspongia sp. had the shortest with a length of 217 nt, while the H. xena individuals had the maximum length of 271 nt. The ITS-2 had an average length of 232 nt and a standard deviation of 18.4 nt. The maximum GC content was found in H. xena individuals with 56.8%, the lowest was again seen in C. fallax with 46.8%. The average was 51.81% and SD was 3.16%.
ITS information including the no. of clones sequenced, sequence length, GC content and p-distances for the different individuals in this study.

*, this P distance value is between the three H. cinerea individuals (B, C, D) as A was too divergent to include in the calculation.
There was a very clear difference between the sequences returned for H. cinerea A in comparison to the sequences for the three other H. cinerea individuals (B, C and D). Although there were very small regions of similarity (<8 nt), overall the variation was so great that the ITS sequences from individual A could not be aligned to individuals B, C and D in a multiple sequence alignment. In the case of H. oculata and H. xena the ITS sequences of individuals within each species were nearly identical and were easily aligned to one another. Reliable alignment of ITS-1 and ITS-2 sequences from all the species included was impossible due to extensive variation in sequence length and nucleotide composition between different species. Attempting to use the secondary structures of both ITS-1 and ITS-2 of the freshwater sponge B. bacillifera to help resolve this problem was unsuccessful. Due to this high level of sequence divergence between species, and the lack of reliable sequence alignments, inter-specific pairwise distances could not be calculated. Also, a phylogenetic tree of all species could not be reconstructed using this molecular marker.
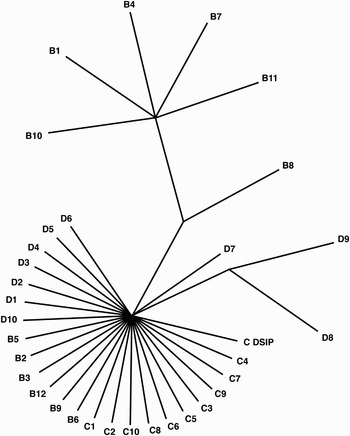
There was no intra-genomic variation in the ITS-1 data in the multiple sequences from Haliclona cinerea C and D, Haliclona oculata A and B, Haliclona xena A, Callyspongia sp. and Callyspongia fallax. For the four remaining individuals the maximum intra-genomic P distances ranged from 1.12% in H. oculata C to 2.96% in H. xena B. In the ITS-2 region, only two of the 11 individuals had identical sequences for all sequenced clones and the intra-genomic P distance of the remaining individuals ranged from 0.37% in H. xena B to 1.75% in H. cinerea C for this region (Table 2). Significantly, intra-specific divergence was no larger than intra-genomic divergence, although the minimum increased to 1.68% and 0.74% for ITS-1 and ITS-2 respectively (Table 2 for full summary). Figure 1 shows the phylogenetic tree reconstructed with the complete sequences (3′ end of 18S rRNA/ITS-1/5.8S rRNA/ITS-2/5′ end of 28S rRNA gene) of three H. cinerea individuals (B/C/D). The multiple sequences from each individual did not form monophyletic groups, a result consistent for all three Haliclona species for all three datasets (ITS-1, ITS-2 and complete sequence). For sites where IGPs were present, the nucleotide present in the directly sequenced PCR product was found in a high proportion, of the sequenced clones.
An unrooted ML tree of all sequences from the three individuals of Haliclona cinerea (B, C and D) based on the complete sequence (3′ end of 18S rRNA /ITS-1/5.8S rRNA/ITS-2/5′ end of 28S rRNA gene). All sequences from each individual are indicated by the individuals' letter and the number directly after is the sequence number. C DSIP, the directly sequenced PCR product from H. cinerea C.

DISCUSSION
The two ITS spacer regions of the nrRNA evolve quite rapidly in comparison to the functional 5.8S, 18S and 28S rRNA genes and have been used in previous studies to infer phylogenies among closely related taxa and/or as markers in population studies of various organisms (e.g. Odorico & Miller, Reference Odorico and Miller1997; Hackett et al., Reference Hackett, Gimnig, Guelbeogo, Costantini, Koekemoer, Coetzee, Collins and Besansky2000; Leo & Barker, Reference Leo and Barker2002; Mello et al., Reference Mello, Ghignone, Vizzini, Sechi, Ruiu and Bonfante2006). To the authors' knowledge no previous work on marine haplosclerid ITS has been carried out, and this is the first to utilize these regions in an attempt to resolve taxonomic and phylogenetic questions within this order. However, this work clearly confirms that caution is necessary when using the ITS region for phylogeny reconstruction, particularly within haplosclerids. This locus is not suitable for use in population level studies for the species included here (and possibly all marine haplosclerids), as the level of intra-specific diversity was almost equivalent to the intra-genomic variation.
Previous molecular phylogenies have suggested that neither Callyspongia nor Haliclona were monophyletic and that some Haliclona species were more closely related to Callyspongia species than to other Haliclona species (e.g. McCormack et al., Reference McCormack, Erpenbeck and van Soest2002; Nichols, Reference Nichols2005; Raleigh et al., Reference Raleigh, Redmond, Delehan, Torpey, van Soest, Kelly and McCormack2007). In these molecular trees many small clades containing Haliclona and Callyspongia species had high support and short branch lengths indicating that they had very close affinities. Therefore, we expected to be able to support the mtCOI phylogeny of Raleigh et al. (Reference Raleigh, Redmond, Delehan, Torpey, van Soest, Kelly and McCormack2007) using ITS data and further elucidate levels of diversity between various Haliclona and Callyspongia species. The high level of inter-specific divergence in ITS sequences between the six species included was totally unexpected. The considerable differences in length and extensive variability of the ITS-1 and ITS-2 sequences meant it was impossible to confidently establish homologies in the multiple sequence alignment between all studied species and therefore no phylogeny could be reconstructed. In contrast, Itskovich et al. (personal communication) were able to reconstruct a phylogeny of freshwater sponges including species from different families. Freshwater sponges were considered the third suborder in the order Haplosclerida until recent molecular studies showed they were more closely related to other sponge orders than to marine haplosclerids (e.g. Itskovich et al., Reference Itskovich, Belikov, Efremova, Masuda, Perez, Alivon, Borchiellini, Boury-Esnualt, Custódio, Lôbo-Hajdu, Hajdu and Muricy2007; Redmond et al., Reference Redmond, van Soest, Kelly, Raleigh, Travers and McCormack2007). The different patterns in ITS diversity between marine and freshwater sponges may add support to this conclusion. ITS data were also employed to reconstruct phylogenies of eight species from the genus Aplysina and of seven species from the family Axinellidae (Carter) (Lopez et al., Reference Lopez, Peterson, Willoughby, Wright, Enright, Zoladz, Reed and Pomponi2002; Schmitt et al., Reference Schmitt, Hentschel, Zea, Dandekar and Wolf2005). To the authors' knowledge, the level of diversity seen in the marine haplosclerids has not been described in other sponge groups. Molecular evolution in haplosclerids, particularly in the 18S and 28S ribosomal genes, would appear to operate somewhat differently from other demosponges including the presence of large insertion/deletion events (e.g. Erpenbeck et al., Reference Erpenbeck, McCormack, Breeuwer and van Soest2004; Redmond & McCormack, Reference Redmond and McCormack2008). Perhaps the diversity in ITS described here reflects these findings given that these spacer regions are positioned between those genes.
Overall the ITS-2 region was longer than the ITS-1 region, a result consistent with freshwater sponges but opposite to that seen in the 11 demosponge species included in Wörheide et al. (Reference Wörheide, Nichols and Goldberg2004) and the three halichondrid sponges in Alvarez et al. (Reference Alvarez, Krishnan and Gibb2007). The ITS-1 region of the majority of haplosclerid taxa had a GC content in the low to mid 40s whereas GC% in other demosponge ITS was higher, e.g. average of 57.3% (SD±0.02) in freshwater sponges, while sequences from the orders Dictyoceratida, Hadromerida and Agelasida had GC% ranging from low to mid 50s (Wörheide et al., Reference Wörheide, Nichols and Goldberg2004). The same pattern was seen in the ITS-2 although GC% was higher. It has been speculated that there may be a relationship between a high GC content and ambient temperature (Wörheide et al., Reference Wörheide, Nichols and Goldberg2004), but C. fallax, which originated in the Caribbean, had the lowest GC content for both ITS regions in comparison to the other taxa that all originated in more temperate habitats.
ITS sequence variability suggests that H. cinerea A may be a different species from the other H. cinerea individuals. Contamination of DNA was excluded as an explanation as DNA was extracted from these individuals multiple times with the same result, and a sponge origin of the DNA sequences was confirmed through a BLAST search (Altschul et al., Reference Altschul, Gish, Miller, Myers and Lipman1990). Another possibility for the high level of ITS variability could be due to the presence of paralogous copies, but this does not seem to be the case as the sequences from the multiple clones were nearly, if not, identical. Yet, voucher specimens of H. cinerea A and H. cinerea B showed the same skeletal structure and morphologically they were identified as the same species. This provides further evidence that the morphological characters employed in haplosclerid classification, for H. cinerea at least, are plastic. These results strongly indicate that H. cinerea is not a single species and may represent a species complex. Jones (Reference Jones, Vacelet and Boury-Esnault1987), in his study on Haliclona rosea (Bowerbank), felt that the name ‘H. cinerea’ had little taxonomic importance as there was a history of misidentification of, and confusion about, the species. Future work will need to be carried out to confirm the status of H. cinerea using a greater number of individuals from different geographical locations and a different approach such as microsatellites and nuclear introns (e.g. Bentlage & Wörheide, Reference Bentlage and Wörheide2007).
Haliclona cinerea B and C were collected from the same location in Roscoff, France and H. cinerea D was collected in Strangford Lough, Belfast, an approximate distance of 650 to 700 km. Haliclona cinerea is viviparous meaning the embryo develops within the body before a free swimming larva is released. Haplosclerid larvae are parenchymellae (Ereskovskii, Reference Ereskovskii1999; Leys & Ereskovsky, Reference Leys and Ereskovsky2006) and although there is a lack of knowledge of the dispersal patterns of Haliclona, in the case of another haplosclerid sponge, Amphimedon queenslandica (Hooper & van Soest) (formerly Reniera sp.), once the parenchymella larvae are released they generally settle within two days but have the ability to swim for up to a week (Leys & Degnan, Reference Leys and Degnan2002). Considering the ITS evolves so quickly, it could be hypothesized that a certain amount of genetic variation would be seen between individuals from the two different locations. However, this was not the case as the majority of ITS sequences from individuals B, C and D were identical. This may not be surprising given the described distribution patterns of this species, i.e. H. cinerea has been collected from a large number of locations between Strangford Lough, Belfast, and Roscoff, France (de Weerdt & Stone, Reference de Weerdt and Stone1989). There were also low levels of intra-specific variation for H. oculata and H. xena. Three of the H. oculata originated in France with the fourth individual collected in The Netherlands (an approximate distance of 600 km), and the two individuals of H. xena collected by Marieke Koopmans originated in The Netherlands. The ?H. xena sequence was downloaded from GenBank and the origin is unknown. On the gene trees for each species, individuals from separate geographical locations were interspersed, and also sequences from multiple clones for each individual were mixed. Since the intra-genomic and intra-specific diversity were practically equivalent, this has negative implications for the use of the ITS regions as a phylogenetic marker at the population level for these species and putatively all of the marine haplosclerids.
ACKNOWLEDGEMENTS
This work was funded by the Irish Research Council for Science, Engineering and Technology (IRCSET) and the Millennium Research Fund, National University of Ireland, Galway. The authors would like to thank Marieke Koopmans, Bernard Picton, Rob van Soest and Michelle Kelly for specimens. All experiments were carried out in Ireland and complied with Irish law.